15 January 2014
3QFY14 Results Update | Sector:
Automobiles
Exide Industries
BSE SENSEX
21,289
Bloomberg
Equity Shares (m)
M.Cap. (INR b) / (USD
b)
52-Week Range (INR)
S&P CNX
6,321
EXID IN
850.0
CMP: INR105
TP: INR110
Neutral
Low utilization and high marketing spends impact performance
Exide’s (EXID) 3QFY14 performance was sharply below our expectation, led by weak
89.1/1.4
demand across segments and consequent low capacity utilization. This coupled with
148/102
higher marketing spends impacted operating performance significantly.
-11/-27/-35
1, 6, 12 Rel. Per (%)
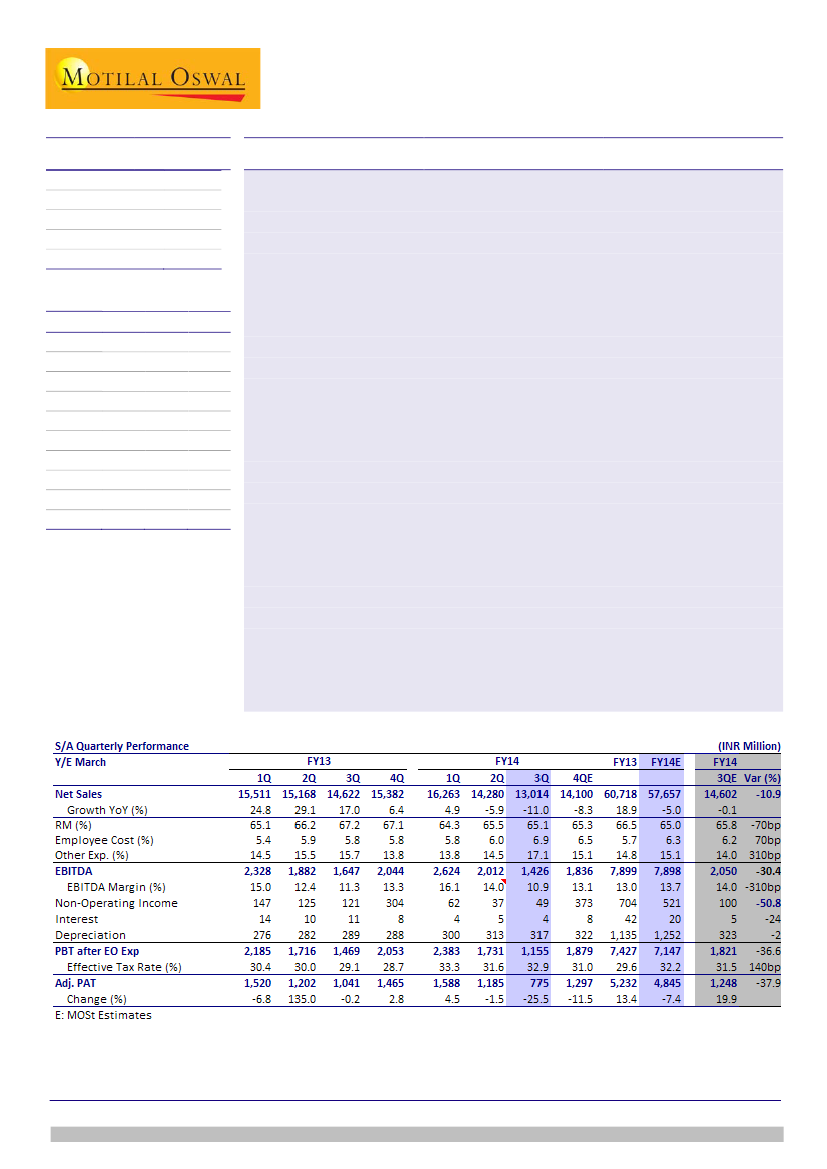
Result highlights:
Net sales de-grew 11% to INR13b (v/s est. INR14.6b) driven by weak demand
Financials & Valuation (INR Million)
across product categories. Auto OEMs declined 8%, Industrial by 17%, Inverters by
Y/E MAR 2014E 2015E 2016E
37%, while replacement segment was largely flat.
Net Sales 57,657 63,192 70,591
EBITDA margin stood at 10.9% (v/s est. 14%). Sequentially, margin declined by
EBITDA
7,898 8,398 9,634
310bp, led by a sharp increase in other expenditure to 17.1% (260bp QoQ), on
Adj PAT
4,845 5,450 6,215
higher marketing spends and low capacity utilization.
Adj.EPS
5.7
6.4
7.3
PAT declined 26% YoY to INR775m (on a low base) on weak operational
(INR)
Growth
-7.3
12.5
14.0
performance.
(%)
BV/Share
43.9
48.0
53.0
Earnings call highlights:
1) inverters (22-25% of FY13 revenue) declined sharply on
(INR)
RoE (%)
13.5
13.9
14.5
unfavorable weather and improvement in power availability. Structurally, the inverter
RoCE (%)
18.0
17.4
18.3
segment is unlikely to grow over the long term, 2) replacement demand expected to
P/E (x)
18.4
16.3
14.3
remain muted over the near term, reflecting weak OEM demand during FY12-14, 3)
P/BV (X)
2.4
2.2
2.0
average price cut of 8-10% effective Nov-13 post the 5-6% hike in Sept-13, 4) capex
guidance of INR2-2.8b for FY14 and 5) continues to focus on cost control and
technology upgradation initiatives.
Downgrade earnings, maintain Neutral:
We cut FY14E/15E/16E EPS by
12.7%/17%/16.4% to factor the dismal 3Q performance, weak demand outlook (for
inverters, replacement) and limited visibility on margin improvement. The stock trades
at 18.4x/16.3x/14.3x our current FY14E/15E/16E EPS of INR5.7/6.4/7.3 respectively.
Maintain
Neutral
with a target price of INR110 (13x FY16E EPS and INR15 for the
insurance valuation).
Jinesh Gandhi
(Jinesh@MotilalOswal.com); +91 22 3982 5416
Chirag Jain
(Chirag.Jain@MotilalOswal.com); +91 22 3982 5418
Investors are advised to refer through disclosures made at the end of the Research Report.

Exide Industries
Weak demand across segments impacts performance
Net sales de-grew 11% to INR13b (v/s est INR14.6b) driven by weak demand
across product categories.
Auto OEMs declined by 8% YoY, while motorcycle OEM demand was flat.
Growth in Auto replacement segment was flat. Within replacement, while PV
segment grew marginally, HCVs, LCVs and PV (taxi segment) declined.
Motorcycle replacement demand grew by 5%.
Inverter segment declined by 37% YoY due to unfavorable monsoon (extended
winter) and incremental improvement in power situation.
Inverters contributed 22-25% of Exide’s FY13 revenues (including 7-8% of UPS
revenue share). Exide has over 80% share in the organized inverter segment,
while has 40-42% share in the UPS category.
Industrial segment also declined by 17% YoY. Traction and Power Projects
segment declined sharply where Exide has 80%/90% share respectively.
EBITDA margins stood at 10.9% (v/s est 14%). Sequentially, margins have
declined by 310bp led by sharp rise in other expenditure to 17.1% (260bp QoQ)
on higher marketing spends and low capacity utilization.
Marketing spends expected to remain at elevated levels to enhance the brand
image.
Exide undertook price cut of 8-10% in Nov-13, post 5% and 7.5% price hike in
Apr/May-13 and Sep/Oct-13.
Around 70% of its key RM (lead) are forex dependent. Average cost of lead
remained stable at INR152,000 (v/s INR154,000 in 2Q and INR147,000 in 1Q).
Other income declined to INR49m (v/s est INR121m) due to reduction in liquid
investments. Management highlighted drop in other income for FY14 (v/s FY13).
PAT declined by 26% YoY to INR775m (on low base) led by weak operational
performance.
To improve its performance, the company has undertaken cost control and
technological up-gradation initiatives. However, the company noted that
competitive environment continues to remain highly intense.
Gross margins marginally improves
Gross margin (%)
40
30
20
10
0
-10
-20
Revenues decline led by weakness across segments
Net sales (INR mn)
20,000
15,000
10,000
5,000
0
Growth (%) (RHS)
Source: MOSL, Company
15 January 2014
2

Exide Industries
With weak OE and steady replacement, mix improves
4W OEM: Replacement ratio (x)
2W mix remains largely stable
2W OEM:Replacement ratio (x)
Source: MOSL, Company
Margin drops on lower weak demand, high marketing cost
EBITDA margin (%)
Sharp PAT decline on weak operating performance
PAT (INR mn)
2,000
1,500
1,000
500
0
Growth (%)
150.0
100.0
50.0
-
(50.0)
(100.0)
Source: MOSL, Company
Trend in lead prices
Source: MOSL, Bloomberg
Earnings call highlights
Low capacity utilization (~70%) the key reason for weak performance. Capacity
utilization stands at 71% for Auto OEMs, 76% for 2Ws and 63% for Industrial.
Weak OE demand during FY12-14 would exert pressure in the replacement
segment considering an average replacement cycle of 3 years.
15 January 2014
3

Exide Industries
Structurally, inverter segment seems unlikely to record growth due with
improvement in power situation led by multiple power projects coming on
stream and near term elections.
On the positive front, the inverter battery capacity can be used for other
applications.
Recovery in industrial segment to be driven by economic recovery.
Plans to re-enter the telecom segment with cost competitive product compared
to earlier (achieved based on value engineering).
Currently, has 8% share in telecom segment. Plans to take share upto 20% and
25% by FY15 and FY16 respectively.
Exide would like to maintain pricing premium of 5% over Amara Raja. However,
Amara Raja has broadly followed pricing action of Exide’s thereby the overall
premium remaining largely constant at 10-15%.
Despite sharp capacity increase by Amara Raja in FY15, Exide do not expect any
price war in the industry (considering past practices in the industry).
Recently launched cost competitive Boss brand (35-40% lower priced than
flagship Exide brand) is performing reasonably well. However, the management
does not expect this brand to contribute significantly to volumes.
Exide have maintained its market share in 4W replacement. However, in OEM
share has declined to 62%.
Capex guidance of INR2.8b for FY14, to be largely used for quality improvement,
technological up-gradation and pollution control.
Exide currently does not have any plans to sell stake in ING Life Insurance.
Exide capacity stands at 22m units for 2Ws, 12.2m units for 4Ws and 2.5m Amph
for Industrial segment.
Valuation and View
We cut our FY14E/15E/FY16E EPS by 12.7%/17%/16.4% to factor in dismal 3Q
performance, weak demand outlook (for inverters, replacement) and limited
visibility on margin improvement.
Significant capacity addition by Amara Raja in FY15 could exert further pressure
on profitability in the absence of demand recovery.
The stock trades at 18.4x/16.3x/14.3x our current FY14E/15E EPS/FY16E of
INR5.7/6.4/7.3 respectively. Maintain
Neutral
with target price of INR110 (13x
FY16E EPS and INR15 for insurance valuation).
Revised forecast
(INR m)
Rev
Net Sales
57,657
EBITDA Margin (%)
13.7
PAT
4,844.5
EPS (Rs)
5.7
FY14E
FY15E
FY16E
Old Chg (%)
Rev
Old Chg (%)
Rev
Old Chg (%)
60,835
-5.2 63,192 68,207
-7.4 70,591 77,845
-9.3
14.7 -100bp
13.3
14.7 -140bp
13.6
14.6 -100bp
5,550.8
-12.7 5,450.1 6,569.9
-17.0 6,214.7 7,433.8
-16.4
6.5
-12.7
6.4
7.7
-17.0
7.3
8.7
-16.4
Source: MOSL
15 January 2014
4

Exide Industries
Exide Industries: an investment profile
Company description
EXIDE Industries (EXIDE) is the largest lead acid battery
manufacturer in India with market leadership in auto
OEM and replacement segment. Exide derives ~60% of
revenues from auto segment, while balance comprises
industrial revenues. The company has also recently
entered into Home UPS/Inverter segment.
Recent developments
Exide has recently launched Boss brand (35-40%
lower price v/s flagship Exide brand) to take on the
unorganized segment.
Valuation and view
Key investment arguments
Economic recovery to drive demand in the auto
OEM and industrial segment
However, 4W replacement demand is expected to
moderate over FY14E-16E, reflecting weak OEM
demand of FY12-14.
Inverter segment (22-25% of FY13 revenues, high
margin business) structurally unlikely to grow at a
healthy rate given improved power availability.
Continued economic slowdown could further put
pressure on revenue growth
New capacity being commissioned by Amara Raja
(key competitor) in FY15 (~40% capacity expansion),
Exide’s margins come under pressure in FY15.
The stock trades at 18.4x/16.3x/14.3x our current
FY14E/15E EPS/FY16E of INR5.7/6.4/7.3
respectively. Maintain Neutral with target price of
INR110 (13x FY16E EPS and INR15 for insurance
valuation).
Sector view
Key investments risks
Battery industry is a good proxy play on auto
industry. While near term auto demand outlook is
weak, over the long term auto industry offers
healthy growth opportunity.
While, over the last couple of years, Amara Raja
has become a formidable competitor to Exide, the
overall industry structure continue to remain
favorable and duopolistic in nature.
Growth in industrial battery revenues is driven by
growth in economic activity, power shortages and
weather conditions (temperature).
EPS: MOSL forecast v/s consensus (INR)
MOSL
Forecast
FY14
FY15
5.7
6.4
Consensus
Forecast
6.9
8.0
Variation
(%)
-17.4
-20.5
Target price and recommendation
Current
Price (INR)
105
Target
Price (INR)
110
Upside
(%)
4.8
Reco.
Neutral
Shareholding pattern (%)
Promoter
Domestic Inst
Foreign
Others
Dec-13
46.0
16.1
17.6
20.3
Sep-13
46.0
15.8
17.8
20.4
Dec-12
46.0
13.3
17.1
23.6
Stock performance (1-year)
15 January 2014
5

Exide Industries
Financials and valuation
Income statement
Y/E March
Net Sales
Change (%)
EBITDA
EBITDA Margin (%)
Depreciation
EBIT
Interest
Other Income
Extraordinary items
PBT
Tax
Tax Rate (%)
Reported PAT
Adjusted PAT
Change (%)
2013
60,714
18.9
7,841
12.9
1,135
6,706
42
759
0
7,423
2,195
29.6
5,228
5,228
13.4
2014E
57,657
-5.0
7,898
13.7
1,252
6,646
20
521
0
7,147
2,302
32.2
4,845
4,845
-7.3
(INR Million)
2015E
63,192
9.6
8,398
13.3
1,382
7,016
20
846
0
7,842
2,392
30.5
5,450
5,450
12.5
2016E
70,591
11.7
9,634
13.6
1,517
8,116
20
846
0
8,942
2,727
30.5
6,215
6,215
14.0
Ratios
Y/E March
Basic (INR)
EPS
Cash EPS
Book Value
DPS
Payout (incl. Div. Tax.)
Valuation(x)
P/E
Cash P/E
Price / Book Value
EV/Sales
EV/EBITDA
Dividend Yield (%)
Profitability Ratios (%)
RoE
RoCE
Turnover Ratios (%)
Asset Turnover (x)
Debtors (No. of Days)
Inventory (No. of Days)
Creditors (No. of Days)
Leverage Ratios (%)
Net Debt/Equity (x)
2013
6.2
7.5
40.3
1.6
30.4
17.0
14.0
2.6
1.5
11.3
1.5
16.1
19.9
1.8
30.6
70.2
38.7
0.0
2014E
5.7
7.2
43.9
1.8
35.9
18.4
14.6
2.4
1.5
11.0
1.7
13.5
18.0
1.6
29.6
67.2
39.0
0.0
2015E
6.4
8.0
48.0
2.0
36.5
16.3
13.0
2.2
1.3
10.0
1.9
13.9
17.4
1.6
28.6
64.2
38.9
0.0
2016E
7.3
9.1
53.0
2.0
32.0
14.3
11.5
2.0
-0.1
-0.8
1.9
14.5
18.3
1.6
27.6
61.2
39.0
0.0
Balance sheet
Y/E March
Share Capital
Reserves
Net Worth
Debt
Deferred Tax
Total Capital Employed
Gross Fixed Assets
Less: Acc Depreciation
Net Fixed Assets
Capital WIP
Investments
Current Assets
Inventory
Debtors
Cash & Bank
Loans & Adv, Others
Curr Liabs & Provns
Curr. Liabilities
Provisions
Net Current Assets
Total Assets
2013
850
33,386
34,236
71
977
35,284
19,002
9,058
9,944
588
16,401
18,550
11,671
5,092
748
1,040
10,200
8,229
1,971
8,351
35,284
2014E
850
36,490
37,340
71
1,135
38,546
22,040
10,310
11,730
350
16,401
18,549
10,609
4,678
1,983
1,279
8,484
6,112
2,372
10,065
38,546
(INR Million)
2015E
2016E
850
850
39,951 44,177
40,801 45,027
71
71
1,252
1,386
42,125 46,485
24,040 26,540
11,693 13,210
12,348 13,330
350
350
16,401 16,401
22,405 26,648
11,109 11,829
4,953
5,340
4,942
7,914
1,401
1,565
9,379 10,244
6,699
7,483
2,681
2,762
13,026 16,404
42,125 46,485
E: MOSL Estimates
Cash flow statement
Y/E March
OP/(Loss) before Tax
Depreciation
Others
Interest
Direct Taxes Paid
(Inc)/Dec in Wkg Cap
CF from Op. Activity
(Inc)/Dec in FA & CWIP
(Pur)/Sale of Invt
Others
CF from Inv. Activity
Inc/(Dec) in Net Worth
Inc / (Dec) in Debt
Interest Paid
Divd Paid (incl Tax)
CF from Fin. Activity
Inc/(Dec) in Cash
Add: Opening Balance
Closing Balance
2013
7,423
1,135
0
-663
-1,950
-2,352
3,597
-1,587
-214
0
-1,801
0
0
-47
-1,578
-1,625
171
577
748
2014E
6,646
1,252
0
521
-2,144
-479
5,796
-2,800
0
0
-2,800
0
0
-20
-1,740
-1,760
1,236
748
1,984
(INR Million)
2015E
7,016
1,382
0
846
-2,274
-2
6,968
-2,000
0
0
-2,000
0
0
-20
-1,989
-2,009
2,959
1,983
4,942
2016E
8,116
1,517
0
846
-2,593
-406
12,667
-2,500
0
0
-2,500
0
0
-20
-1,989
-2,009
8,158
4,942
13,100
15 January 2014
6

Exide Industries
NOTES
15 January 2014
7

Disclosures
This report is for personal information of the authorized recipient and does not construe to be any investment, legal or taxation advice to you. This research report does not constitute an offer, invitation or
inducement to invest in securities or other investments and Motilal Oswal Securities Limited (hereinafter referred as MOSt) is not soliciting any action based upon it. This report is not for public distribution
and has been furnished to you solely for your information and should not be reproduced or redistributed to any other person in any form.
Unauthorized disclosure, use, dissemination or copying (either whole or partial) of this information, is prohibited. The person accessing this information specifically agrees to exempt MOSt or any of its
affiliates or employees from, any and all responsibility/liability arising from such misuse and agrees not to hold MOSt or any of its affiliates or employees responsible for any such misuse and further agrees
to hold MOSt or any of its affiliates or employees free and harmless from all losses, costs, damages, expenses that may be suffered by the person accessing this information due to any errors and delays.
The information contained herein is based on publicly available data or other sources believed to be reliable. While we would endeavour to update the information herein on reasonable basis, MOSt and/or
its affiliates are under no obligation to update the information. Also there may be regulatory, compliance, or other reasons that may prevent MOSt and/or its affiliates from doing so. MOSt or any of its
affiliates or employees shall not be in any way responsible and liable for any loss or damage that may arise to any person from any inadvertent error in the information contained in this report. MOSt or any
of its affiliates or employees do not provide, at any time, any express or implied warranty of any kind, regarding any matter pertaining to this report, including without limitation the implied warranties of
merchantability, fitness for a particular purpose, and non-infringement. The recipients of this report should rely on their own investigations.
Exide Industries
This report is intended for distribution to institutional investors. Recipients who are not institutional investors should seek advice of their independent financial advisor prior to taking any investment decision
based on this report or for any necessary explanation of its contents.
MOSt and/or its affiliates and/or employees may have interests/positions, financial or otherwise in the securities mentioned in this report. To enhance transparency, MOSt has incorporated a Disclosure of
Interest Statement in this document. This should, however, not be treated as endorsement of the views expressed in the report.
Disclosure of Interest Statement
1. Analyst ownership of the stock
2. Group/Directors ownership of the stock
3. Broking relationship with company covered
4. Investment Banking relationship with company covered
EXIDE INDUSTRIES LTD
No
No
No
No
Analyst Certification
The views expressed in this research report accurately reflect the personal views of the analyst(s) about the subject securities or issues, and no part of the compensation of the research analyst(s) was, is,
or will be directly or indirectly related to the specific recommendations and views expressed by research analyst(s) in this report. The research analysts, strategists, or research associates principally
responsible for preparation of MOSt research receive compensation based upon various factors, including quality of research, investor client feedback, stock picking, competitive factors and firm revenues.
This report is not directed or intended for distribution to or use by any person or entity resident in a state, country or any jurisdiction, where such distribution, publication, availability or use would be contrary
to law, regulation or which would subject MOSt & its group companies to registration or licensing requirements within such jurisdictions.
Regional Disclosures (outside India)
This report is intended for distribution only to persons having professional experience in matters relating to investments as described in Article 19 of the Financial Services and Markets Act 2000 (Financial
Promotion) Order 2005 (referred to as "investment professionals"). This document must not be acted on or relied on by persons who are not investment professionals. Any investment or investment activity
to which this document relates is only available to investment professionals and will be engaged in only with such persons.
For U.K.
Motilal Oswal Securities Limited (MOSL) is not a registered broker - dealer under the U.S. Securities Exchange Act of 1934, as amended (the"1934 act") and under applicable state laws in the United
States. In addition MOSL is not a registered investment adviser under the U.S. Investment Advisers Act of 1940, as amended (the "Advisers Act" and together with the 1934 Act, the "Acts), and under
applicable state laws in the United States. Accordingly, in the absence of specific exemption under the Acts, any brokerage and investment services provided by MOSL, including the products and services
described herein are not available to or intended for U.S. persons.
This report is intended for distribution only to "Major Institutional Investors" as defined by Rule 15a-6(b)(4) of the Exchange Act and interpretations thereof by SEC (henceforth referred to as "major
institutional investors"). This document must not be acted on or relied on by persons who are not major institutional investors. Any investment or investment activity to which this document relates is only
available to major institutional investors and will be engaged in only with major institutional investors. In reliance on the exemption from registration provided by Rule 15a-6 of the U.S. Securities Exchange
Act of 1934, as amended (the "Exchange Act") and interpretations thereof by the U.S. Securities and Exchange Commission ("SEC") in order to conduct business with Institutional Investors based in the
U.S., MOSL has entered into a chaperoning agreement with a U.S. registered broker-dealer, Motilal Oswal Securities International Private Limited. ("MOSIPL"). Any business interaction pursuant to this
report will have to be executed within the provisions of this chaperoning agreement.
The Research Analysts contributing to the report may not be registered /qualified as research analyst with FINRA. Such research analyst may not be associated persons of the U.S. registered broker-
dealer, MOSIPL, and therefore, may not be subject to NASD rule 2711 and NYSE Rule 472 restrictions on communication with a subject company, public appearances and trading securities held by a
research analyst account.
For U.S.
Motilal Oswal Capital Markets Singapore Pte Limited is acting as an exempt financial advisor under section 23(1)(f) of the Financial Advisers Act(FAA) read with regulation 17(1)(d) of the Financial
Advisors Regulations and is a subsidiary of Motilal Oswal Securities Limited in India. This research is distributed in Singapore by Motilal Oswal Capital Markets Singapore Pte Limited and it is only directed
in Singapore to accredited investors, as defined in the Financial Advisers Regulations and the Securities and Futures Act (Chapter 289), as amended from time to time.
In respect of any matter arising from or in connection with the research you could contact the following representatives of Motilal Oswal Capital Markets Singapore Pte Limited:
Anosh Koppikar
Kadambari Balachandran
Email : anosh.koppikar@motilaloswal.com
Email : kadambari.balachandran@motilaloswal.com
Contact: (+65) 68189232
Contact: (+65) 68189233 / 65249115
Office address: 21 (Suite 31), 16 Collyer Quay, Singapore 04931
For Singapore
Motilal Oswal Securities Ltd
15 January 2014
Motilal Oswal Tower, Level 9, Sayani Road, Prabhadevi, Mumbai 400 025
Phone: +91 22 3982 5500 E-mail: reports@motilaloswal.com
8