21 January 2014
3QFY14 Results Update | Sector:
Financials
Kotak Mahindra Bank
BSE SENSEX
21,251
Bloomberg
Equity Shares (m)
M.Cap. (INR b) / (USD b)
52-Week Range (INR)
1, 6, 12 Rel. Per (%)
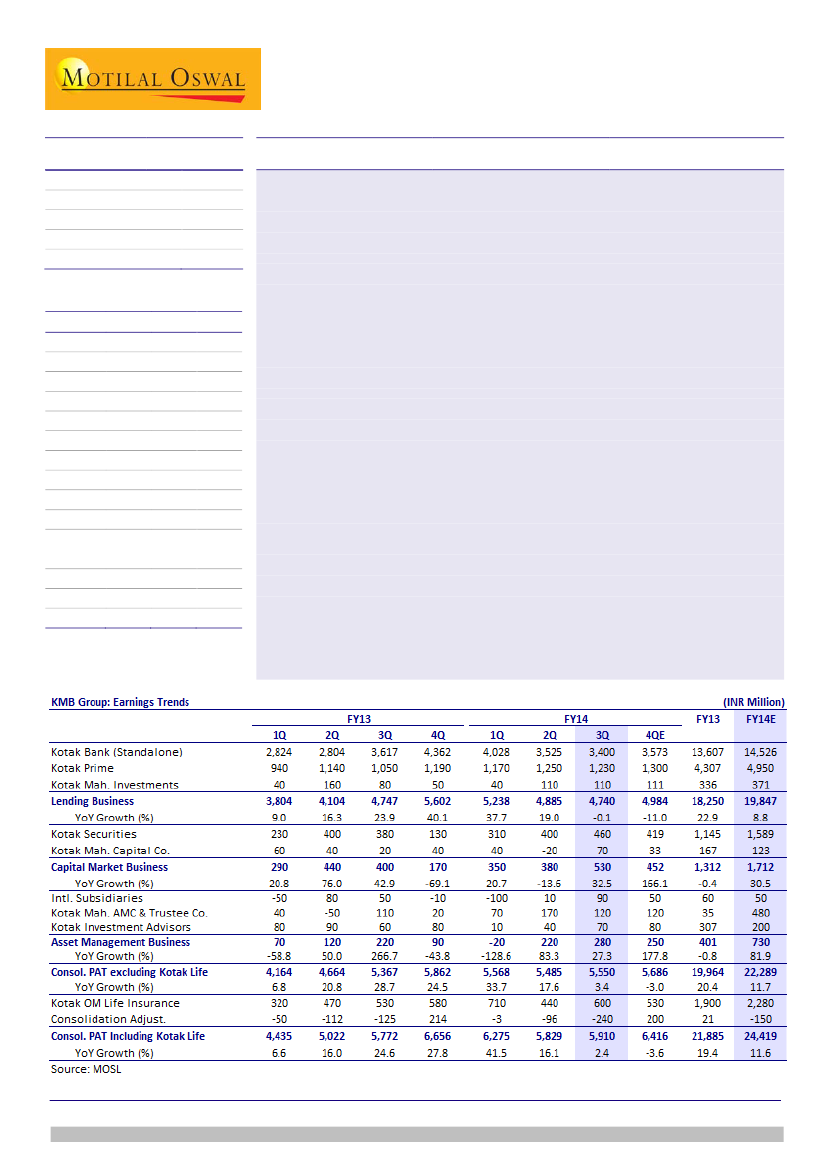
KMB’s consolidated PAT for 3QFY14 grew 2% YoY (lowest since 1QFY10) to INR5.9b
768.7
(4% below our estimate), marred by sharp moderation in loan growth to 6% YoY.
543.0/8.8
Lending business PAT was flat YoY (6% below estimate) at INR4.7b, whereas other
804/588
business PAT grew 23% YoY to INR1.4b v/s our expectation of INR1.1b.
-4/-3/7
S&P CNX
6,314
KMB IN
CMP: INR706
TP: INR720
Neutral
Financials & Valuation (INR Billion)
Y/E MAR
NII
OP
NP
NIM (%)
EPS (INR)
EPS Gr. (%)
Cons. BV.
(INR) RoE
Cons.
( )
RoA (%)
Payout (%)
Valuations
P/E(X)
(C (X)
P/BV )
(C
P/ABV)(X)
( Yield
Div. )
(%)
2014E
37.0
25.7
14.5
4.6
32.7
11.6
236.0
14.9
1.7
2.9
21.6
3.0
3.1
0.1
2015E
41.0
28.2
16.7
4.6
37.1
13.4
272.0
14.6
1.7
2.9
19.0
2.6
2.7
0.1
2016E
47.5
32.4
19.1
4.7
42.3
13.9
313.0
14.4
1.7
2.9
16.7
2.3
2.3
0.1
Standalone business:
Moderate loan growth led to stable NIM (calculated) QoQ at
4.7%. Risk aversion (in some segments) led to loan growth of just 6% YoY (estimate
of 10% YoY) and in-turn impacted NII (3% below estimate) and PAT (6% below
estimate). CV loans continued to decline (drop of 12% QoQ and 26% YoY). Corporate
(+13% QoQ) and agricultural (+14% QoQ) loans were the key drivers of sequential
loan growth.
Other highlights:
(1) KMB’s market share declined 10bp QoQ to 2.3%, (2)
Consolidated NIM was stable QoQ at 4.9%, (3) Consolidated GNPA (including stress
assets) increased to 1.7% (1.6% in 2QFY14), (4) PCR dropped to 46% from 51% in
2QFY14, and if PCR were to be maintained at 2QFY14 levels, standalone PBT would
have been lower by 12-13%, and (5) SA deposit growth was strong at 9% QoQ (38%
YoY) and CASA ratio was stable QoQ at 30%.
Maintain Neutral:
Management comments on the conference call on loan growth
and asset quality were relatively positive (as compared to the previous quarter).
However, considering the growth environment, loan growth will be lower than
historical levels (14% over FY13-16 v/s 31% over FY09-13). Core PPP/earnings CAGR
would be 14%/13% over FY13-16 as compared to 36%+ each over FY09-13. RoA is
likely to moderate to 1.7% over FY14-15 and RoE would be in mid-teens. On the back
of rich valuations, we maintain
Neutral.
Alpesh Mehta
(Alpesh.Mehta@MotilalOswal.com); +91 22 3982 5415
Sohail Halai
(Sohail.Halai@MotilalOswal.com); +91 22 39825430
Investors are advised to refer through disclosures made at the end of the Research Report.

Kotak Mahindra Bank
Earnings Snapshot
Business
Kodak Mahindra Bank (Standalone)
Kodak Mahindra Prime
Kodak Mahindra Investments
Lending Business
Kodak Mahindra Capital Company
Kodak Securities
Capital Market Business
International subsidiaries
Kodak Mahindra AMC & Trustee Co
Kodak Investment Advisors
Asset Management Business
Kodak Life Insurance
Consol. PAT
Consolidation Adjust.
Reported PAT
Banking Business
Auto loans, debt capital markets
Primarily LAS
Investment banking
Broking and distribution
Asset Mgt and IB
Mutual funds management
Alternate asset management
3QFY14
3,400
1,230
110
4,740
70
460
530
90
120
70
280
600
6,150
-237
5,913
2QFY14 QoQ Gr. (%) 3QFY13
3,525
1,250
110
4,885
-20
400
380
10
170
40
220
440
5,925
-96
5,829
-4
-2
0
-3
-450
15
39
800
NA
75
27
36
4
1
YoY Gr. (%)
3,617
-6
1,050
17
80
38
4,747
0
20
250
380
21
400
33
50
80
110
9
60
17
220
27
530
13
5,897
4
-125
5,772
2
Source: MOSL, Company
Lending Business: Moderate growth; stable NIMs; Uptick in NPAs
Flexibility on the opex
partially compensated for
the moderation in earnings
Corporate and Agri banking
were the key drivers of loan
growth during the quarter.
Each grew 13%+ QoQ
KMPL growth also
moderated to 5% YoY led by
slowdown in car sales
Profitability of the lending business
was lower than expectation at INR4.7b (flat
YoY) led by 6% lower than expected standalone banking PAT of INR3.4b (6%
below estimate). For standalone banking entity, NIM (calculated) was stable
QoQ (in-line), however lower than expected loan growth of 6% YoY (estimate of
10% YoY) led to 3% lower than estimated NII of INR9.1b.
Non-interest income (standalone) was 14% lower than expectation at INR3b,
however this was compensated by flexible opex (+13% YoY; 5% below estimate).
Employee expense grew just 5% YoY and led to deviation in opex. KMB made
MTM provisions of INR434m in 3Q and INR1.3b in 9M of the overall requirement
of INR1.95b. Rest (INR650m) is expected to be made in 4QFY14 assuming the
yields remain the same as at end of 3QFY14. However, management on the
conference call clarified that based on the prevailing yield no provisions are
required now for investment book.
Ex-CV loan growth at 12% YoY:
Due to concerns and stress in the CV segment
bank continues to adopt a cautious approach in this segment. As a result CV loan
portfolio declined 11% QoQ and 26% YoY and formed 11.3% of overall loans as
compared to 13.4% in 3QFY14 and 20% at the end of FY12. The incremental loan
growth during the quarter was driven by 13% QoQ (+2% YoY) and 14% QoQ
(+23% YoY) in corporate loan and agriculture segment. Within retail segment,
personal loans grew 2% QoQ and 39% YoY while housing loan growth was at
13% YoY (increased marginally QoQ). Growth in business banking segment
moderated as well to just 5% YoY (declined marginally QoQ).
KMPL PAT
stood at INR1.2b (v/s exp of INR1.3b). KMPL loan growth was flat
QoQ and increased 5% YoY. NNPA % increased to 0.4% as compared to 0.3% a
quarter ago and 0.2% a year ago.
Healthy traction in SA Deposits; CASA ratio stable QoQ:
SA deposits grew 9%
QoQ and 38% YoY. Overall SA as a proportion of overall deposits has now
increased to 16.7% as compared to 15.9% a quarter ago and 12.8% a year ago
and formed 79% of incremental deposits in last one year. CA deposits grew 2%
QoQ (up 6% YoY). Overall CASA (excluding float) grew 6% QoQ and was up 22%
2
21 January 2014

Kotak Mahindra Bank
Healthy traction in SA
growth (up 9% QoQ and
38% YoY)
PCR declined to 46% vs 52%
a quarter ago
and CASA ratio was at 30% as compared to 29.2% in 2QFY14 and 25.9% in
3QFY13. During the quarter bank increased its reliance on CDs (driven by
opportunistic lending opportunity in corporate segment), however on a YoY
basis it is still lower by 46% and formed 10.9% of overall deposits as compared
to 8.6% a quarter ago and peak of 21.5% at end of 3QFY13.
Marginal up-tick in GNPA; PCR declines QoQ:
GNPAs (including. stressed assets)
for the standalone bank increased 7% QoQ, however in percentage terms was
stable QoQ at 2%. PCR (calculated) declined QoQ to 45.7% v/s 51.6% in 2QFY14
and consequently NNPA % increased to 1.1% v/s 1% in 2QFY14. Consolidated
GNPAs (including stressed assets) stood at 1.7% (1.6% in 2QFY14). Net
restructured standard loans stood at INR420m (8bp of overall loans).
Kotak Mahindra Bank (SA) Quarterly Performance (INR M)
Source: MOSL, Company
Trend in lending business profitability - Share of lending declined QoQ to 77%
1QFY12 2QFY12 3QFY12 4QFY12 1QFY13 2QFY13 3QFY13 4QFY13 1QFY14 2QFY14 3QFY14
Total Lending Profits (INR m)
3,490
3,530
3,831
3,999
3,804
4,104
4,747
5,602
5,238
4,885
4,740
YoY Gr. (%)
28
34
35
17
9
16
24
40
38
19
0
QoQ Gr. (%)
2
1
9
4
-5
8
16
18
-6
-7
-3
Share in Consolidated PAT (%)
80
80
83
76
85
80
80
87
83
82
77
Source: Company, MOSL
CV growth drag on overall loan growth (INR m)
KMPL: Loan growth moderates
Auto Loans (INR b)
Other Loans (INR b)
Source: MOSL, Company
3
21 January 2014

Kotak Mahindra Bank
Consolidated NIMs stable QoQ (%)
Asset quality (incl stressed assets)
GNPA (%)
NNPA (%)
Source: MOSL, Company
Other businesses: Profitability improves QoQ
Improved performance of
capital market related
businesses
AUM grew 6% YoY
to INR600b
Capital market
related business PAT was at INR530m (up 33% YoY and 39%
QoQ) driven by healthy growth (partially on account of propriety income) of
21% YoY (+15% QoQ) in securities business and improved profitability (INR70m
v/s INR20m in 3QFY13 and loss of INR20m in 2QFY14) for investment banking. K
Sec market share dropped to 2.3% v/s 2.4% a quarter ago (2.6% in 2QFY13).
Asset management business
reported PAT of INR280m v/s INR220m each in
2QFY14 and 3QFY13. Profitability of international subsidiaries improved to
INR90m v/s INR10m in 2QFY14 and INR50m in 3QFY13, whereas that of KMB
AMC stood at INR120m v/s INR170m a quarter ago and INR110m a year ago.
Overall AUMs reported increased 6% YoY (marginally lower QoQ) to INR599b.
Within which domestic AUM was flat YoY (declined 4% QoQ) at INR330b.
Domestic equity AUMs for 3QFY14 increased 19% QoQ (+6% YoY) to INR36b.
Life insurance business reported PAT of INR600m v/s INR440m in 2QFY14 and
INR530m in 3QFY13. Kotak Life’s gross premium income was flat QoQ at INR6b.
K-Sec market share declined QoQ (%)
K-Sec earnings trend (INR b)
Tot. Inc.
28
19
16
18
17
PAT
26
26
PATM (%) 26
21
27
8
21 January 2014
4

Kotak Mahindra Bank
Investment Banking: Earnings trend (INR m)
Tot. Inc.
18
4
-31
23
26
20
PAT
11
PATM (%)
18
18
-17
39
Asset management: AUM growth improves
Eq. AUM
72
36
15
76
30
15
73
29
10
77
32
14
82
PMS AUM
101
96
99
Offshore AUM
100
97 102
31
10
34
11
34
11
28
11
31
13
30
6
36
6
Trend in segment wise profitability (INR m)
Total lending profits
QoQ Growth (%)
YoY Growth (%)
% Share to total profits
Capital market related business
QoQ Growth (%)
YoY Growth (%)
% Share to total profits
AMC Businesses
QoQ Growth (%)
YoY Growth (%)
% Share to total profits
Kotak Mah. Life Insur.
QoQ Growth (%)
YoY Growth (%)
% Share to total profits
Consolidated PAT
QoQ Growth (%)
YoY Growth (%)
% Share to total profits
Total consolidated PAT ex Life
QoQ Growth (%)
YoY Growth (%)
% Share to total profits
1QFY12 2QFY12 3QFY12 4QFY12 1QFY13 2QFY13
3,490
3,530
3,831
3,999
3,804
4,104
2
1
9
4
-5
8
28
34
35
17
9
16
80
80
83
76
85
80
240
250
280
550
290
440
-64
4
12
96
-47
52
-56
-58
-48
-17
21
76
6
6
6
10
6
9
170
80
60
160
70
120
-31
-53
-25
167
-56
71
-52
-61
-71
-35
-59
50
4
2
1
3
2
2
460
530
470
570
320
470
-35
15
-11
21
-44
47
-766
294
99
-20
-30
-11
11
12
10
11
7
9
4,360
4,390
4,641
5,279
4,484
5,134
-13
1
6
14
-15
14
23
23
21
5
3
17
100
100
100
100
100
100
3,900
3,860
4,171
4,709
4,164
4,664
-10
-1
8
13
-12
12
8
12
16
9
7
21
89
88
90
89
93
91
3QFY13
4,747
16
24
80
400
-9
43
7
220
83
267
4
530
13
13
9
5,897
15
27
100
5,367
15
29
91
4QFY13
5,602
18
40
87
170
-58
-69
3
90
-59
-44
1
580
9
2
9
6,442
9
22
100
5,862
9
24
91
1QFY14 2QFY14 3QFY14
5,238
4,885 4,740
-6
-7
-3
38
19
0
83
82
77
350
380
530
106
9
39
21
-14
33
6
6
9
-20
220
280
-122
N.A.
27
-129
83
27
0
4
5
710
440
600
22
-38
36
122
-6
13
11
7
10
6,278
5,925 6,150
-3
-6
4
40
15
4
100
100
100
5,568
5,485 5,550
-5
-1
1
34
18
3
89
93
90
Source: MOSL, Company
21 January 2014
5

Kotak Mahindra Bank
Conference Call highlights
Macro perspective: GDP growth of 5%
Interest Rates will be the key and that will be dependent on the US yields, which
have surprisingly been below 3%. If the rates remain benign in US, then can
expect gradual reduction in interest rates in India as well.
Energy prices expected to remain stable and CAD issue is behind
Expect a GDP growth of 5% in FY15
Loans: Growth in CV/CE segment bottomed out; 15% loan growth guidance
over next 12-15 months
The current growth in corporate loan book is not a like 3Q/4QFY13 and is of
medium to long term maturity.
Disbursement in CV/segment has slowed down considerably. However,
management believes that growth in CV/CE segment is near bottom and its drag
on overall loan growth is now behind. Mix of CV/ CE segment has changed from
heavy commercial vehicles to light commercial vehicles.
Infrastructure there is no dramatic change and environment remains
challenging.
Excluding one account that slipped during the quarter bank does not expect
significant stress addition in business banking segment.
Focus to be on increasing share of low cost deposits
Bank has raised INR12b of FCNR deposits under RBI swap scheme. Overall NRE
deposits continue to show good traction and forms 23-24% of overall retail term
deposits. Bank has not provided any leveraged finance for raising FCNR deposits.
Less than INR500m deposits is now at 64%+ v/s 55% a year ago. Sub INR100m
deposits have increased by 31% YoY. Focus of the management is on building its
balance sheet on stable and low cost deposits.
Asset quality – Worst is behind
The increase in GNPA during the quarter is led by mid-corporate segment (one
account). Bank has strong collateral cover of 2x of loans.
PCR drop is on account of strong collaterals in place and is not compromising on
balance-sheet strength.
Most of the pain on existing CV and CE is already taken. On incremental NPA,
KMB believes it has bottomed out in CV and CE segment. Management
comments “Bank is moving from recognition to resolution (i.e. recovery)”.
Other highlights
KMB took a hit of INR434m during the quarter (INR1.3b) out of the total MTM
requirement of INR2b. As on date bank is marginally positive on its investment
book if yields remains at current level.
K-sec profits have partially been driven by better proprietary trading and market
share gains in cash business where yields are better.
21 January 2014
6

Kotak Mahindra Bank
Valuation and view
Management guided for loan growth of ~15% and is more confident of growth
bottoming-out as compared to in 2QFY14. Rural and semi-urban areas continue
to be its key focus areas to drive growth. To leverage on its geographical
expansion, the management is focusing on product penetration, with higher
emphasis on Agriculture business (will help in priority sector loans), small
business loans (untapped opportunity; creating niche for itself) and mortgage
loan. In the near term, CV growth is likely to be muted, considering the
challenges faced by the sector. We factor loan CAGR of 14% over FY13/16 and
core PPP growth is expected to be in-line with loan growth.
While there has been some rise in delinquency, asset quality for the bank has
been holding up well. With (1) management expectation of worst in CV/CE
segment behind, (2) other retail products showing better than factored in loss
given default (LGD) and (3) lower share of term/project loans in the corporate
segment, we expect asset quality performance of KMB to be better than peers
in coming quarters.
With improvement in volumes and tight control over costs, we expect the
performance of the Capital Market business to improve. Overall, we expect KMB
to report consolidated EPS of INR33/37/42 in FY14/15/16, and consolidated BV
of INR236/272/313 in FY14/15/16. KMB's standalone RoA is likely to decline
from 1.9% in FY12 to ~1.7% over FY14/15/16. Higher capitalization (tier-I ratio of
17%+) will keep RoE subdued at ~14/13%/13 over FY14/15/16. On a
consolidated basis too, KMB is likely to report RoE of 15%/14 over FY14/15/16.
The stock trades at 2.6x FY15E consolidated BV, and 19x FY15E consolidated
EPS. On the back of rich valuations, we maintain Neutral, with an SOTP-based
(FY15E) target price of INR720.
Standalone: Lower earnings estimates to factor lower than expected loan growth
INR b
Old Est.
Revised Est.
Change (%)
FY14
FY15
FY14
FY15
FY14
FY15
Net Interest Income
37.4
43.7
37.0
41.0
-1.2
-6.1
Other Income
15.1
17.8
14.0
16.1
-7.3
-9.7
Total Income
52.6
61.5
51.0
57.1
-3.0
-7.2
Operating Expenses
26.1
31.2
25.3
28.9
-3.1
-7.4
Operating Profits
26.5
30.3
25.7
28.2
-2.9
-6.9
Provisions
4.0
3.9
3.7
3.1
-7.1
-22.4
PBT
22.5
26.4
22.0
25.1
-2.1
-4.6
Tax
7.6
9.0
7.5
8.4
-2.1
-6.0
Standalone PAT
14.8
17.4
14.5
16.7
-2.1
-3.9
Consolidated PAT
24.6
28.2
24.4
27.7
-0.9
-1.9
Loans
557
669
545
627
-2.2
-6.3
Deposits
602
723
582
669
-3.4
-7.4
Margins (%)
4.5
4.6
4.6
4.6
SA RoA (%)
1.7
1.7
1.7
1.7
Core RoE (%)
14.2
13.8
14.0
13.3
Source :Company, MOSL
21 January 2014
7

Kotak Mahindra Bank
Better profitability of KMPL, K Sec and AMC keeps overall PAT estimate largely unchanged
INR b
Kotak Mahindra Bank (Standalone)
Kotak Mahindra Prime
Kotak Mahindra Investments
Lending Business
International subsidiaries
Kotak Mahindra AMC & Trustee Co
Kotak Investment Advisors
Asset Management Business
Kotak Securities
Kotak Mahindra Capital Company
Capital Market Business
Consol. PAT excluding Kotak Life
Kotak OM Life Insurance
Consolidation Adjust.
Consol. PAT Including Kotak Life
Old Est.
FY14
FY15
14.8
17.4
5.1
5.7
0.4
0.4
20.4
23.5
0.0
0.0
0.6
0.6
0.2
0.3
0.8
0.9
1.4
1.6
0.1
0.1
1.5
1.8
22.7
26.1
2.1
2.3
-0.2
-0.2
24.6
28.2
Revised Est.
Change (%)
FY14
FY15
FY14
FY15
14.5
16.7
-2.1
-3.9
5.0
5.5
-3.6
-2.6
0.4
0.4
19.8
22.6
-2.6
-3.6
0.1
0.1
0.5
0.6
0.2
0.3
0.7
1.0
-8.8
5.5
1.6
1.7
0.1
0.1
1.7
1.8
12.3
4.1
22.3
25.4
-1.8
-2.8
2.3
2.5
-0.2
-0.2
24.4
27.7
-0.9
-1.9
Source: MOSL, Company
Kotak Mahindra: SOTP Valuation (FY15-based)
Value
(INR B)
484.8
399.9
81.1
3.8
28.9
15.5
8.0
5.4
22.7
20.6
2.1
15.5
551.9
540.7
2.1
Value (USD INR per
B)
share
7.9
632
6.5
522
1.3
106
0.1
5
0.5
38
0.3
20
0.1
7
0.1
10
0.4
30
0.3
27
0.0
3
0.3
20
9.0
720
8.8
706
2.1
% To Total Rationale
88
72
3x FY15E Core NW, ~1.7% RoA and ~13% Core RoE
15
2.5x FY15E Net Worth, ~19% Core RoE
1
1x FY15E Net Worth
5
3
4% of FY15E Avg. AUM of INR386b
1
12% of FY15E AUM of INR67b
1
5% of FY15E AUM of ~USD1.8b
4
4
12x FY15E Earnings; Implied 0.9x Core BV
0
1x FY15E Free Networth
3
15x FY15E NBAP, APE CAGR of ~15% in FY12-15
100
Implied 2.65x PBV and 19x PE FY15; ROE of ~15%
Lending Business
Kotak Mahindra Bank
Kotak Prime (Car and other loans)
Kotak Investment Company (LAS)
Asset Management Business
Domestic Mutual Fund
Alternative Assets
Offshore Funds
Capital Markets related Business
Kotak Securities
Kotak Investment Banking (KMCC)
Kotak Life Insurance
Target Value
Current value / market price
Upside (%)
Source: MOSL, Company
KMB Group: Earnings Estimates (INR m)
Kotak Mahindra Bank (Standalone)
Kotak Mahindra Prime
Kotak Mahindra Investments
Lending Business
International subsidiaries
Kotak Mahindra AMC & Trustee Co
Kotak Investment Advisors
Asset Management Business
Kotak Securities
Kotak Mahindra Capital Company
Capital Market Business
Consol. PAT excluding Kotak Life
YoY Growth (%)
Kotak OM Life Insurance
Consolidation Adjust.
Consol. PAT Including Kotak Life
YoY Growth (%)
Business
Banking Business
Auto loans, debt capital markets
Primarily LAS
Asset management and inv. banking
Mutual funds management
Alternate asset management
Broking and distribution
Investment banking
FY10
5,611
1,664
347
7,622
799
725
398
1,921
2,601
239
2,840
12,382
89
692
-4
13,070
100
FY11
8,182
3,179
240
11,600
509
173
327
1,009
1,819
519
2,338
14,948
21
1,014
-294
15,667
20
FY12
10,851
3,849
153
14,852
-110
154
361
405
1,258
59
1,318
16,574
11
2,030
-282
18,322
17
FY13
13,607
4,307
336
18,250
60
35
307
401
1,145
167
1,312
19,964
20
1,900
21
21,885
19
FY14E
14,526
4,950
371
19,847
50
480
200
730
1,589
123
1,712
22,289
12
2,280
-150
24,419
12
FY15E
16,721
5,510
366
22,597
75
638
250
963
1,718
114
1,832
25,393
14
2,508
-200
27,701
13
FY16E
19,122
6,337
403
25,862
100
702
300
1,102
1,890
131
2,021
28,986
14
2,759
-200
31,544
14
Life insurance
21 January 2014
8

Kotak Mahindra Bank
Kotak Group Earnings Snapshot (% of total)
Kotak Mahindra Bank (Standalone)
Kotak Mahindra Prime
Kotak Mahindra Investments
Lending Business
International subsidiaries
Kotak Mahindra AMC & Trustee Co
Kotak Investment Advisors
Asset Management Business
Kotak Securities
Kotak Mahindra Capital Company
Capital Market Business
Consol. PAT excluding Kotak Life
Kotak OM Life Insurance
Consol. PAT Including Kotak Life
Business
Banking Business
Auto loans, debt capital markets
Primarily LAS
Asset management and inv. banking
Mutual funds management
Alternate asset management
Broking and distribution
Investment banking
FY10
43
13
3
58
6
6
3
15
20
2
22
95
5
100
FY11
52
20
2
74
3
1
2
6
12
3
15
95
6
100
FY12
59
21
1
81
-1
1
2
2
7
0
7
90
11
100
FY13 FY14E FY15E FY16E
62
59
60
61
20
2
83
0
0
1
2
5
1
6
91
9
100
20
20
20
2
1
1
81
82
82
0
0
0
2
2
2
1
1
1
3
3
3
7
6
6
1
0
0
7
7
6
91
92
92
9
9
9
100
100
100
Source: MOSL, Company
Life insurance
21 January 2014
9

Kotak Mahindra Bank
EPS: MOSL forecast v/s consensus (INR)
MOSL
Forecast
FY14
FY15
32.7
37.1
Consensus
Forecast
33.1
39.7
Variation
(%)
-1.2
-6.6
Stock performance (1-year)
Shareholding pattern (%)
Dec-13
Promoter
Domestic Inst
Foreign
Others
43.7
1.7
39.7
15.0
Sep-13
43.8
2.3
39.1
14.9
Dec-12
45.1
3.6
36.1
15.2
21 January 2014
10

Kotak Mahindra Bank
Financials and valuation
21 January 2014
11

Disclosures
This report is for personal information of the authorized recipient and does not construe to be any investment, legal or taxation advice to you. This research report does not constitute an offer, invitation or
inducement to invest in securities or other investments and Motilal Oswal Securities Limited (hereinafter referred as MOSt) is not soliciting any action based upon it. This report is not for public distribution
and has been furnished to you solely for your information and should not be reproduced or redistributed to any other person in any form.
Unauthorized disclosure, use, dissemination or copying (either whole or partial) of this information, is prohibited. The person accessing this information specifically agrees to exempt MOSt or any of its
affiliates or employees from, any and all responsibility/liability arising from such misuse and agrees not to hold MOSt or any of its affiliates or employees responsible for any such misuse and further agrees
to hold MOSt or any of its affiliates or employees free and harmless from all losses, costs, damages, expenses that may be suffered by the person accessing this information due to any errors and delays.
The information contained herein is based on publicly available data or other sources believed to be reliable. While we would endeavour to update the information herein on reasonable basis, MOSt and/or
its affiliates are under no obligation to update the information. Also there may be regulatory, compliance, or other reasons that may prevent MOSt and/or its affiliates from doing so. MOSt or any of its
affiliates or employees shall not be in any way responsible and liable for any loss or damage that may arise to any person from any inadvertent error in the information contained in this report. MOSt or any
of its affiliates or employees do not provide, at any time, any express or implied warranty of any kind, regarding any matter pertaining to this report, including without limitation the implied warranties of
merchantability, fitness for a particular purpose, and non-infringement. The recipients of this report should rely on their own investigations.
This report is intended for distribution to institutional investors. Recipients who are not institutional investors should seek advice of their independent financial advisor prior to taking any investment decision
based on this report or for any necessary explanation of its contents.
MOSt and/or its affiliates and/or employees may have interests/positions, financial or otherwise in the securities mentioned in this report. To enhance transparency, MOSt has incorporated a Disclosure of
Interest Statement in this document. This should, however, not be treated as endorsement of the views expressed in the report.
Disclosure of Interest Statement
1. Analyst ownership of the stock
2. Group/Directors ownership of the stock
3. Broking relationship with company covered
4. Investment Banking relationship with company covered
Kotak Mahindra Bank
No
No
No
No
Kotak Mahindra Bank
The views expressed in this research report accurately reflect the personal views of the analyst(s) about the subject securities or issues, and no part of the compensation of the research analyst(s) was, is,
or will be directly or indirectly related to the specific recommendations and views expressed by research analyst(s) in this report. The research analysts, strategists, or research associates principally
responsible for preparation of MOSt research receive compensation based upon various factors, including quality of research, investor client feedback, stock picking, competitive factors and firm revenues.
Analyst Certification
This report is not directed or intended for distribution to or use by any person or entity resident in a state, country or any jurisdiction, where such distribution, publication, availability or use would be contrary
to law, regulation or which would subject MOSt & its group companies to registration or licensing requirements within such jurisdictions.
Regional Disclosures (outside India)
This report is intended for distribution only to persons having professional experience in matters relating to investments as described in Article 19 of the Financial Services and Markets Act 2000 (Financial
Promotion) Order 2005 (referred to as "investment professionals"). This document must not be acted on or relied on by persons who are not investment professionals. Any investment or investment activity
to which this document relates is only available to investment professionals and will be engaged in only with such persons.
For U.K.
Motilal Oswal Securities Limited (MOSL) is not a registered broker - dealer under the U.S. Securities Exchange Act of 1934, as amended (the"1934 act") and under applicable state laws in the United
States. In addition MOSL is not a registered investment adviser under the U.S. Investment Advisers Act of 1940, as amended (the "Advisers Act" and together with the 1934 Act, the "Acts), and under
applicable state laws in the United States. Accordingly, in the absence of specific exemption under the Acts, any brokerage and investment services provided by MOSL, including the products and services
described herein are not available to or intended for U.S. persons.
This report is intended for distribution only to "Major Institutional Investors" as defined by Rule 15a-6(b)(4) of the Exchange Act and interpretations thereof by SEC (henceforth referred to as "major
institutional investors"). This document must not be acted on or relied on by persons who are not major institutional investors. Any investment or investment activity to which this document relates is only
available to major institutional investors and will be engaged in only with major institutional investors. In reliance on the exemption from registration provided by Rule 15a-6 of the U.S. Securities Exchange
Act of 1934, as amended (the "Exchange Act") and interpretations thereof by the U.S. Securities and Exchange Commission ("SEC") in order to conduct business with Institutional Investors based in the
U.S., MOSL has entered into a chaperoning agreement with a U.S. registered broker-dealer, Motilal Oswal Securities International Private Limited. ("MOSIPL"). Any business interaction pursuant to this
report will have to be executed within the provisions of this chaperoning agreement.
The Research Analysts contributing to the report may not be registered /qualified as research analyst with FINRA. Such research analyst may not be associated persons of the U.S. registered broker-
dealer, MOSIPL, and therefore, may not be subject to NASD rule 2711 and NYSE Rule 472 restrictions on communication with a subject company, public appearances and trading securities held by a
research analyst account.
For U.S.
Motilal Oswal Capital Markets Singapore Pte Limited is acting as an exempt financial advisor under section 23(1)(f) of the Financial Advisers Act(FAA) read with regulation 17(1)(d) of the Financial
Advisors Regulations and is a subsidiary of Motilal Oswal Securities Limited in India. This research is distributed in Singapore by Motilal Oswal Capital Markets Singapore Pte Limited and it is only directed
in Singapore to accredited investors, as defined in the Financial Advisers Regulations and the Securities and Futures Act (Chapter 289), as amended from time to time.
In respect of any matter arising from or in connection with the research you could contact the following representatives of Motilal Oswal Capital Markets Singapore Pte Limited:
Anosh Koppikar
Kadambari Balachandran
Email : anosh.koppikar@motilaloswal.com
Email : kadambari.balachandran@motilaloswal.com
Contact: (+65) 68189232
Contact: (+65) 68189233 / 65249115
Office address: 21 (Suite 31), 16 Collyer Quay, Singapore 04931
For Singapore
Motilal Oswal Securities Ltd
21 January 2014
Motilal Oswal Tower, Level 9, Sayani Road, Prabhadevi, Mumbai 400 025
Phone: +91 22 3982 5500 E-mail: reports@motilaloswal.com
12