WEEK IN A NUTSHELL
WIN-dow to the week that was
Week in a Nutshell (WIN)
Week
ended
th
7 Feb 2014
Key WIN-dicators
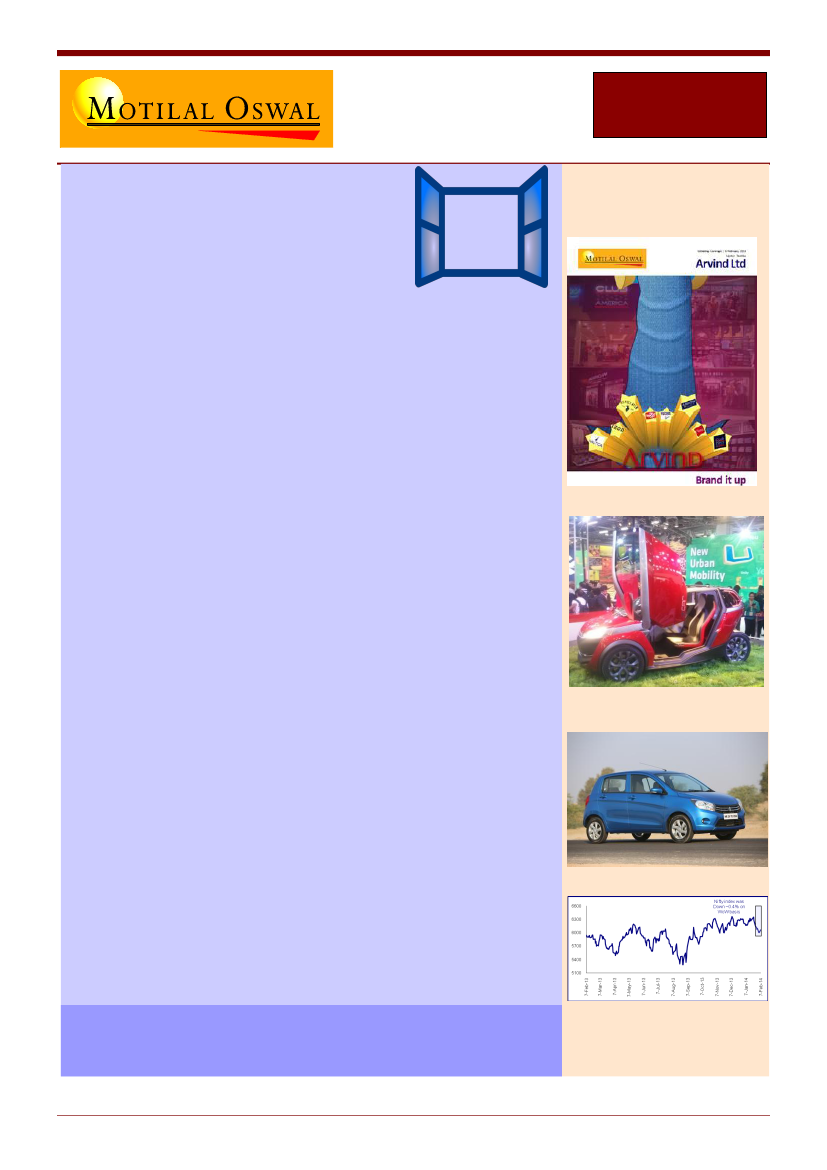
Arvind Ltd: Initiating Coverage
Fears of the spreading emerging market crisis impacted India in the first
half of this week and FII net inflows turned negative for CY14 YTD.
However a recovery in sentiment after some positive data from the US
and reassuring commentary from the ECB and BoE helped global markets.
Expectations of positive election outcome and seasonal inflows lead to
DIIs buying and a flattish close for the benchmark indices (-0.4% WoW)
Telecom Auctions:
The auctions that started this week have clearly
surprised everyone. While bidding has been aggressive in the 1800 MHZ v/s
expectations, it’s the bidding in 900 MHZ band that is of more immediate
concern. Taking into account the current prices for 1800MHz and 900MHz
for the three metros, there could be significant upside to the spectrum
renewal liability for
Bharti INR43 to 63/sh and for Idea INR42 to 69/sh and
the bidding is still on!
While the results season is panning out on expected lines;
the highlight of
this week’s results includes PNB, BOB & Divis.
Both PNB and BOB surprised
positively on NIM’s and asset quality and their guidance for better
performance on asset quality comes as a welcome relief. Divis reported an
all-round strong performance.
Auto Expo 2014: Highlights
This was the biggest expo ever in India, with
~69 new launches (47 in
2012), of which 26 were global launches
(incl concepts).
Maruti’s Celerio
launch and pricing for automatic at INR429k was the talking point. New
launches in the small sedan segment that created excitement were
Hyundai’s Xcent
and
Fords Figo Concept.
While MM had no new products,
very few MPVs (Honda and Datsun) give some breathing space for MM's
product lifecycle.
TTMT:
We were positively surprised by quality of new
launches of small sedan Zest and small car Bolt. While
HMCL
made
statement of intent with 9 new products (5 scooters, incl 2 indigenously
developed engines) and 3 concepts (diesel, hydrogen and 650cc sports
bike).
BJAUT:
Launched 375cc Pulsar, which looked stunning and also
showcased the U-Car concept.
Some of the highlights of this edition:
3QFY14 Result Notes:
Lupin, Ambuja, PNB, Hero, BoB
Arvind Mills:
Initiating Coverage
Bajaj Auto Concept: U Car Concept
Maruti Suzuki: Celerio: India First Auto
Gear Shift Car
Nifty (-0.4%) WoW
WWW – WIN Weekend Wisdom
There’s a big difference between seeing an opportunity and seizing an
opportunity
Feb 7
th
2014
WIN – Week In a Nutshell
1

WEEK IN A NUTSHELL
WEEK IN A NUTSHELL
[W]INside this week’s edition
WIN-TERESTING DATA POINTS ...................................................................................................................................................4
WIN-NING CHARTS & CHATS ......................................................................................................................................................5
W
INNING
C
HARTS
- R
EVENUE AND
P
ROFITS
E
ARNED IN
1 M
INUTE
...............................................................................................................5
WIN-CONOMICS.........................................................................................................................................................................6
INDIA ECONOMICS: G
REEN GROCERS STILL REMAIN FRIENDS BUT
D
R
. R
AJAN HAS MOVED ON
.......................................................................6
INDIA ECONOMICS: S
HARP REVISION IN
FY11-FY13 GDP
GROWTH
;
SAVING RATE BELOW
L
EHMAN LOWS
,
INVESTMENTS HELD UP BY PUBLIC
SECTOR
.............................................................................................................................................................................................6
SECTOR UPDATES .......................................................................................................................................................................7
AUTO DASHBOARD: J
ANUARY
2014
UPDATE
......................................................................................................................................7
CEMENT: A
TTEMPTS TO BOOST PRICE CONTINUE
; INR10-20/
BAG
M
O
M
HIKE EXCEPT SOUTH
;
DISCIPLINE IMPROVED IN NORTH
,
WEST
...................7
ENERGY: CNG/PNG
SEGMENTS TO GET
100% (
V
/
S
80%
NOW
)
DOMESTIC GAS ALLOCATION
;
EXPECT
CNG
PRICES TO LOWER ON NET BASIS DESPITE
SCHEDULED DOUBLING OF GAS PRICE IN
A
PRIL
1, 2014;
RESPITE FOR
IGL
AS VOLUME GROWTH COULD PICKUP
.....................................................8
INDIA POLITICS: T
HIRD FRONT EMERGES AGAIN TO IMPROVE POST POLL VISIBILITY
;
PAST FAILINGS AND DECLINING STRENGTH EVOKES SKEPTICISM
....8
REAL ESTATE: D
ATA AIDS POSITIVE SURPRISE IN
4QCY13
PRESALES GROWTH
;
LOW BASE EFFECT
,
SELECT ATTRACTIVE LAUNCH KEY REASONS
;
PRICE
FLATTENING
.......................................................................................................................................................................................8
TELECOM: S
PECTRUM AUCTION
D
AY
4 – 900
BAND PRICE UP
11%
IN
D
ELHI
;
CONTINUED ACTION IN
1800
BAND
; MTM
SPECTRUM LIABILITY UP
45-
65%
FOR
B
HARTI
/I
DEA
........................................................................................................................................................................9
WIN CORPORATE CORNER .......................................................................................................................................................10
ACC 4QCY13: EBITDA
BEAT OF
5%
ON LOWER COST PUSH IN ENERGY AND
RM;
TAX REVERSAL BOOSTS
PAT;
RAISE
EPS
BY
4-5%. M
AINTAIN
B
UY
.....................................................................................................................................................................................................10
AMBUJA CEMENT 4QCY13: EBITDA
BEATS EST ON LOWER ENERGY AND EMPLOYEE COST
;
RAISING
CY14/15 EPS
BY
~4%;
KEEPING
U
NDER
REVIEW
...........................................................................................................................................................................................10
A
RVIND
L
TD
: I
NITIATING COVERAGE
; 46%
UPSIDE
...................................................................................................................................10
ASHOK LEYLAND: A
BOVE EST AT
7,847
UNITS
(
EST
7,500
UNITS
); MHCV
S DECLINE
20%; LCV
DECLINES SHARPLY BY
37% Y
O
Y......................11
BAJAJ AUTO: M
ARGINALLY AHEAD OF EST
;
VOLUME DECLINES
8.5% Y
O
Y
AT
318,171
UNITS
; 3W
S CONTINUE TO REMAIN WEAK
.......................11
BANK OF BARODA (BOB) 3QFY14: A
BOVE EST
; NIM
IMPROVES
Q
O
Q;
NET STRESS ADDITION DECLINES
;
HEALTHY CAPITALIZATION
. B
UY
..........11
BHEL 3QFY14: A
BOVE EST
;
SLOW MOVING ORDERS AT
20%+;
POSSIBLE PROJECT WINS AT
~INR150
B IN
4Q;
DEBTORS DOWN
4% Q
O
Q.............12
C
ANARA
B
ANK
3QFY14: W
EAK CORE PERF
.; S
TRESS ADDITION REMAINS HIGH
;
STRONG LOAN GROWTH A CONCERN
; T
RADES AT
0.4
X
FY15BV ......12
COGNIZANT 4QCY13: R
EVENUE MARGINALLY BELOW CONSENSUS
; CY14
ORGANIC GROWTH GUIDANCE OF AT LEAST
16.1%
IMPLIES LIMITED
LIKELIHOOD OF GROWTH ACCELERATION
................................................................................................................................................12
CUMMINS INDIA 3QFY14: O
PERATING PERF ABOVE ESTIMATES
;
IMPROVED COST EFFICIENCIES SUPPORT MARGINS
;
MAINTAIN
B
UY
..................13
DIVI'S LABS 3QFY14: A
NOTHER STRONG QUARTER
; A
LL ROUND GROWTH
; R
OBUST GUIDANCE FOR
FY15E; U
PGRADE ESTIMATE BY
5-6% ..........13
EICHER MOTORS: I
N
-
LINE
; CV
SALES DROPS
31% Y
O
Y;
MOMENTUM IN
R
OYAL
E
NFIELD CONTINUES WITH
~77%
GROWTH
..............................14
G
RASIM
I
NDUSTRIES
3QFY14: B
ELOW EST ON COST PUSH
,
DESPITE STRONG VOLUMES AND HIGHER REALIZATIONS
; M
AINTAIN
B
UY
.......................14
GSPL 3QFY14: S
IGNIFICANTLY BELOW ESTIMATES LED BY LOWER VOLUME AND TARIFF
;
HEADWINDS FOR INCREMENTAL GAS CONTINUE
; N
EUTRAL
..14
GODREJ CONSUMER (GCPL) 3QFY14: B
ELOW ESTIMATES
; H
OME
I
NSECTICIDES GROWTH IN SINGLE AT MULTI QUARTER LOW
; N
EUTRAL
..........15
HERO MOTOCORP: A
BOVE EST AT
561,253
UNITS
(
EST OF
530,000
UNITS
);
MGMT GUIDES MULTIPLE NEW LAUNCHES IN PHASED MANNER
......15
HMSI: S
TRONG SCOOTER GROWTH CONTINUES TO DRIVE OVERALL SALES
....................................................................................................15
IDFC 3QFY14: PAT
ABOVE EST
.; G
ROWTH MODERATE FURTHER
; NPL
S SPIKE UP
; L
OWER
P
ROVISIONS DRIVE
PAT
BEAT
....................................15
ING VYSYA BANK 3QFY14: NIM
IMPACTED BY ONE
-
OFFS
; R
ESTRUCTURING RISES
; NPL
STABLE
; T
RADES AT
1.4
X
FY15BV .............................16
JAIPRAKASH POWER 3QFY14: B
ELOW ESTIMATE
;
LOWER CONTRIBUTION FROM
B
INA
/K
ARCHAM
W
ANGTOO
;
CUT EARNINGS
/TP;
DE
-
LEVERAGING
IS KEY
..............................................................................................................................................................................................16
JAYPEE INFRATECH 3QFY14: R
EVENUE BEATS EST
; EBITDA
PLUNGES ON LOWER MARGIN
;
OPERATIONS WEAK
,
ALBEIT UP
Q
O
Q .....................16
LUPIN 3QFY14: A
BOVE EST
; I
NDIA
, J
APAN RECOVER
,
MOMENTUM IN
US
GENERICS CONTINUES
;
EXPECT STRONG QUARTERS AHEAD
;
UPGRADE
EPS
BY
1-3% .........................................................................................................................................................................................17
MARUTI SUZUKI: I
N
-
LINE AT
102,416 (
EST
104,500
UNITS
),
DECLINE OF
10.3%
DRIVEN BY
48%
DROP IN EXPORTS
, C
ELERIO DISPATCHES STARTED
(
EST
5
K UNITS
) .................................................................................................................................................................................17
MARUTI SUZUKI: M
GMT MEET
- MSIL’
S CORE EARNINGS
/FCF
UNAFFECTED
; PAT/
RETURN RATIOS TO IMPROVE
; S
URPLUS FUNDS TO USE TO
STRENGTHEN MARKETING
/R&D ..........................................................................................................................................................18
M&M: I
N
-
LINE AT
62,794 (
EST
61,499
UNITS
); A
UTOS DECLINE
14% Y
O
Y;
TRACTOR GREW
15% Y
O
Y ..........................................................18
NMDC: J
ANUARY DELIVERIES UP
9% M
O
M; K
ARNATAKA
E-
AUCTION BID VOLUMES UP
57% M
O
M;
LUMPS PRICES UP
2%,
FINES PRICES DOWN
12%
ND
YET
2
HIGHEST
. M
AINTAIN
B
UY
.........................................................................................................................................................19
WIN – Week In a Nutshell
2
Feb 7
th
2014

WEEK IN A NUTSHELL
WEEK IN A NUTSHELL
O
BEROI
R
EALTY
3QFY14: O
PERATIONAL WEAKNESS CONTINUES
,
BUT POSSIBLY NEARING INFLECTION
,
WITH
W
ORLI
, M
ULUND
, JVLR
LAUNCH ON
6-
MONTH RADAR
. M
AINTAIN
B
UY
...........................................................................................................................................................19
PETRONET LNG 3QFY14: B
ELOW EST
.
LED BY LOWER
D
AHEJ THROUGHPUT
; K
OCHI RAMP
-
UP SLOW
;
TO SAVE
INR6
B ON
D
AHEJ EXPANSION
;
V
ALUATIONS REASONABLE
..................................................................................................................................................................19
PNB 3QFY14: I
NLINE
; A
SSET QUALITY IMPROVEMENT A POSITIVE SURPRISE
; S
TRONG
NIM
S DUE TO DE
-
BULKING
;
GROWTH TO IMPROVE
; B
UY
.......20
POWER FINANCE 3QFY14: A
BOVE EST
; H
EALTHY LOAN GROWTH
; S
TABLE ASSET QUALITY
; I
NTERIM DIV OF
INR8.8/
SH
; R
AISE EST
.
BY
~7%.......20
POWEGRID 3QFY14: B
ELOW ESTIMATE LED BY LOWER CORE BUSINESS CONTRIBUTION
, STOA;
CAPEX MOMENTUM REMAINS STRONG BUT
CAPITALIZATION GROWTH IS THE KEY
.....................................................................................................................................................20
PRESTIGE ESTATES PROJECTS 3QFY14: EBITDA
BEATS EST
;
OPERATIONS MARGINALLY MODERATED
Q
O
Q,
BUT ON TRACK TO MEET
/
BEAT
GUIDANCE
;
EFFECTIVE DEBT UP
INR1
B
Q
O
Q ..........................................................................................................................................21
RANBAXY 4QFY14: O
PERATIONAL PERF
.
ABOVE EST
;
GUIDES FOR LOWER IMPACT FROM
T
AONSA BAN BUT HIGHER REMEDIATION COSTS AHEAD
;
RAISE CORE
EPS
BY
2-4% ...................................................................................................................................................................21
S
OBHA
D
EVELOPERS
3QFY14: A
BOVE EST
;
PRESALES
,
COLLECTIONS WEAKENED
Q
O
Q; FY14
GUIDANCE LOWERED
,
BUT HINTS
4QFY14
OPERATIONS
TO RETURN TO NORMALCY
. M
AINTAIN
B
UY
............................................................................................................................................22
TATA MOTORS: B
ELOW EST AT
40,481
UNITS
(
EST
44,400
UNITS
);
PRESSURES ACROSS PORTFOLIO
; LCV
SALES DECLINE
45% Y
O
Y ...................22
TATA POWER: A
GREEMENT TO SALE STAKE IN
A
RUTMIN MINE COULD BE POSITIVE FOR LEVERAGE
,
CASHFLOWS
,
EARNINGS
,
VALUATION IMPACT
MINIMAL
; A
WAIT CLARITY
...................................................................................................................................................................23
TVS MOTOR: A
BOVE EST
; S
TRONG
55% Y
O
Y
GROWTH IN EXPORTS
;
SCOOTERS GREW
19% Y
O
Y; M
OPEDS RECOVERS WITH
29% M
O
M
GROWTH
23
U
NION
B
ANK
3QFY14: L
OWER CAPITALIZATION REMAINS A CONCERN
; S
TRESS ADDITION REMAINS HIGH
; T
RADES AT
0.4
X
FY15BV .....................23
WHIRLPOOL INDIA 3QFY14: F
IRST SIGNS OF RECOVERY
,
ALBEIT ON FAVORABLE BASE
...............................................................................24
WIN COLLAGE ..........................................................................................................................................................................25
A
DITYA
P
URI ON
H
OW
I
NDIA CAN BE THE OUTLIER AS GROWTH IN DEVELOPED ECONOMIES ASCEND AND OF
BRICS
DESCEND
................................25
NIFTY VALUATIONS AT A GLANCE ............................................................................................................................................27
WIN – Week In a Nutshell
3
Feb 7
th
2014

WEEK IN A NUTSHELL
WEEK IN A NUTSHELL
WIN-teresting data points
Global Indices
Sensex
Nikkei
Hang Seng
Dow Jones
FTSE 100
Sectoral Indices
Bank Nifty
CNX IT
BSE Oil
Bond yields-
India
1 Year
10 Year
10238
9957
8453
Last
Friday
8.52
8.78
10263
9648
8328
0.25
-3.10
-1
13.91
15.01
10.55
Last week
20514
14915
22035
15699
6510
Current
week
20377
14462
21637
15629
6570
WoW change (%)
-0.67
-3.03
-1.81
-0.45
0.91
P/E Valuations
16.26
25.39
11.61
13.22
15.24
Inflows
FII (Rs B)
DII (Rs B)
Commodities
Oil(US$/Bbl)
Precious Metals
Gold ($/OZ)
Silver ($/OZ)
Metals
Copper(US$/MT)
Zinc(US$/MT)
Aluminum(US$/MT)
This week WoW change (%)
8.46
8.74
-1
-1
Spread Vs US 10
yrs
Steel HRC(Rs/T)
8.34
6.03
Currency
Rs Vs Dollar
Euro Vs Dollar
62.66
1.35
62.29
1.36
-0.59
0.59
7096
1964
1663
7178
2012.5
1671.5
1.2%
2.5%
0.5%
1245
19
1263
20
1.47
3.78
MTD
-10
28
Last
week
107.2
YTD
(Calendar)
-12
14
This week WoW change (%)
106.9
-0.28
Top Gainers
Company Name
Monsanto India
Godfrey Phillips
Kaveri Seeds
Aban Offshore
Voltas
Balkrishna Industries
BSE 500 – Key Movers
Top Losers
% Change Company Name
23%
21%
19%
16%
12%
10%
BHEL
Oberoi Realty
Opto Circuits
Sintex
Eclerx
Shriram Transport
% Change
-10%
-10%
-10%
-8%
-8%
-6%
WIN – Week In a Nutshell
4
Feb 7
th
2014

WEEK IN A NUTSHELL
WEEK IN A NUTSHELL
WIN-ning charts & chats
Winning Charts - Revenue and Profits Earned in 1 Minute
Amazon is a retailing juggernaut, but its revenues are still a fraction of those of Walmart, whose tills ring up about
$900,000 a minute. The bricks-and-mortar colossus turns in a modest profit margin, whereas Amazon is still being
run on a basis of growth now, profits later. Comparing the revenues and net profits of companies commonly
regarded as peers shows their relative commercial power.
Google is often chided for its dominance, though Apple is far larger (and their profit margins are similar). Coca-
Cola’s sales are less than PepsiCo’s but its margins are almost twice those of its arch-rival. In energy and aerospace,
the sales of American and European giants are roughly similar yet the Americans earn more. And Goldman Sachs
has long been the media’s whipping boy, but JPMorgan Chase is bigger in net revenue and net profit—though not
profit margins.
WIN – Week In a Nutshell
5
Feb 7
th
2014

WEEK IN A NUTSHELL
WEEK IN A NUTSHELL
Win-conomics
INDIA ECONOMICS: Green grocers still remain friends but Dr. Rajan has moved on
RBI has decisively won the bet in proving Nov-13 inflation data as a ‘noise’. Sharp drop in vegetables prices led
the significant moderation in both CPI and WPI in Dec-13.
Collating the price trend on major vegetables for the month of Jan-14 so far, we find that vegetable prices
continue to drop MoM taking them lower than their levels a year back in many cases.
This would likely to result in WPI falling to 5.7% levels during Jan-14 and CPI to 9.1% in Jan-14.
Further moderation of food prices is expected with Rabi sowing exceeding previous year by 5.3% with
particularly increased acreage for cereals. Lower hike in MSP also to aid in moderation in inflation.
In normal course, this should have triggered a rate cut expectations in the coming months.
However, as evidenced in the latest round of rate hike in Jan-14, RBI is amidst inflation targeting already
incorporating all its critical components in its policy decisions, including, i) far greater emphasis on inflation
control than growth, ii) adoption of CPI as a nominal anchor, iii) setting a lower tolerance limit through the glide
path by which inflation would come down to 8% by Jan-15, and to 6% by Jan-16, iv) insistence on positive real
policy rate.
While we hold that CPI inflation would come down to 8% sooner than RBI expects, it has guided for a stable
policy course, indicating high interest rates for a longer period. External considerations too might have
influenced a hardened policy stance from RBI. Thus, while inflation is falling down rapidly, RBI has hardened its
stance in the interim.
INDIA ECONOMICS: Sharp revision in FY11-FY13 GDP growth; saving rate below Lehman lows,
investments held up by public sector
Significant revision has been effected in GDP growth estimate of FY11 to FY13. However, the direction of change
lacks consistency.
While FY11 growth has been downgraded to 8.9% in sharp contrast to their previous upgrade in earlier revision,
FY12 GDP growth has been upgraded to 6.7%, again in sharp contrast to the downgrade seen in previous
estimate. FY13 GDP growth has been revised downwards to 4.5% from 5% earlier
Saving rate continued to fall and at 30.1% was lower than the Lehman low of 32%. A sharp decline in household
physical saving coupled with decline in private corporate saving accounted for this while public sector saving
were held up on PSUs’ profit.
The investment ratio declined further to 34.8%, although it was somewhat higher than the Lehman low of
34.3%. The decline was mainly attributed to decline n household and private corporate investment while the
public sector stepped up its investment in construction activities.
While we expect the saving rate to improve somewhat during FY14, investment ratio is likely to go down further
as import of valuables have corrected sharply, before recovering again in FY15.
The sharp correction in FY13 GDP growth would lend a marginal upside bias to our FY14 GDP growth estimate of
4.5%. CSO would release the advance estimate of FY14 GDP on February 7, 2014.
Significant revision in GDP growth estimates (YoY%)
Saving ratio lower than crisis year while investments higher(% of GDP)
WIN – Week In a Nutshell
6
Feb 7
th
2014

WEEK IN A NUTSHELL
WEEK IN A NUTSHELL
Sector Updates
AUTO DASHBOARD: January 2014 update
Growth continues in two-wheelers and tractors, other segments sees sharp decline
Underlying demand remains weak; however two-wheelers and tractors posted healthy growth
Considering the slowdown in economic activity and consequent weakness in consumer and business
sentiments, demand continues to remain weak across auto segments. MHCVs and cars have been the worst
impacted.
However, tractor volumes continue to remain strong on favorable monsoon and high farm income. Two-
wheeler sales have also picked-up driven by rural demand and strong growth in scooters.
Easing of macro headwinds to be key catalyst for demand recovery
With expected increase in rural incomes due to favorable monsoon, coupled with election spending led
improvement in macro-economic environment, we expect better 4Q for the auto sector. Over the long term,
easing macro headwinds in terms of lower interest rates and higher economic growth would be the key driver
for volume growth, profitability and in turn re-rating.
Demand environment and changing competitive landscape in the auto sector would be the key determinants of
stock performance. Prefer Hero MotoCorp and Tata Motors in large caps and TVS Motor and Eicher Motors in
mid-caps.
CEMENT: Attempts to boost price continue; INR10-20/bag MoM hike except south; discipline improved
in north, west
We concluded our periodic interactions with cement dealers across regions to get ground reality on recent
pricing trend and demand.
Key takeaways:
• Efforts to increase price continues
• Attempts to provide upward thrust to cement prices by manufacturers continued in the month of January-14,
despite volume growth showing no encouraging sign yet. Overall, the prices were taken up by INR10-20/bag
(over December-end level) across most regions except south – which witnessed a INR10-15/bag of decline (AP
saw a decline of INR20/bag).
• Increase was most in select states like Rajasthan, Gujarat and Chhattisgarh. In some instances, actual selling are
happening lower than the billing prices (as highlighted by dealers of Pune, Chandigarh, Indore etc).
• Another round of price increase is expected over next 1 week. Dealers are viewing this multiple price increases
by the companies as an effort to protect downside in an environment of muted demand – which has been a
phenomenon in recent months.
Region-wise weighted average January-14 price (INR/bag) trends
Region
MoM
YoY
National average
+INR 5/bag (+2%)
–INR 9/bag (-3%)
North
+INR 9/bag (+4%)
–INR 17/bag (-7%)
West
+INR 13/bag (+5%)
–INR 4/bag (-1%)
East
+INR 11/bag (+4%)
–INR 6/bag (-2%)
South
- INR 10/bag (-4%)
–INR 17/bag (-10%)
Central
+INR 9/bag (+4%)
–INR 17/bag (+7%)
We are assuming INR10-12/bag QoQ increase in cement pricing in 4QFY14 for our MOSL universe. Uptick in
demand would be the most crucial factor to sustain price hike (prevent any repeated roll back) and critical for
operating and stock performance. In large-caps, we prefer ACC and Shree Cement; whereas in mid-caps we
prefer Birla Corp, Dalmia, and JK Lakshmi.
WIN – Week In a Nutshell
7
Feb 7
th
2014

WEEK IN A NUTSHELL
WEEK IN A NUTSHELL
ENERGY: CNG/PNG segments to get 100% (v/s 80% now) domestic gas allocation; expect CNG prices to
lower on net basis despite scheduled doubling of gas price in April 1, 2014; respite for IGL as volume
growth could pickup
Ministry of Petroleum and Natural Gas has announced that CNG and PNG network’s natural gas requirement
will be met 100% (v/s 80% now) through domestic gas (could be a blend on APM and PMT).
This will eliminate high cost LNG purchase for CNG/PNG and is expected to result in price cut of INR15/kg (30%
reduction) in CNG and INR5/scm in PNG in Delhi.
Gas will be made available through pro-rata cut in non-priority industries, which include Petrochemicals,
Refineries and Steel and any further requirement, will be met through additional cuts.
100% allocation of domestic gas to CNG/PNG will reduce selling price to the consumer and is likely to result in
the higher volume growth as CNG becomes more attractive v/s alternate fuels. Increased PNG customer base
will also help in lowering LPG subsidy. Gas volume cut is likely to impact Gail India and RIL who currently
consume APM and PMT gas for petrochemical production.
However, benefit of increase in domestic gas allocation to 100% will be partly negated by the scheduled
domestic gas price hike from April 1, 2014 as per Rangarajan Committee formula.
Nevertheless, on a net-net basis the CNG price will be lower than the current level (INR50/kg in Delhi) across
the country (except Mumbai where it already gets 100% APM).
From company-level perspective, we expect volume growth to increase for IGL. IGL’s (IGL IN, Mkt Cap USD0.6b,
CMP INR269, TP INR306, 14% upside, Neutral) volume growth has averaged lower at 6% in the last 4 quarters
with ~4% in CNG (75% of total volumes) and 12% in PNG v/s FY08-12 average of ~20%.
We would watchout for the final mix of the domestic gas allocation (APM and PMT) and implementation of the
gas price hike in April 1, 2014 before reviewing our volume growth estimates for IGL. We currently model
volume growth of 5%/7%/7% for FY14/15/16 in our estimates.
INDIA POLITICS: Third front emerges again to improve post poll visibility; past failings and declining
strength evokes skepticism
Leaders of 11 non-Congress and non-BJP parties announced the formation of a block (termed as Third Front by
media) to pitch for pro-people, anti-communal and federal agenda.
The Front initiated by the Left parties made a joint appearance in the Parliament indicating an understanding to
work together on key issues.
However, only the Left parties (CPI and CPI-M) have gone for a pre-poll seat sharing arrangement with the
AIADMK in Tamil Nadu. Indeed, regional isolation of these parties makes pre-poll arrangement meaningful with
only the Left.
While most of these parties have non-overlapping electoral presence, they shied away from a pre-poll alliance.
This implies that the move is a first time attempt to improve visibility for the quick formation of a post-poll
alliance to provide a non-congress-non-BJP axis.
However, the seat and vote share of these parties had taken a major knock in the 2009 Lok Sabha elections
(Refer Exhibit 1 below).
As expected, while the leaders of the Third Front have tried to put up a united face, they came under severe
criticism from the BJP while Congress was more guarded in its observations (Refer Exhibit 4 below).
One silver lining has been that the Governments by Third Fronts too have carried out the legacy of reform.
Illustratively, the United Front Government between 1996-98 initiated various path breaking reforms including
Central Electricity Regulatory Commission, phased de-regulation of petroleum prices, Disinvestment
Commission and Banking Sector Reforms.
REAL ESTATE: Data aids positive surprise in 4QCY13 presales growth; low base effect, select attractive
launch key reasons; price flattening
We analyzed the quarterly real estate data points from various property consultants (Liases Foras, JLL, DTZ)
available in public domain. Presenting our takeaways and views:
There were very weak new launches in festive season of 4QCY13 unlike past years. To end the year, Bangalore
was the lone market to have higher launch in CY13 than CY12.
8
Feb 7
th
2014
WIN – Week In a Nutshell

WEEK IN A NUTSHELL
WEEK IN A NUTSHELL
As per Liases Foras data, Pan India presales were strong in 4QCY13 (+14% YoY/+22% QoQ in volume and +46%
YoY/+32% QoQ in value). CY13 presales volume down by 5-10%, value up 8% YoY.
Regional presales value in 4QCY13/CY13 is as follows: MMR (+70%/+16%), NCR (+27%/+1%), Bangalore
(+77%/+8%), Pune (+0%/-11%) and Chennai (+80%/+48%). Hence, it is evident that growth was led by MMR
(due to extremely low base), Bangalore and Chennai.
Unsold inventory level improved marginally QoQ across markets, albeit MMR, NCR still at concerning level.
Bangalore, Chennai, Pune and Thane are better placed.
Flattening (QoQ) price trends suggest peaking out of property prices in most markets. Channel checks suggest
10-15% off-the-book discount in many markets (Island City Mumbai, Dwarka expressway and new Gurgaon
projects at NCR etc).
Commercial annual demand de-grew by 3.5% YoY in CY13 after a flattish 4QCY13. New supply moderated
(almost halved in MMR), and thus improving vacancy level.
TELECOM: Spectrum auction Day 4 – 900 band price up 11% in Delhi; continued action in 1800 band;
MTM spectrum liability up 45-65% for Bharti/Idea
Seven rounds were completed in the 1,800MHz and 900MHz spectrum auction on Day 4, taking total rounds to
twenty-eight. Aggregate value of spectrum ‘bid for’ (303 MHz across 2 bands and 22 circles) at the provisional
winning price post twenty-eight rounds was INR389b as compared to Day 3 value of INR439b (for 308 MHz bid
on Day 3).
In the 1,800MHz band, aggregate demand on Day 4 was 281MHz vs 275MHz on Day 3. Pricing increased in
double-digits vs Day 3 in Assam (34%), Maharashtra (16%), and UP west (11%). Excess demand was positive in
Assam, J&K, MP, UP east and UP west.
In the 900MHz band, aggregate demand on Day 4 reduced to 22MHz vs 33MHz on Day 3 with excess demand at
negative levels for all the three metros. While the price as well as excess demand remained unchanged for
Kolkata and Mumbai implying no incremental bidding, price for Delhi increased by 11% but excess demand
declined from 5 on Day 3 to -6 on Day 4.
Increased pricing for 900MHz band spectrum has a significant bearing on the renewal liability of Bharti and Idea
as the bulk of renewal liability pertains to 900MHz spectrum.
With the premium for 900MHz increasing from 1.6-1.7x at reserve price to 2.6-2.8x at current bid prices, there
is a possibility that renewal for 900MHz spectrum in circles other than the three metros might also happen
closer to ~3x premium vs the 1,800 band.
Taking into account the Day 4’ 1800MHz prices for pan-India, Day 4 900MHz prices for the three metros, and
multiplier of 3x for 900MHz spectrum in the circles other than the three metros, there could be significant
upside to the spectrum renewal liability for Bharti/Idea as compared to the earlier estimates benchmarked to
reserve price.
On a mark-to-market basis, the licence renewal and excess spectrum liability for Bharti upto CY16 increases
from INR173b (INR43/sh) to INR250b (INR63/sh).
On a mark-to-market basis, the licence renewal and excess spectrum liability for Idea upto CY16 increases from
INR139b (NR42/sh) to INR230b (INR69/sh).
The actual spectrum liability can change depending on 1) Bids towards data spectrum, and 2) Quantity of
900MHz renewed by the operator.
WIN – Week In a Nutshell
9
Feb 7
th
2014

WEEK IN A NUTSHELL
WEEK IN A NUTSHELL
WIN Corporate Corner
ACC 4QCY13: EBITDA beat of 5% on lower cost push in energy and RM; tax reversal boosts PAT; raise
EPS by 4-5%. Maintain Buy
ACC’s 4QCY13 cement business net sales (ex RMC) grew by 1.8%YoY (+7.4% QoQ) to INR25.2b (in line with est of
INR25.3b), while overall sales were marginally below est at INR26.9b, down 13% YoY (v/s est of INR27.7b), due
to weaker RMC business. RMC revenue grew by 7% QoQ to INR1.7b (below est of INR2.4b).
Cement volumes de-grew 1.5% YoY (+6% QoQ) to 5.85mt (v/s est of 5.97mt), while grey cement realization was
up 1.7% QoQ (3.4% YoY) to ~INR4,307/ton (in line with est of INR4,244/ton).
EBITDA was marginally above est at ~INR2.6b (v/s est of INR2.5b), which translates into margin of 9.8% (v/s est
of 9% and +0.8pp QoQ). EBITDA/ton stood at INR449 v/s est of ~INR417 (up INR42/ton QoQ and down
INR85/ton YoY), driven by lower energy and raw material cost (down INR92/ton QoQ), albeit partially offset by
higher freight cost and other expense.
Further, tax reversal of INR759m resulted into a negative tax of INR360m, which boosted reported PAT at
INR2.78b (est of INR1.6b).
ACC declared final dividend of INR19/share, taking total dividend for CY13 to INR30/share (same as CY12) –
implying 62% Payout on adj. PAT and dividend yield of ~3%.
We are revising our EPS for CY14/CY15 upward by 4%/5% to INR66.8/88.1 respectively. This translates into
target price of INR1,240 (at ~USD100/ton or implied EV/EBITDA 7x CY15E EV/EBITDA) including synergy
benefits.
We are yet to formally incorporate benefits of synergies. However, based on our initial estimates, stock trades
at 10.5x CY15E EPS, and at an EV of 5.6x CY15E EBITDA and USD71/ton. Maintain Buy with a target price of
INR1,240 (at ~USD100/ton or ~7x CY15E EV/EBITDA).
AMBUJA CEMENT 4QCY13: EBITDA beats est on lower energy and employee cost; raising CY14/15 EPS
by ~4%; keeping Under review
Ambuja Cements’ (ACEM)’s 4QCY13 net sales de-grew by -5.3% YoY (+9%QoQ) to INR21.9b (in line with est of
INR22.1b). This was driven by in line volume 5.29mt (v/s est 5.36mt), down 1.8% YoY (+8% QoQ), and
realizations of INR4,142/ton (v/s est of INR4,131/ton), up 0.9% QoQ.
EBITDA de-grew 33% YoY (+13% QoQ) to ~INR2.9b (v/s est ~IN2.5b), translating into EBITDA margin of 13.2%
(+0.5pp QoQ). EBITDA/ton stood at ~INR546 (v/s est ~INR462), up INR24/ton QoQ (-INR249/ton YoY). Better
profitability was attributable to lower energy cost (which benefitted by further increase in pet coke usage in
kiln) and savings in employee cost.
Reported PAT stood at INR3.2b (v/s est of INR1.6b), boosted by tax credit of INR1b. Adj. PAT de-grew 2.8% YoY
to INR2.2b. It declared final dividend of INR2.4/share, taking total dividend for CY13 to INR3.6/share (same as
CY12).
We are upgrading EPS for CY14/CY15 by 4.2%/4% to INR8.4/10.6 respectively, to factor in for (a) lower energy
cost (4% YoY inflation v/s earlier estimates of 5% in CY14/15), (b) lower employee cost, while (c) maintained
CY14/15 volume growth assumption at 5%/8%, and realizations growth of INR12.5/bag YoY each in CY14/15.
While we are yet to factor in resultant synergies in our estimates, based on our preliminary estimates, the stock
trades at an EV of 6.8x CY15E EBITDA and USD91/ton (on fully diluted equity and on pro-rata consolidation,
including synergies). Recent fall in stock price results in potential upside. However, we seek more clarity on
near-term triggers in the context of current challenging environment. We place the rating Under Review from
earlier rating of Neutral
Arvind Ltd: Initiating coverage; 46% upside
Brands and retail segment margins to see structural improvement from 5.4% in FY13 to 12% by FY16E, driven by
consolidation of portfolio, more power brands, turnaround of loss-making new brands and improved margins in
Megamart.
Restructuring in garments segment led to turnaround and improvement in margins from -8% in FY10 to 11% in
FY13. Plans to expand capacity from 10m pieces to 25m by FY15 to drive profitable growth.
Wovens to be the largest segment for Arvind Ltd (ARVND) in FY16 and overtake denims in sales and profitability.
10
Feb 7
th
2014
WIN – Week In a Nutshell

WEEK IN A NUTSHELL
WEEK IN A NUTSHELL
Focus on higher value-added products in denim (70% of denim revenue) will ensure better realizations and
margins in an over-supplied market scenario.
We value ARVND at 6x FY16E EV/EBITDA, in line with five-year historical average multiple of 6.4x one-year
forward EV/EBITDA. Initiate coverage with a 'Buy'.
ASHOK LEYLAND: Above est at 7,847 units (est 7,500 units); MHCVs decline 20%; LCV declines sharply by
37% YoY
Ashok Leyland reported decline of 26% YoY (+25% MoM) in Jan-14 sales volumes to 7,847 units (est 7,500
units).
Reflecting the continued weakness in economic environment and consequent pressure on freight traffic, MHCVs
declined by 20% YoY, +42% MoM) to 5,530 units (est 4,200 units). We have built-in 30% decline in MHCV
volumes for FY14, implying a residual de-growth of 46% and residual run-rate of 4,492 units.
LCV (Dost & Stile) have declined by 37% YoY to 2,317 units (est 3,300 units).
The stock trades at 33.3x FY16E EPS and 8.4x EV/EBITDA and 0.9x P/BV. Maintain Neutral.
BAJAJ AUTO: Marginally ahead of est; volume declines 8.5% YoY at 318,171 units; 3Ws continue to
remain weak
Bajaj Auto Jan-14 total sales were marginally ahead of expectations with 8.5% decline at 318,171 units (est
312,000 units).
Our estimate of 8.4% decline in FY14, implies residual de-growth of 0.5% or residual run-rate of 315,093 units.
Motorcycle volumes stood at 281,390 units, declining by 6.6% YoY (+8% MoM) vs our expectation of 275,000.
Drop in volumes could be attributed to continued shift towards scooters, higher competitive pressures in the
motorcycle segment coupled with weak consumer sentiments within the domestic segment.
Weakness in 3W volumes continues with 20.5% YoY decline (-1% MoM) at 36,781 units led by sharp slowdown
in domestic 3Ws. Our de-growth estimate of 7% implies residual de-growth of 4.5% or monthly run-rate of
~35,948 units.
Exports have grown by 7% YoY to 137,644 units (-9% MoM) against our expectation of 140,000 units.
The stock trades at 16.9x/14.2x/12x FY14E/FY15E/FY16E EPS of INR112.9/133.7/158.5 respectively. Maintain
Buy.
BANK OF BARODA (BOB) 3QFY14: Above est; NIM improves QoQ; net stress addition declines; healthy
capitalization. Buy
BOB’s 3QFY14 PAT was 7% above estimate at INR10.5b (+4% YoY). NII/PPP was in-line with estimate at INR30.6b
(8% YoY) and INR21.8b (down 3% YoY). However, PBT was 18% above estimate led by: a) MTM write-back of
INR1.2b (v/s expectation of INR300m of MTM loss) and b) strong asset quality performance. Higher tax rate
(26% v/s expectation of 19%) on account of creation of DTL of INR2.7b on special reserve contained PAT growth.
Net slippages declined QoQ to INR10.6b (net slippage ratio of 1.4%), lowest in last five quarters (average of
INR16.4b). Write-offs were negligible in 3QFY14, hence GNPA increased 10%. PCR (cal) improved QoQ to 44.5%
(up 250bp) and NNPA % was stable at 1.9%.
In 3QFY14, bank restructured fresh loans of INR12.1b (v/s INR16.4b in 2QFY14). However, led by
repayment/adjustments, OSRL was flat QoQ at INR212b (6% of loans).
Other highlights: (1) Domestic and global NIM improved by 10bp / 5bp QoQ to 3% / 2.4%, (2) BoB directly
debited networth by INR8.2b (2.3% of networth, INR19/share), (3) Bank raised USD1.9b of FCNR (B) deposits.
Guidance for 4QFY14: a) Loan growth above industry growth rates, b) Domestic NIMs of 3%, c) ROA to reach
~1% and (d) Slippages and fresh restructuring to come down in coming quarters.
Improving trend on asset quality, strong CET1 of ~9.5%, relatively better return ratios and lower stress loans v/s
peers increases our confidence on fundamentals of BoB. NIMs and asset quality could surprise positively if
growth engine resumes. Nevertheless, we model credit cost of 0.9%/1% over FY14/16.
We model 10bp improvement in NIM in FY15 and to be stable thereafter.
RoA’s and RoE is expected to be 0.7/0.6% over FY15/16. We expect bank to report EPS of INR105/INR106 and
INR113 in FY14/15/16 and BV is expected to be INR768/INR850 and INR936. The stock currently trades at
0.7/0.6x FY14/15/16E BV.
WIN – Week In a Nutshell
11
Feb 7
th
2014

WEEK IN A NUTSHELL
WEEK IN A NUTSHELL
BHEL 3QFY14: Above est; slow moving orders at 20%+; possible project wins at ~INR150b in 4Q; debtors
down 4% QoQ
BHEL’s 3QFY14 performance was above estimates with revenues at INR84.6b (down 16% YoY, in-line) and
EBIDTA margins at 11.7% (down 462bp YoY, vs est of 10.6%). PAT at INR6.9b (down 41% YoY) was higher than
estimates of INR5.2b (down 56%) and is supported by INR800m of forex gains on receivables (included in other
income).
Revenues were impacted given slow moving orders from private sector (at ~20%+ of the order book), and also
delayed execution due to lack of regulatory clearances, local issues, delays in payment / LCs, etc. Importantly,
margins have bounced back to a more normative level of 11.7% in 3QFY14 (vs 1HFY14 levels of 6.5%), given
limited incremental provisions in 3Q pertaining to bad and doubtful debts / liquidated damages, etc. Margins
have been impacted given poor fixed cost absorption with staff costs at 17.7% (up 360bp) and SGA expenses at
14.4% (up 58bp), while RM costs as % of revenues stood at 56.5% (up 40bp).
Order backlog at the end of 3QFY14 declined to INR1t, down 12% YoY & 2% QoQ. Power sector order book was
at INR834b, stable QoQ while Industry sector witnessed 11% YoY decline to INR101b. Gross order inflow was
INR72b (power sector INR63b, Industry INR13b). Management stated that BHEL is favourably positioned in
~4.5GW of projects to be awarded by March 14, which includes 1.98GW NTPC North Karanpura, 1.6GW NTPC
Darlipalli (Boilers), 6X196MW Pranhita Lift Irrigation, 1.32GW e-BOP of NTPC Raghunathpur, etc. In addition, the
company is submitting bids for another 7GW of projects (including Ennore 1.6GW, Udangudi 1.32GW, Tanda TG
1.32GW, etc). We model order inflow of INR147b for BHEL in 4QFY14, entailing INR263b in FY14.
Working capital situation continues to be stretched and debtors at the end of 3QFY14 stood at INR394b (down
4% QoQ). Management stated that collections are an important focus, with 9mFY14 collections at 109% of the
net billings and at 95% of revenues. We believe that improved trend in terms of debtors collections will be an
important monitorable and a key stock price trigger. Debtors outstanding for more than 12 months continues to
be ~50% of the outstanding amount.
We maintain Buy with a Price Target of INR210/sh (14x FY16E). We expect BHEL to report EPS of INR14.4/sh
(down 46%) in FY14, INR9.6/sh (down 32.9%) in FY15 and INR15.0/sh (up 56%) in FY16. At CMP of INR160, BHEL
trades at PER of 12.1x / 18.0x / 11.6x its FY14E / FY15E / FY16E.
Canara Bank 3QFY14: Weak core perf.; Stress addition remains high; strong loan growth a concern;
Trades at 0.4x FY15BV
Canara Bank’s 3QFY14 PAT of INR4.1b (down 42% YoY) was 20% above estimate. However, core performance
was weak with (1) NIMs remaining at a low of 2.2% (~5bp drop QoQ), (2) fee income growth of 12% YoY (7%
below expectation) despite strong loan growth of 32% YoY and (3) higher stress addition.
Lower opex (6% below expectation) and MTM provisions of INR1.6b v/s expectation of INR3.6b led to PAT beat.
Unamortized MTM is of INR2.6b.
Stress levels continue to be high with net slippages of INR10.4b (net slippage ratio of 1.9% v/s INR6.3b in
2QFY14) and fresh restructuring of INR34.5b (1.2% of loans). OSRL stood at INR184.5b (6.4% of loans). Pipeline
of restructuring is of INR33b of which INR16.2b pertains to SEBs.
CBK directly debited INR11.9b (5% of net worth; INR26 per share) for creation of DTL on special reserves which
pertained to earlier years (in-line with recent RBI notification).
Other highlights: (a) Of the overall FITL requirement of INR5.3b bank charged INR1.3b to P&L with rest to be
amortized over next three quarters, (b) bank recognized revaluation reserve of INR35.7b during the quarter.
COGNIZANT 4QCY13: Revenue marginally below consensus; CY14 organic growth guidance of at least
16.1% implies limited likelihood of growth acceleration
Revenue marginally below consensus: CTSH’s 4QCY13 revenues grew 2.2% QoQ to USD2,355m, ahead of its
implied guidance of USD2,352m. The consensus estimate of revenues was USD2,359m, +2.3% QoQ (TCS grew
3% QoQ) and our estimate was USD2,362m, +2.5% QoQ growth. EBITDA margin during the quarter was 21%,
+20bp QoQ. GAAP EPS for the quarter was USD1.06, v/s guidance of USD1.04 and consensus of USD1.05.
16% organic revenue growth in CY14: CTSH gave CY14 revenue growth guidance of ‘at least’ 16.5%, and
excluding the impact of Equinox acquisition, organic growth guidance is 16.1%. Revenue guidance for 1QCY14 is
USD2,420m (2.7% QoQ) – implies 2Q-4QCY14 CQGR of 4.2%.
12
Feb 7
th
2014
WIN – Week In a Nutshell

WEEK IN A NUTSHELL
WEEK IN A NUTSHELL
Reading the guidance from Indian peers’ perspective: CTSH’s guidance implies unlikely acceleration in the
company’s CY14 growth, contrary to our revenue acceleration expectation for its Indian peers. We currently
model 17.7% USD revenue growth for TCS in FY15 (v/s 16.5% in FY14E), and CTSH’s outlook suggests little
upside to that number. Also, we expect USD revenue growth of 13.7% at INFO, and guidance of ~11% in the
background of that expectation and CTSH’s guidance may not be perceived very negatively.
North America budgets modestly up, discretionary spending to continue: North American IT budgets are up
modestly compared to last year, which is better than flattish budgets in the past couple of years. In 2013,
discretionary spending picked up in the middle of the year (which drove guidance upgrade), and CTSH expects
that to continue.
CUMMINS INDIA 3QFY14: Operating perf above estimates; improved cost efficiencies support margins;
maintain Buy
KKC’s 3QFY14 operating performance was above estimates: Revenues at INR10.2b (down 6% YoY) vs estimates
of INR9.8b (down 10.2%), while EBITDA at INR2.0b (down 5% YoY) is 17.5% above estimates.
EBIDTA margins stood at 19.3% (down 16bp) and are significantly above estimates of 17.2%. PAT stood at
INR1.5b (down 19% YoY) and is above est of INR1.4b.
The key highlight has been the sharp decline in RM costs to 60% of revenues in 3QFY14 (down 270bp YoY). On
QoQ basis, RM costs are stable at 60% which is encouraging, and is despite pig iron prices increasing by 7.4%
from lows in 1QFY14.
The expansion in gross margins since last 2 quarters is largely attributable to currency benefits on exports (KKC
is an important beneficiary of the currency movement, as it retains 50% of the gains beyond 3% and last reset
was in Dec 2012). This has also offset the impact of poor operating leverage - staff costs stood at 8.5% of
revenues (up 82bp YoY) and other expenses at 12.1% (up 170bp YoY).
Cummins Inc had altered the currency reset on annual basis, vs the previous practice of reset every third year;
and thus the currency will be reset in 4QFY14, impacting margins in 4QFY14. Also, currently pig iron prices are
up 7.4% from lows in 1QFY14 and should impact RM costs 4QFY14 onwards.
Hence, we model EBIDTA margins of 17.1% in 4QFY14 (vs 19.3% in 3QFY14). CPCB II norms implementation
have been postponed to June 2014 now, and thus the pre-buying is likely to commence from ~March 2014.
We currently model EPS of INR21.9/sh in FY14 (down 8% YoY), INR24.9/sh in FY15 (up 13% YoY) and INR29.5/sh
in FY16 (up 18.8% YoY). At CMP of INR402/sh, KKC quotes at PER of 18.4x FY14 / 16.2x FY15E.
Maintain Buy; key triggers are: i) incremental success in LHP segment (both domestic and exports), which
contributed ~INR4b to revenues in FY13 and internal targets are ~INR15-20b over the next 3-5 years, ii) possible
demand recovery in US and Europe (which would drive HHP exports), and iii) pick-up in the reconditioning and
refurbishment business with implementation of CPCB-II (facilities have been recently established in Phaltan).
We expect contribution of LHP products and Recon to increase from 8% of revenues in FY13 to 23% in FY16, and
thus these segments are important growth levers.
DIVI'S LABS 3QFY14: Another strong quarter; All round growth; Robust guidance for FY15E; Upgrade
estimate by 5-6%
Divi’s Labs 3QFY14 results were above estimates. Revenues grew 29% YoY to INR6.9b (v/s est. INR6.3b), while
EBITDA grew 58% YoY to INR2.8b (v/s est. INR2.4b). PAT grew 52% YoY to INR2.2b (v/s est. INR1.8b). There was
a forex loss of INR53m (included in other expenses).
Revenue growth was led by healthy performance in both CRAMS and API. Capacity utilization at DSN SEZ has
increased and the unit booked INR1.3b of sales in 3QFY14 (INR3.5b in 9MFY14).
EBITDA margin expanded 760bp YoY to 41.6% v/s our est. 38%. Surprise was mainly driven by 320bp YoY
improvement in other expenses. The management attributed this to benefits of operating leverage given the
increased capacity utilization at DSN SEZ. Power cost too has reduced for the quarter.
Based on 3QFY14 results, we have raised our FY14E/FY15E/FY16E EPS estimates by 5%/6%/2% to reflect higher
margins on account of operating leverage benefit and lower tax rate. We estimate revenue/PAT CAGR of
21%/24% over FY13-16E with EBITDA margins between 39%-41%.
The stock trades at 18.7x FY15E and 15.1x FY16E earnings. Buy with a revised TP of INR1,570 (18x FY16E EPS).
Divi’s Labs continues to be one of our top picks in Indian pharma.
WIN – Week In a Nutshell
13
Feb 7
th
2014

WEEK IN A NUTSHELL
WEEK IN A NUTSHELL
EICHER MOTORS: In-line; CV sales drops 31% YoY; momentum in Royal Enfield continues with ~77%
growth
Eicher Motors reported 30% decline in CV sales at 2,608 units (est 2,598 units).
The LMD and HCV segment each declined by 33% YoY to 1,685 and 471 units respectively.
Buses volumes declined by 15% YoY to 452 units.
Volvo truck sales grew by 58% YoY (on low base) to 30 units.
Eicher recently launched the new range of CVs (with Volvo inputs) from 5-49 tonne.
Strong momentum in Royal Enfield though continues with 77% YoY growth to 20,232 units (v/s est 20,312
units). The company has guided volumes of 250,000 units for CY14.
The stock trades at 23.7x/17.1x CY14E/CY15E EPS of INR196/271 respectively. Maintain Buy.
Grasim Industries 3QFY14: Below est on cost push, despite strong volumes and higher realizations;
Maintain Buy
S/A net sales grew 20% YoY to ~INR14.6b. EBITDA margins at 13.4% (v/s est 17.1%) and EBITDA at ~INR1.95b
(v/s est ~INR2.25b). Lower other income and higher tax restricts PAT to ~INR1.24b (v/s est ~INR2.5b), a de-
growth of 37% YoY (-69% QoQ).
VSF volumes grew 23.5% YoY (4% QoQ) to 97,049 tons (v/s est ~90,366 tons). VSF realizations were flat
QoQ/YoY to ~INR121.6/kg (v/s ~INR119.6), benefiting from weaker INR despite weakness in global VSF prices.
However, severe cost push (~4% YoY/7% QoQ) on account of higher pulp prices due to higher wood cost and
weaker INR, impacted PBIDT margins by 480bp YoY (-630bp QoQ) to 13.5% (v/s est 19.8%) lowest margins in
last 5 years.
Key takeaway from the call: a) The management has indicated that VSF prices globally under pressure due to
surplus dissolving grade pulp capacity, b) China has been key driver of VSF demand due to artificially high cotton
prices, c) increase in wood cost and annual maintenance shutdown impacted captive pulp subsidiaries, d) S/A
tax rate to be 9-10 in FY14 and e) expects 50mt (v/s 55mt in 2QFY14 v/s 60mt in 1QFY14) of new cement
capacities over next 3 years.
On consolidated basis, net debt was at ~INR37.5b (v/s ~INR28b in Mar-13). Its consolidated capex guidance for
FY14 is lowered at ~INR33.4b (v/s INR54b in 2QFY14), whereas total capex guidance remains same at ~INR180b.
Our FY14/15 consol EPS is downgraded by 4%/3% to ~INR249/INR299. The stock trades at 8.4x FY15 Consol EPS
and 1x P/B and implied cement valuation of ~USD73/ton. Maintain Buy with target price of INR3,352 (SOTP
based, valuing economic interest in cement business at USD125/ton & 20% hold-co discount and VSF at 4x
EV/EBITDA).
GSPL 3QFY14: Significantly below estimates led by lower volume and tariff; headwinds for incremental
gas continue; Neutral
Gujarat State Petronet’s 3QFY14 reported revenues at INR2.4b (est of INR2.8b; -6% YoY, -12% QoQ) and EBITDA
at INR2.0b (est of INR2.5b; -12% YoY, -18% QoQ) were below estimates led by lower than expected volumes at
20.2mmscmd (est of 21.3mmscmd and tariff at INR1,291/mscm (est of INR1,350/mscm). Reported PAT stood at
INR873m (-27% YoY, -23% QoQ) v/s es of INR1.2b.
Transmission volumes continue to decline: GSPL reported transmission volumes lower than estimates at
20.2mmscmd (-26% YoY and -4% QoQ) due to continued decline in KG-D6 volumes and lower LNG imports by
PLNG during 3QFY14 (led by high LNG prices, which makes it unviable for many sectors).
Tariff decline in the 3rd consecutive quarter: Implied transmission tariff at INR1,291/mscm (+24% YoY and -5%
QoQ) has declined for the 3rd consecutive quarter, indicating likely revision in take-or-pay contracts with the
consumers.
Key events to watch: 1) Construction of 3 new trunk pipelines in set timelines; 2) Volume ramp-up and 3)
Monetization of its stake in GSPC Gas and Sabarmati Gas.
Valuation and View: We are cutting our FY14E/FY15E EPS estimates by 9%/2% to factor in actual 3QFY14 results
and lower transmission tariff. The stock trades at 6.6x FY15E EPS of INR8.7. Maintain Neutral despite attractive
valuations due to continued headwinds for incremental gas volumes, which is the key earnings driver for the
stock.
14
Feb 7
th
2014
WIN – Week In a Nutshell

WEEK IN A NUTSHELL
WEEK IN A NUTSHELL
GODREJ CONSUMER (GCPL) 3QFY14: Below estimates; Home Insecticides growth in single at multi
quarter low; Neutral
GCPL results are below estimates with Consol sales growth of 16.9% to INR19.8b (est. INR20.7b), EBITDA growth
of 9.5% to INR3.1b (est INR3.6b) and Adj PAT growth of 13.6% at INR1.96b (est. INR2.3b).
Household Insecticides growth of 8% YoY is lowest in many quarters. Management attributes it to weaker
monsoon trends in South and East.
However, GCPL’s growth is ahead of category growth. Soaps have grown at 6% both in volume and value terms
as against category de-growth in volume and value, as per management. GCPL has taken price hikes to pass on
input price inflation. Hair Colors reported robust 37% value growth, much ahead of category growth, driven by
Expert Rich Hair Creme. Various initiatives pertaining to marketing/trade activations are aiding the growth.
Consol EBITDA margins declined 110bp to 15.5% (est. 17.3%). Ad spends went up 70bp to 11.5% while other
expenses declined 100bps YoY.
International business: 13% constant currency organic sales growth, 22% reported sales growth. Operating
margins down 250bps to 12.4% led by Indonesian entity (Foods business distribution at breakeven EBITDA, 58%
wage hike and 33% fuel cost increase). 80bps and 170bps margin gain in LATAM and Europe, resp while 260bps
and 280bps margin decline in Indonesia and Africa, resp.
Ex of Indonesian Foods business and reversal of INR90mn tax credit in Darling, 9MFY14 International PAT
growth stood at 33%.
GCPL’s results bring to fore the inherent volatility associated with its international business with
disproportionate impact coming from Indonesian entity.
Slowdown in Home Insecticides category after many consecutive quarters of 20% plus revenue growth can be a
blip due to seasonal nature of the category. However, if it continues, it can take the sheen off the domestic
growth momentum. We expect an earnings cut of ~5-7% for FY14 and FY15. Neutral.
HERO MOTOCORP: Above est at 561,253 units (est of 530,000 units); mgmt guides multiple new
launches in phased manner
Hero MotoCorp reported sales at 561,253 units (above est of 530,000 units), registering a marginal growth of
1% YoY (+7% MoM).
Our industry interaction indicates that retail sales have picked-up in Jan-14 v/s Dec-13. We estimate Jan-14
retails at 525k units v/s 380k units in Dec-13.
Volume base for Feb & Mar is lower at average 484k units (considering weakness in 4Q last year in northern
region due to delayed farm cash flows).
We expect Hero to use low base opportunity to correct high channel inventory which stands at 6-7 weeks (in-
line with industry) and still being able to report growth.
HMSI: Strong scooter growth continues to drive overall sales
Honda Motorcycle & Scooters India (HMSI) reported volume growth of 50% YoY (+16% MoM) to 344,750 units.
Strong growth was driven largely by scooters which grew by 63%, while motorcycle grew 38% YoY.
HMSI plans to launch a new scooter with 125cc (called as Activa Vision) in coming months.
IDFC 3QFY14: PAT above est.; Growth moderate further; NPLs spike up; Lower Provisions drive PAT beat
IDFC’s 3QFY14 PAT grew 11% YoY and 3% QoQ to INR5b (16% above est.). While operating profit was 5% below
est. significantly lower provisions (INR365m v/s est. of INR1.3b) and lower tax rate (26.4% v/s est. of 31%) led to
above estimated PAT. Continued moderation in growth (flat YoY and down 3% QoQ), spike up in telecom loan
pipeline (INR110b vs INR85b a qtr ago and INR15b in 4QFY13), increase in GNPA (+30bp QoQ to 62bp), addition
of INR40b in India Infra fund II and drop in spreads (10bp QoQ, TTM) to 2.3% were the key highlights.
On a YoY basis, transportation (+7% YoY, down 7% QoQ) and others segment (+2% QoQ and +15% YoY) were
the growth drivers whereas, telecom (down 13% YOY and 2% QoQ) and energy (flat QoQ and YoY) were the
drags. Loan pipeline increased to INR225b vs. INR192b a quarter ago led by telecom, short term in nature.
Sanctions/disbursements for the quarter stood at INR54b (+25% YoY)/ INR20b (down 22% YoY & 18% QoQ).
Share of energy segment in overall exposure declined to 33% vs 39% in 3QFY13.
15
Feb 7
th
2014
WIN – Week In a Nutshell

WEEK IN A NUTSHELL
WEEK IN A NUTSHELL
Other highlights a) Trailing 12months Cost to income ratio stable QoQ at 15% d) Average interest duration of
loans has come down to 1.3yrs vs 1.4yrs a quarter back c) AUM was up 36% YoY (6% QoQ) to INR516b led by MF
AUM growth of 38% YoY d) CAR remains healthy at 24.8% with Tier I at 22.5% and e) Outstanding provision for
loans remain healthy at 2.03% vs 1.95% a quarter ago.
ING VYSYA BANK 3QFY14: NIM impacted by one-offs; Restructuring rises; NPL stable; Trades at 1.4x
FY15BV
ING VYSYA Bank’s 3QFY14 PAT grew 3% YoY to ~INR1.7b (6% below estimate). NII was 8% below estimate at
INR4.2b (+3% YoY) led by lower than expected NIM (down 10bp QoQ due to reversal of interest on RL of
INR257m, Adjusted up 10bp QoQ) and moderation in customer asset growth (10% YoY). While PPP was 9%
below expectation at INR2.7b (+4% YoY), lower provisions of INR230m (v/s INR400m) helped PAT.
GNPA in absolute terms was flat QoQ and on a lower base NNPA increased 17% QoQ. GNPA and NNPA in %
terms was stable QoQ at 1.7% and 0.2%. PCR declined 1.7% QoQ and stood at 87% - one of the best in the
industry. During the quarter bank restructured loan of INR2b (0.6% of loan) under CDR. OSRL stood at INR5.6b
(1.6% of loans).
SA deposit growth was flat QoQ (+ 13% YoY) and as a % of overall deposits stood at 15.7% as compared to
15.3% a quarter ago. CA grew 8% QoQ and 13% YoY. While reported CASA ratio improved QoQ to 34.7% v/s
32.5% in 2QFY14, core CASA ratio dropped QoQ at 31.6%.
Other highlights: (1) During the quarter bank added just 2 branches (24 branches in last two years). (2) Bank
provided INR41m on account of creation of DTL on special reserve for FY14 and also debited its reserves by
INR254m for DTL creation on special reserve for previous years and (3) fee income (ex-forex) continues to
disappoint with a YoY growth of just 7% and (4) Loans grew 4% QoQ and 8% YoY. In 2QFY14 there was a
repayment of INR21.5b from one large telecom account adjusted for which loan growth would have been 15%
YoY.
The stock trades at 1.4x/1.3x/1.2x BV of FY14/15/16. Maintain Buy with the target price of INR655 (1.6x FY15
BV).
JAIPRAKASH POWER 3QFY14: Below estimate; lower contribution from Bina/Karcham Wangtoo; cut
earnings/TP; de-leveraging is key
JPVL standalone PAT loss stood at INR1.5b, higher than our estimate of INR875m. Lower generation at Bina
power project (509MU, vs est of 821MUs), lower merchant realization for Karcham Wangtoo hydro power
project at INR3.02-3.04/unit, vs INR3.54/unit YoY (vs est of INR3.50/unit) and transmission costs (INR448m, vs
est of INR360m) impacted profitability. K. Wangtoo project is being converted into regulated power project
(704MW) and petition has been filed with CERC to adjudicate project cost. This would help reduce volatility in
earnings, losses in lean season.
Operational performance for power projects was however strong with 19%/21% YoY jump in hydro generation
for Baspa/K. Wangtoo project and 46% PLF for Bina power project (vs average of 33% in 1HFY14). Plant
availability at Bina was robust, enabling recovery of fixed charge, while generation was impacted due to
backdown by MPDISCOMs.
Project update: a) Vishnuprayag project debris are cleared and hydraulics needs repair/replacement, expected
to resume operations by Mar-14; b) Nigrie project 1st unit synchronization by Mar-14; c) Excavation/ initial
production has begun at Amelia mine (linked to Nigrie project) and evacuation infrastructure (merry-go-round)
is in place; d) Clearances are in place for Dongri Tal mine and land acquisition is underway, CoD by 1QFY15 and
e) Capex of INR76b incurred on Bara project (INR20b equity spent of the total of INR30b) of the total capex of
~INR120b.
JAYPEE INFRATECH 3QFY14: Revenue beats est; EBITDA plunges on lower margin; operations weak,
albeit up QoQ
Jaypee Infratech (JPIN)’s 3QFY14 performance was below our estimates. While revenues were ahead of
estimates, sharp decline in margin kept EBITDA at INR3.6b (v/s est of INR4b). Revenue grew 6% YoY to INR9.9b
(v/s est of INR9b), while PAT stood at INR1b (v/s est of INR1.4b) due to lower profitability.
16
Feb 7
th
2014
WIN – Week In a Nutshell

WEEK IN A NUTSHELL
WEEK IN A NUTSHELL
Average annual PCUs at Yamuna Expressway stood at 12.9K annum (v/s 11.8K - 6 months back), with total toll
revenue in 3QFY14/9MFY14 at INR379m/INR971m (+25%QoQ). This implied annualized run-rate of INR1.5b v/s
INR0.9b in FY13 (+67%). Management expects 53% growth in toll revenue over FY14-16, with FY14/15/16 run-
rate at INR1.5b/INR2b/INR3.5b.
Presales remains weak, albeit improved QoQ to 0.64msf (INR2.4b) v/s 0.5msf (INR1.8b) in 2QFY14, and est of
1msf (INR 3.5b). Presales velocity weakens further in Mirzapur (Parcel 3), which was offset by better volume in
Noida parcel (accounted for 78% of sales value in 3QFY14). Based on run-rate and near-term challenging
outlook, we cut FY14/15 presales 5-15% to INR11b/18b/20b.
Weak presales over past 3 quarters have also impacted collection run-rate, which is down to INR5.1b in 3QFY14
(v/s INR5.7b in 2QFY14 and average FY13 run-rate of INR9b). Overall, 9MFY14 operations remain much weaker
than 9MFY12 with presales at INR8.3b (v/s INR27b), collections of INR17.7b (v/s 27.2b).
Near-term operational performance, which is largely dependent on the success of monetization in Parcel-3 and
Agra is expected to remain weak especially if the real demand growth surrounding the Yamuna Expressway gets
delayed, and given that prevailing run-rate has been subdued.
The stock trades at 4.5x FY16E EPS and 0.4x FY15E BV (7-8% RoE in FY14-16).
LUPIN 3QFY14: Above est; India, Japan recover, momentum in US generics continues; expect strong
quarters ahead; upgrade EPS by 1-3%
Lupin’s 3QFY14 results were above estimates. Sales grew 21% YoY to INR29.8b (beat of 8%), reported EBITDA
grew 29% YoY to INR7.3b (beat of 13%) and PAT grew 41% YoY to INR4.8b (beat of 5%)
Revenue beat was mainly due to a 35% growth in constant currency for US generic business (v/s est. 18%), 14%
growth in India (v/s est. 5%), and 26% growth in APIs (v/s est. 5%). Japan reported 2% growth (v/s est. decline of
2%), while RoW + South Africa grew 23% (est. 32%).
EBITDA margin expanded 150bps YoY to 24.6% (est. 23.5%), led by improvement in other expenses.
Management attributed this benefit from operating leverage.
Results include one-off upside from generic Tricor and Trizivir. Ex these one-offs, core sales grew 20% YoY (est.
12% YoY), core EBITDA grew 28% (est. 12%) and adj. PAT grew 43% (est. 35%).
Based on 3QFY14 performance we have increased our FY14E/15E/16E by 3%/1%/2%. We see sustained
momentum in the US generics business and see India growth bouncing back to historical levels. We expect
margin expansion to come from limited competition opportunities in US and turnaround in Japan.
We estimate core EPS of INR33.3/INR42.4/INR49.3 for FY14E/15E/16E, i.e. 29% EPS CAGR for FY13-16E. The
stock trades at 21.8x FY15E and 18.7x FY16E EPS. Buy with a revised target price of INR1,090 (22x FY16 core
earnings + DCF estimate INR6/share from gTrizivir launch).
MARUTI SUZUKI: In-line at 102,416 (est 104,500 units), decline of 10.3% driven by 48% drop in exports,
Celerio dispatches started (est 5k units)
Maruti Suzuki (MSIL) reported 10% decline in January 2014 sales at 102,416 (v/s est 104,500 units). This was led
by 6.3% YoY (+11.5% MoM) drop in domestic sales, while exports have declined by 47.7% YoY (+36% MoM) to
5,847 units (v/s est 7,500 units).
Domestic sales were led by 7.5% YoY (24% MoM) growth in Dzire/Sx4 volumes to 19,423 units (est 18,000),
while MPVs (Omni, Eeco) sales grew 11.6% YoY (+12% MoM) to 9,345 units (est 9,000).
Management had indicated that demand environment remain challenging particularly in urban markets.
However, rural markets (30% of sales) continue to grow at strong rate (YTD growth 18% YoY).
Discounts in 3Q have reached all-time high levels of INR19,400/unit with pressure on discounts expected to
continue until sentiments recover.
Our industry interaction indicate that dispatches of Celerio (Automatic Manual Transmission) model have
started in Jan-14 (around 5k units). Launch is expected on Feb 6th.
We expect FY14 volumes to drop by 2% YoY, implying a residual run-rate of 107,139 units (residual de-growth of
6.7% YoY).
MSIL trades at 13.8x/11x our FY15E/16E Consol. EPS of INR118.2/148.5 respectively. Maintain Buy.
WIN – Week In a Nutshell
17
Feb 7
th
2014

WEEK IN A NUTSHELL
WEEK IN A NUTSHELL
MARUTI SUZUKI: Mgmt meet - MSIL’s core earnings/FCF unaffected; PAT/return ratios to improve;
Surplus funds to use to strengthen marketing/R&D
We attended Maruti Suzuki’s (MSIL) Analyst Meet to discuss on MSIL’s decision to expand Gujarat facilities
through Suzuki’s 100% subsidiary (Suzuki Gujarat). Management reiterated that MSIL’s core earnings/FCF will
remain unaffected, while PAT and return ratios to improve led by capex savings on 1
st
phase of expansion (and
consequent treasury income). Key highlights are:
MSIL is the cornerstone in Suzuki’s global strategy (contributing 50% of profits), thus Suzuki’s priority is to make
MSIL stronger and healthier.
Given the scale of expansion, MSIL’s management bandwidth would have been stretched given the current size
of MSIL’s operation (~20k employees). Thus, Suzuki would focus on manufacturing, while MSIL can channelize
their energy on strengthening its R&D, marketing, sales etc.
To protect the interest of minority shareholders of MSIL, the Suzuki Gujarat subsidiary would not make any
surplus/profit/FCF or declare dividend. The company would make only such surplus (post tax) which is
necessary for the expansion of the facility to benefit MSIL.
The tenure of the contract manufacturing agreement would be of 15 years. The agreement is extendable on
mutual consent of both parties on similar terms/principles. The Gujarat (owned by MSIL) land lease agreement
would be co-terminus with the contract manufacturing agreement. The rentals would be determined by an
independent body.
Suzuki Gujarat plant will sell cars only to MSIL and as per requirements of MSIL. MSIL will in turn sell these
vehicles through its network and earn distribution & selling margins/profits on the same. The agreement would
be between MSIL & Suzuki, Japan.
Profitability on these vehicles would be similar had the investment were made by MSIL itself. In addition to that,
they would earn treasury income (8% yield) on money thus saved on capex (INR30b). With similar profits and no
capex, MSIL’s cash flows and return ratios would improve.
Soft loan from Suzuki to MSIL would have entailed currency risk (hedging cost of 7-8%) and loan repayment
obligation to MSIL, hence equity investment by Suzuki in the separate subsidiary considered suitable.
Cash surplus available with MSIL could be used more in R&D, building marketing network etc.
M&M: In-line at 62,794 (est 61,499 units); Autos decline 14% YoY; tractor grew 15% YoY
M&M Jan-14 sales at 62,974 (est 61,499 units) declined by 6% YoY (+11% MoM) driven by 14% decline in Auto
volumes, while tractors continued with their healthy growth performance (15% YoY) to 20,109 units (est
20,094)
Weakness in passenger vehicles (UVs & Verito) continues with decline of 25% YoY to 19,792 units.
Pick-up segment have grown by 4% YoY reflecting shifting preference towards larger pick-ups (where M&M is
market leader) due to financing constraint towards smaller CVs.
Management indicated that while immediate turnaround for auto industry is not expected without certain
policy corrections and support, the worst seems to be over.
Commenting on the monthly performance, Pravin Shah, Chief Executive, Automotive Division, Mahindra &
Mahindra Ltd. said, “The first month of 2014 did not witness any improvement in the overall industry
performance and the situation remains subdued. The recent Repo Rate hike will in coming months escalate the
rate of interest on car loans impacting consumer sentiment. We hope the upcoming Auto Expo which will
showcase new products and technology, will provide a trigger in giving a much needed boost to the auto
industry and overall sentiment.”
Tractor sales continue to grow at a healthy rate. Sales increased by 15% YoY (18% MoM) to 20,109 units (v/s exp
of 20,094 units). We expect to raise our tractor sales estimate for 4QFY14.
Commenting on the monthly performance, Rajesh Jejurikar, Chief Executive, Tractor and Farm Mechanization,
Mahindra & Mahindra Ltd. said, “We have achieved a cumulative domestic growth till January 2014 of 23%. This
is primarily due to a bumperKharif crop and the anticipation of a good Rabi crop. We expect the good run to
continue for the rest of the quarter.”
The stock trades at 10.5x/8.8x FY15E/16E Con. EPS of INR84.7/INR101.2 respectively. Maintain
Buy.
WIN – Week In a Nutshell
18
Feb 7
th
2014

WEEK IN A NUTSHELL
WEEK IN A NUTSHELL
NMDC: January deliveries up 9% MoM; Karnataka E-auction bid volumes up 57% MoM; lumps prices up
2%, fines prices down 12% yet 2
nd
highest. Maintain Buy
NMDC has already dispatched 2.86m tons (+9% MoM) of iron ore in the month of January and is well on track of
delivering 8.5m tons during 4QFY14 and 29.6m tons during FY14. We will not be surprised if NMDC delivers
above expectation volumes because the Essar Steel pipe from Chhattisgarh complex to Vizag has re-started
w.e.f. 24th Jan, 2014. Logistics bottlenecks had constrained NMDC from ramping up volumes despite it having
much larger mining permits and capacities.
Karnataka E-auction quantity has jumped 57% MoM to 1.3m tons. During Jan-2014, bid premiums over floor
prices have cooled off for NMDC, but the private mines have jacked up floor prices. NMDC benefitted with
higher volumes at the cost of private mines.
Karnataka E-Auction data suggests that the average realization for NMDC has fallen by 16% MoM to INR2993/T
in January 2014 due to dual effect of larger share of iron ore fines and lower average grade. A closer analysis of
data reveals that the share of iron ore fines in the mix has increased 9pp to 60% due to liquidation of low grade
iron ore dumps. On normalizing the grade to 60%, the average realization is actually down just 5% MoM.
Individually, the normalized price of lumps is up 2% MoM, while normalized price of fines is down 12% MoM yet
2nd highest in last 13 months.
Valuations are attractive at FY15 EV/EBITDA of 4.4x, EV/T of USD4.1, P/BV of 1.8x (RoE 21.4%), dividend yield of
7.1%. NMDC is our top pick in ferrous space. Re-iterate BUY.
Oberoi Realty 3QFY14: Operational weakness continues, but possibly nearing inflection, with Worli,
Mulund, JVLR launch on 6-month radar. Maintain Buy
Revenue declined 40% YoY (and 10% QoQ) to INR1.7b (our est: INR1.9b). EBITDA declined 47% YoY (grew 4%
QoQ) to INR898m (our est: INR1.1b). EBITDA margin at 53% (+7pp QoQ, -7pp YoY) failed to improve due to
negative operating leverage. PAT was INR681m (our est: INR867m).
No new launch and slowdown in broader market continue to impact presales, which declined further to
0.028msf (INR0.6b) from 0.039msf (INR0.8b) in 2QFY14 and INR2b-2.5b/quarter in FY11-13. Hotel operations
performed better due to seasonality. Oberoi Mall and Commerz were stable QoQ.
We calculate that in 3QFY14, company had inflow of INR0.9b (collections, rentals and other income), which was
spent as follows (a) construction of INR1.3b-1.4b (Worli: ~INR0.95b, Exquisite: ~INR0.25b, Esquire: INR0.12b),
(b) fungible FSI payment of INR1.26b for Garden City (Goregaon) Phase III, and (c) capex (Commerz II), tax and
overheads.
The recent favorable Supreme Court verdict clears the forest overhang on the Mulund project and paves the
way for launch. Thus, there is improved visibility on presales momentum. OBER has also received approvals for
conversion of the JVLR project (Prisma) from commercial to residential.
We are cutting our FY14 EPS estimate by 28% and are upgrading our FY15 EPS estimate by 10%, as Esquires
revenue recognition is deferred to FY15. While some headwinds (Commerz II, slowdown in Goregaon) remain,
launch visibility has improved. The stock trades at 8.1x FY16E EPS and 1.1x FY16E BV. Maintain Buy with a target
price of INR240.
PETRONET LNG 3QFY14: Below est. led by lower Dahej throughput; Kochi ramp-up slow; to save INR6b
on Dahej expansion; Valuations reasonable
Petronet LNG’s reported 3QFY14 EBITDA at INR3.5b (est INR3.8b) and PAT at INR1.4b (est INR1.5b; -57% YoY,-
25% QoQ) were below estimate primarily due to lower than estimated volumes at dahej at 120tbtu (v/s est of
130tbtu; -15% YoY, -2% QoQ). Marketing margin at Dahej was also lower than estimates at USD0.2/mmbtu as
compared to USD0.35/mmbtu in 2QFY14.
Dahej capacity utilization at 95% in 3QFY14: Re-gas volumes at 120.2tbtu (2.39mmt) was below estimates
primarily due to higher cost of LNG in spot market. Continued high spot LNG prices coupled with INR
depreciation has been impacting the price sensitive short term spot demand. 3QFY14 throughput mix showed
lower spot volumes with: (a) 92tbtu (-5% YoY; -7% QoQ) for long term; (b) 18tbtu (+26% YoY; +48% QoQ) for
third-party and (c) 11tbtu (-65% YoY; -15% QoQ) for pure short-term. Kochi terminal throughput stood at
3.4tbtu (5% utilization) during 3QFY14.
19
Feb 7
th
2014
WIN – Week In a Nutshell

WEEK IN A NUTSHELL
WEEK IN A NUTSHELL
New projects/expansions broadly on track, Second Jetty by Mar/Apr 2014; announces 20% savings in Dahex
expansion project:
• PLNG has awarded the last EPC contract for Dahej expansion and expects the project to be completed on track
by November 2016. It has also announced a saving of INR6b on capex, current capex guidance at INR24b v/s
INR30b earlier. It will receive a advance of INR12b (INR2b per mmt) from offtakers towards advance for building
the capacity, to be adjusted over 15 years against revenues post commissioning.
• Dahej 2nd jetty at Dahej to complete by Mar/Apr-14,
• Gangavaram environmental clearance is expected during 4QFY14. Plans on FSRU are still not firmed up
(depends on firm volumes), however plans for land terminal are largely on track.
Valuation and View
• We are rolling over our SOTP to Mar-16 and the same now stands at INR156/share offering a 42% upside from
the current levels. The stock trades at 10.5x FY15E EPS of INR10.5. Buy.
PNB 3QFY14: Inline; Asset quality improvement a positive surprise; Strong NIMs due to de-bulking;
growth to improve; Buy
PNB’s 3QFY14 PAT declined 42% YoY to INR7.6b (in-line). Positive surprises were a) NIM improvement of 10bp
QoQ to 3.6%, b) fee growth of 15% YoY (vs flat in 1H) c) fall in net slippages (60bp of loans vs 270bp in 1H) and
stable GNPA (% down 20bp QoQ) and d) improvement in PCR by 340bp QoQ.
Additions to restructured loans (RL) were at INR21.5b (INR27.7b in 2QFY14). However, there were
reduction/adjustment of INR75b on account of (a) INR21b of SEB bond receipt, (b) INR28b+ removed from
restructured pool as was categorized only due to DCCO extension (c) normal reduction of INR7b and (d)
INR18.5b of NPA (cumulative). OSRL stood at INR313b (9.6% of loans).
Other highlights: a) SA grew 3% QoQ (+14% YoY). CASA ratio was stable QoQ at 38.3% and proportion of bulk
deposits declined to 8% v/s 9.4% in 2QFY14 and 24% 3QFY14 b) OSRL ex SEB and AI it stood at 7.6% of loans.
PNB carries provision to the tune of 70bp of loans on OSRL.
POWER FINANCE 3QFY14: Above est; Healthy loan growth; Stable asset quality; Interim div of
INR8.8/sh; Raise est. by ~7%
Power Finance Corporation’s (POWF) 3QFY14 PAT grew 37% YoY and 20% QoQ to INR15.3b (19% above
estimate of INR12.9b). While the net operating income was in line with est. significantly lower forex losses
(INR290m v/s expectation of INR 1.25b) and lower provisions (INR510m v/s est. of INR 1.2b) led to above
estimate PAT. Key Highlights
Asset quality remained stable QoQ with %GNPAs/NNPA stood at 0.65%/0.52%. No new account got added to
NPL during the quarter. POWF made a provisioning of INR0.54b towards standard assets during the quarter;
Provisioning coverage ratio remained stable at QoQ at 20.4%.
Loan growth (+3% QoQ and 20% YoY) was largely inline with estimate. Loan to private sector grew (+46% YoY &
8% QoQ) to INR 263b; Share of private sector borrowers in the overall loan mix increased further to 14.8% (from
14.2% a quarter ago and 12.1% a year ago).
Disbursements growth for 3Q/9M was -3%/flat YoY whereas, sanctions grew 35%/-13% YoY. Almost 35% of the
incremental loans during the quarter came from transitional finance to SEB. Share of short term loans in overall
loans has increased to 12.8% vs 7% a quarter ago and 3.7% a year ago.
Reported margins stood at 4.93% (up 32bp YoY, down 10bp QoQ); sequential decline in yields was led by 10bp
QoQ moderation in yields to 12.37% coupled with 5bp QoQ increase in cost of funds.
While balance sheet and earnings growth, return ratios remain healthy and even valuations are very attractive,
Reforms in the power sector remain a key catalyst for the stock performance.
The company has declared an interim dividend of INR8.8/sh.
POWEGRID 3QFY14: Below estimate led by lower core business contribution, STOA; capex momentum
remains strong but capitalization growth is the key
Powergrid reported revenues of INR37b, up 10% YoY but lower than our estimate of INR39b. While revenue
from telecom (INR677m, vs est of INR725m) and consultancy (at INR1.5b, vs est of INR1.4b) division was largely
in-line with estimate, the transmission revenue was lower. EBIDTA for the quarter stood at INR31b, vs est of
20
Feb 7
th
2014
WIN – Week In a Nutshell

WEEK IN A NUTSHELL
WEEK IN A NUTSHELL
INR34b. At PBT level, the reported numbers stood at INR14.4b, vs est of INR17.2b. This was again due to lower
contribution from core business, while EBIT from consultancy (INR505m, vs est of INR587m) and telecom
(INR196m, vs est of INR264m) were marginally lower than estimate.
PAT for the quarter stood at INR10.4b, down 6% YoY and up 1% QoQ (INR10.3b in 2QFY14). Lower absolute PAT
QoQ was also due to loss in Short term open access (STOA) charges for PGCIL (INR1b in quarter) owing to
change in regulation. PBT for transmission division stood at INR21b, up 1% YoY on reported basis and down 12%
QoQ. However, 2QFY14 transmission PBT had prior period revenues of INR2.1b and thus adjusted PBT de-
growth on QoQ basis would be 3%.
Notes to account highlight one-time income (approval of prior period arrears by regulator) of INR1.6b in
3QFY13, which boosted PAT for last year. However, we note that there was no mention of any such onetime
gain in notes to accounts of results last year. Thus, muted transmission PBT growth is perplexing given
capitalization of ~INR130b since 4QFY12 to 2QFY14. We await clarity on the same.
Management indicated that gross fixed assets as at Dec-13 stood at INR902b. Comparing the number with
INR806b of gross fixed assets as at March 2013, leads to capitalization of INR95.5b in 9MFY14 (up merely 2%
YoY). However, it is important to note that PGCIL adds foreign exchange rate variation (FERV) to gross fixed
assets (on loan re-pricing) and thus, we seek clarity if INR902b of gross fixed assets includes any FERV
adjustment. As at March 2013, FERV account stood at INR17b. If so, the capitalization would be lower to that
extent (if FERV of similar quantum is included in INR902b). Capex for 9MFY14 stands at INR165b (+31% YoY).
However, this is driven by commissioning of large project of INR12b on 1st January 2014.
PGCIL is hosting an analyst meet tomorrow at 3.45PM IST at Hotel Trident to discuss 3QFY14 performance. We
will review our estimate post the same.
PRESTIGE ESTATES PROJECTS 3QFY14: EBITDA beats est; operations marginally moderated QoQ, but on
track to meet/beat guidance; effective debt up INR1b QoQ
Prestige Estates (Prestige) has reported earnings better than our estimates led by improvement in EBITDA
margin. EBITDA of INR1.3b (-7% YoY) beats our est of INR1.2b, driven by +5.6pp QoQ uptick in margin to 30.6%
(v/s est of 26%).
Revenue stood at INR4.3b (down 12% YoY), while PAT stood at INR806m (-12.5% YoY), impacted by higher
interest cost.
Core operations (released earlier) were largely in line with our estimates, albeit moderated QoQ. 3QFY14
presales (Prestige’s share) stood at 1.55msf (INR9.4b), -12% QoQ, +25% YoY growth. 9MFY14 presales reached
~80% of FY14 annual target.
Customer collections witnessed a marginal sequential moderation at INR5.9b (-4% QoQ, +17% YoY). 9MFY14
collections stood at INR18.2b (v/s est of INR24b in FY14; FY14 guidance of INR23b).
New leasing in 3QFY14 was 0.86msf (Prestige’s share of 0.22msf), while 9MFY14 leasing stood at 2.1msf (PEPL
share of 0.86msf). Rental income grew 3.9% QoQ (+9.4% YoY) to INR615m.
Consolidated net debt stood at INR22.9b (+INR1b QoQ), while effective debt, as PEPL’s stake increased INR0.9b
QoQ, was at INR21.7b (0.72x) on the back of negative FCFE.
Negative FCFE was attributable to: (a) cash inflow of INR6.8b (collections of INR5.9b and rent of INR0.6b, and
other income of INR0.3b) which was utilized towards (b) constructions spending (INR5.5b), overheads (INR0.5b),
land advances and payment towards acquisition of higher stakes in Eden Investment land (INR0.8b), interest
(INR0.6b), and tax (INR0.35b).
Prestige trades at 9.8x FY16E EPS, 1.3x FY16 BV (RoE of 14%), and 9.9x FY15 EV/cash EBITDA. We maintain Buy
with target price of INR186 (32% upside).
RANBAXY 4QFY14: Operational perf. above est; guides for lower impact from Taonsa ban but higher
remediation costs ahead; raise core EPS by 2-4%
Ranbaxy's 4QFY14 result was above estimates. Core revenue grew 16% YoY to INR28.9b (in line) while core
EBITDA grew more than 6x YoY to INR2.6b (v/s est INR2.3b) over an abnormally low base. Core EBITDA margin
was 9% (v/s est 8.1%). Adj. PAT stood at INR1.2b (v/s est INR1.1b) compared to loss of INR45m last year.
WIN – Week In a Nutshell
21
Feb 7
th
2014

WEEK IN A NUTSHELL
WEEK IN A NUTSHELL
Revenue growth was driven by US base business, which in turn was led by Absorica sales. Romania also grew
faster than expected, while performance from other key emerging markets like Russia, LatAm and Africa was
below estimates. Domestic business growth was in-line led by OTC segment.
Core EBITDA margin expanded 730bp YoY on a low base and was 90bp above est due to lower other expenses.
Management attributed this to cost rationalization measures across geographies and indicated that EBITDA
margin adjusted for consent decree related costs stood at ~12%.
The company reported a net loss of INR1.6b (v/s est INR1.4b profit) due to INR2.6b write-off resulting from FDA
ban on Taonsa plant.
Key concall takeaways: RBXY did not revise the guidance for FY14E and will share the same for FY15E in next
quarter. Management continues to maintain that all FTF exclusivities will be retained. Only 10-12% of US sales
are dependent on APIs from Taonsa (v/s our earlier est 20%).
Management has not shared any timeline for the resolution of US FDA issues and indicated that progress is as
per plan. However, with the inclusion of Taonsa unit in the consent decree, the remediation costs are expected
to continue beyond earlier expectation of moderation from FY16E.
Sobha Developers 3QFY14: Above est; presales, collections weakened QoQ; FY14 guidance lowered, but
hints 4QFY14 operations to return to normalcy. Maintain Buy
SOBHAs 3QFY14 P&L was better than expected, though margins remained below desired levels due to cost
escalations and higher overheads. Revenue grew 27% YoY (stable QoQ) to INR5.4b (our estimate: INR5b), while
PAT grew 11% YoY to INR583m. EBITDA grew 8% YoY to INR1.5b (our estimate: INR1.4b), translating into EBITDA
margin of 27.4% (against our estimate of 28% and 26.5% in 2QFY14).
Presales (as reported earlier) were weak at INR5b (-21% QoQ, -5% YoY). Presales volume stood at 0.74msf (-18%
YoY, -26% QoQ). 9MFY14 presales were INR17.4b (against FY14 estimate of INR23.6b). Collections from real
estate projects were weaker QoQ (albeit up 15% YoY) at INR4.4b, and have been showing a declining trend over
three quarters.
Nonetheless, 3QFY14 operating cash flow (OCF) improved to INR1.4b (INR1.2b in 2QFY14 and INR1b in 3QFY13),
due to strong cash flows from contract business. FCFE was negative INR0.5b on the back of expenses towards
land payments (various outstanding ones) of INR1.1b. Net debt was up by INR0.5b to INR13.6b (0.59x).
The management has qualitatively reduced its FY14 guidance on presales from INR26b (earlier) to a moderate
growth over FY13 presales (INR22.2b). It has guided launch of 3 projects in 4QFY14 and hinted that the weak
performance of 3QFY14 was an aberration and normalcy could return in 4QFY14.
Correction in stock price factors in most concerns, and offers opportunity to accumulate. Fundamentals are still
better than peers. We cut our FY14-16 cash EBITDA estimate by 4-8%, NAV by 4% and target price by 10% to
factor in lower presales assumption and weaker market dynamics. The stock trades at 7x FY16E EPS, 1x FY16E
BV (12-14% RoE), and at 40% discount to NAV. Maintain Buy with a target price of INR370.
TATA MOTORS: Below est at 40,481 units (est 44,400 units); pressures across portfolio; LCV sales decline
45% YoY
Tata Motors reported below estimate sales at 40,481 units (v/s est 44,400 units). The disappointment was seen
across portfolio, particularly in LCVs which declined by 45% YoY.
HCV sales declined 5% YoY (+8% MoM) on low base to 8,916 units (est 8,000 units). We have built-in decline of
22% in FY14, implying a residual de-growth of 18% (residual run-rate of 10,341 units).
LCV sales declined by 45% YoY (1% MoM) to 20,267 (est 25,500 units). Our industry interaction indicates that
credit availability has been difficult due to rise in defaults. We are factoring in for volume decline of ~24% for
FY14, implying residual de-growth of 19% YoY (residual run-rate of 33,611 units)
Car sales stood at 8,663 units (est 8,000 units), a decline of 25% YoY (+30% MoM). UV sales were at 2,635 units
(est 2,900 units), a decline of 36% YoY (-6% MoM). We have built-in de-growth of 37% for the PV segment for
FY14.
The stock trades at 7.2x/5.8x FY15E/16E consol. EPS of INR48.7/60.5 respectively. Maintain
Buy.
WIN – Week In a Nutshell
22
Feb 7
th
2014

WEEK IN A NUTSHELL
WEEK IN A NUTSHELL
TATA POWER: Agreement to sale stake in Arutmin mine could be positive for leverage, cashflows,
earnings, valuation impact minimal; Await clarity
Deal: Tata Power has decided to sell its 30% stake in Arutmin mines to Bakri group at a consideration of
USD500m. Post sale, the offtake agreement with KPC mines for 10.5m tons and investment in KPC mines would
remain. Rationale for divestment is to improve cash flows and reduce consolidated debt (3.3x consolidated net
DER as at Sep-13). However, the press release also highlight that operations at Arutmin mines are also impacted
due to lower price.
Valuation perspective: Transaction’s valuations is evaluated on 3 key parameters, viz. a) Equity based, b)
Reserve based and c) Profitability based. We note that proportionate EV for Arutmin mine considering equity
investment of USD100m held by TPWR’s 100% subsidiary Bhira investment (vs USD300m total investment made
towards acquiring 30% stake in KPC/Arutmin mines in FY08) works out to USD418m, vs USD500m consideration.
On reserves front, TPWR’s share of Arutmin’s 2.2b tons reserve works out to 679m tons and thus, EV/ton works
out to USD0.73/ton. We calculate Arutmin mine EBIDTA at USD210m in CY12 and thus, TPWR’s share at USD63,
entailing EV/EBIDTA of ~8x.
Impact: In FY15E, TPWR has to repay FCCB (due in Nov-14, price of INR143/sh) of USD300m and debt at mining
companies level of USD340m (recourse on Tata Power). Divestment of stake will improve cash flow and help de-
leverage. Clarity on tax impact, receipt of net proceeds, net contribution from Arutmin mines and usage of cash
flow would enable determine the benefit of the deal. Assuming savings on interest from USD500m debt
repayment, and no contribution from Arutmin, we estimate that earnings could see an upside of 3-4%. DER can
come down to 3x. Valuations impact unlikely to be meaningful given similar cash flow impact.
We expect TPWR to report consolidated PAT at INR8.8b in FY14E (down 4% YoY) and INR8.4b in FY15E (down
4.5% YoY). Stock trades at FY15E PER of 21x and P/B of 1.4x (RoE of 8.1%). Stock performance in the near term
would be driven by decision on Mundra UMPP tariff hike, while upside possibilities from there on would be
limited, given lack of growth option, lower return ratios, etc. Neutral.
TVS MOTOR: Above est; Strong 55% YoY growth in exports; scooters grew 19% YoY; Mopeds recovers
with 29% MoM growth
TVS Motor sales were above estimate at 186,313 units (+6% YoY, 17% MoM) v/s est of 179,700.
Scooter portfolio grew by 19% YoY driven by recently launched Jupiter scooter. With launch of Jupiter scooter in
South (4Q) and production ramp-up, management expects scooter run-rate to touch 50,000 units by Mar-14.
TVS is scaling up production capacity to 75,000 units to meet FY15 demand.
Mopeds have recovered strongly with 29% growth MoM (1% YoY v/s YTD decline of 9.3%) driven by Pongal
festival in Southern region.
TVS would showcase two new products (one scooter and another motorcycle) in the upcoming Auto Expo 2014.
The stock trades at 9.8x/7.8x standalone FY15E/16E EPS of INR7.9/10 respectively. Maintain
Buy.
Union Bank 3QFY14: Lower capitalization remains a concern; Stress addition remains high; Trades at
0.4x FY15BV
Union Bank’s 3QFY14 PAT of INR3.5b was 13% above estimate. While NII and PPP were 3% and 7% lower than
estimates, lower provisions (INR6.1b v/s estimate of INR9.2b) led to better than expected PAT. Tax rate came in
higher at 46% vs expectation of 28% led by creation of INR484m on account of DTL.
Net slippages declined QoQ to INR8.9b (remains elevated with net slippage ratio of 1.9%) vs INR12.4b. GNPA (in
absolute terms) increased 9% QoQ. PCR was flat QoQ at 60% and NNPA stood at 2.4% (v/s 2.3% in 2QFY14).
UNBK restructured loan of INR10b (0.5% of loans) of which INR6.4b is to two discoms. OSRL stood at INR110.3b
(4.9% of loans) of which INR34.5b is towards SEB (Ex-SEB OSRL stood at 3.3% of loans).
Other highlights: (1) Loan grew 3% QoQ and 20% YoY, however lower CET I of less than 7% remains a concern
and constraint for future growth, (2) NIM declined 4bp QoQ to 2.5%, (3) fee income for 9MFY14 grew 13% YoY
(14% in 3QFY14) as compared to flat fee income growth in FY13.
Guidance: a) 15-16% loan growth b) restructuring pipeline of INR18b c) plans to sell down loan of INR3b to ARCs
in 4Q.
WIN – Week In a Nutshell
23
Feb 7
th
2014

WEEK IN A NUTSHELL
WEEK IN A NUTSHELL
WHIRLPOOL INDIA 3QFY14: First signs of recovery, albeit on favorable base
Whirlpool India (WHIRL) reported revenue of INR6.73b, up 8.7% YoY helped by lower base. Volumes were flat;
revenue growth was driven by pricing and mix improvement in favor of newer models.
Management highlighted that festive season demand was slightly better during the quarter; however, overall
volume growth still remains weak.
WHIRL has been introducing newer products in the Refrigerator and Washing Machine segments since July 2013
and will roll out its complete range of new products by 1QFY15. New products have a pricing premium of 5-7%
over existing products.
EBITDA margin was 5.5% as compared to 3.6% in 3QFY13 (200bp expansion), largely led by lower other
expenses (down 230bp). Ad spends have not been cut and are running at similar levels as 3QFY13.
PAT was INR213m v/s INR101m in 3QFY13, a growth of 111% YoY.
WHIRL is restructuring its distribution set-up and rationalizing distributor margins (distributor margins are
currently lower than players like Samsung, LG). Management suggested that restructuring would be complete
by October 2014.
WHIRL’s revenue has remained flat for the last three years (FY11-14) due to weakness in the Consumer
Durables industry. However, operating leverage has been impacted resulting in PAT de-growth by 23% from
INR1.66b to INR1.27b over FY11-13.
Net cash as of FY13-end stands at INR1.5b with return ratios of 33% RoCE and 23% RoE. The stock trades at
18.9x FY13 reported earnings. Not Rated.
WIN – Week In a Nutshell
24
Feb 7
th
2014

WEEK IN A NUTSHELL
WEEK IN A NUTSHELL
WIN Collage
Aditya Puri on How India can be the outlier as growth in developed economies ascend and of BRICS
descend
As the stars of developed economies ascend and of BRICS descend, here’s how India can buck the trend
The world economy is changing rapidly. The stars of yesteryear, the BRICS, are down and the stars of the world’s
leading economies are ascending. A simple comparison of GDP growth forecasts for the US, BRICS and India will
underscore this point. In 2006-07 India came within a whisker of double-digit growth and the US was growing at 3%.
In 2014, US is expected to grow at 3% while India would not dare to predict a rate anywhere over 5-5.5%. In short
the growth differential has compressed by a hefty 4 percentage points. The recovery in the developed world might
be led by the US, but others such as Europe and Japan are showing signs of life. So money in the foreseeable future
is likely to move to developed economies. The dollar will strengthen, dollar interest rates will rise and, as a mirror
image, emerging economy stocks and currency will fall and commodity prices should stabilise or rise. Mercifully, the
developed world needs emerging markets to grow, which in turn requires capital, and so some money must come
back. But which emerging markets will manage to attract more capital depends on how quickly they get their
economic act together The pundits are making all sorts of forecasts. Some of them still work on the assumption that
convergence of the rich and the poor world is almost axiomatically inevitable. However, convergence based on
differential growth rates sustaining for the long run can work only if poorer countries work hard to remove supply
shortages, improve human capital and physical capital and not mistake episodes of easy money and asset bubbles
as a sign of affluence.
China’s Slowdown
India has an enormous advantage in the new economic ballgame. The majority of its problems are self-created and
it is in a position to address them. This creates a fantastic opportunity for India to be a positive outlier. But before
getting to a strategy for achieving outlier status, we need to look at things through a larger Asian prism. China is
slowing down sharply and could possibly clock a growth rate of below 7% this year. Rising wages are whittling its
competitive edge and undermining its position as a manufacturing powerhouse. This means that international
investors are likely to look at alternatives like India to relocate manufacturing bases. Thus the potential for
attracting substantially more foreign direct investment is large. How do we achieve this? A lot of the reforms that
are needed to enhance India’s status as an investment destination are low-hanging fruit. Take GST, which is ready
to roll out, if only all the states agree to this and political parties agree on a minor constitutional amendment to
allow states to tax services. The implementation of a new tax dispensation is unambiguously good for growth and
revenue buoyancy. The only thing holding it back is political will and consensus. Despite the much discussed drop in
investment spending, India managed a respectable investment rate (gross fixed capital formation) of 30% of GDP in
2012-13. The rate is unlikely to be much lower this year. What has gone completely awry though is the incremental
capital output ratio (the amount of capital needed to produce a unit of GDP) that has increased from an average of
around 4 in the last decade to over 6 in 2012-13. This drop in the productivity of capital is largely the result of delays
in critical sectors like power and roads. This can be resolved if there is less arbitrariness in decision-making at the
central and state levels
Make Youth Work-Ready
Then there are bigger and more daunting challenges. We cannot just accept a young population as a blessing. To
reap the so-called demographic dividend, we need a healthy, educated and employable population. Expenditure on
health and education has to increase: we need to reach threshold levels that at least our peer economies are
associated with. Public spending on healthcare in India in 2012 was just 3.9% compared with 5.2% in China and
8.9% in Brazil. It can be ramped up if the government cuts back on unnecessary expenditure like non-merit
subsidies. But simply throwing money at a problem does not solve it if the money is not spent efficiently. Progress in
education cannot be measured by the literacy rate or the number of graduates. The target is to make them work-
ready or employable. Studies have shown that of a graduate pool of about 16 million, only 25% are employable. The
focus has to be on skill creation. Industry and government need to work together to ensure this. The remedy is a
combination of increased spending in these critical sectors, enhanced efficiency of spending and greater
collaboration between private and public sectors to find viable solutions. For the government, where does the
WIN – Week In a Nutshell
25
Feb 7
th
2014

WEEK IN A NUTSHELL
WEEK IN A NUTSHELL
money come from in a situation where fiscal consolidation is imperative? The answer is simple: take the subsidy bull
by the horns. Subsidies account for 18% of total expenditure and 49.5% of the total fiscal deficit. The irony is that
instead of addressing this problem, we are compounding it. Take the new food subsidy bill. Even if it subsumes
some of the existing programmes, it would still be a drag on the exchequer. The decision to raise the cap on
subsidised LPG cylinders and de-link it from Aadhaar would also bloat the subsidy bill. This is misdirected
expenditure and we cannot afford it when there are other more justifiable claims on the government. Underpinning
all this is the central issue of accountability that makes government responsible for the outcomes of its actions.
Take the case of the Fiscal Responsibility and Budgetary Management Act (FRBM). While for states there are
penalties for failing to comply with it, the exact penalty for the Centre busting the FRBM limits remains fuzzy. We
need to devise stringent penalties for the Centre, like penal interest rates on government borrowings, when it
breaches borrowing limit. A brief comment on two of the enduring problems of the economy is perhaps in order
here. Agricultural growth might have picked up but it remains highly volatile. Growth is dependent on the area
under cultivation that in turn depends on the monsoon. A technological breakthrough along the lines of the green
revolution is imperative. Higher yielding seeds have to be supported by the delivery of credit, power, water and the
right mix of agriculture.
Glitter Like Gold
Again, despite the fact that the tightest bottlenecks are in non-cereal products, our agricultural policy is resolutely
focused on cereal. The cereal-based food security programme will only buttress that further. We need more
investments in the pipeline for non-cereal items. Another problem is that of gold holdings that erode both investible
financial savings and put a drag on the current account deficit. First, we must accept that there is a sociological
dimension to the Indians’ obsession with the yellow metal and there will always be a core demand for gold.
However, offering instruments that mimic the returns on gold but are not fully backed by gold imports is one way of
bringing the current account pressure under control.
The Only Risk
Finally, we must not confuse the noise of an incredibly diverse democracy in transition with the vibrancy of India.
The recent developments in the political and economic scenario are welcome. We are moving towards
representative democracy, which is transparent and accountable, fiscal prudence and inclusive growth. The recent
elections have served as a wake-up call to old thinking, both economic and political. We are witnessing mind-
boggling change, with all sections of the population seeking to be holier-than-thou in championing performance,
transparency and accountability. We can expect before May a spate of competitive legislation covering Lokpal to
land acquisition, natural resources to FDI. The more noise the electorate makes, the more action that will follow.
Now comes the new election — and a new dawn. The only risk is a fractured mandate that will lead to policy
paralysis and pandering to selfish interest. Barring this, our problems are on the way to resolution.
WHAT NOW FOR INDIA?
In times of extreme risk aversion, the EMs that are considered the weakest and most vulnerable face extreme
pressure. Given the improvement in the current account position, sentiment towards the INR and Indian assets has
improved in the last 3 months. So the INR — one of the main under-performing currencies in its peer group in 2013
— has emerged as the better performing one against its peers in 2014. India needs to move from Block 4 to 5.
WIN – Week In a Nutshell
26
Feb 7
th
2014

WEEK IN A NUTSHELL
WEEK IN A NUTSHELL
Nifty Valuations at a glance
WIN – Week In a Nutshell
27
Feb 7
th
2014