6 March 2014
Update | Sector: Technology
Persistent Systems
BSE Sensex
21,514
S&P CNX
6,401
CMP: INR1,181
TP: INR1,170
Under Review
Traction in IP-led revenues and platforms
EBITDA margins expectation at 25-26%, PES to underperform company
Stock Info
Bloomberg
Equity Shares (m)
52-Week Range (INR)
1, 6, 12 Rel. Per (%)
M.Cap. (INR b)
M.Cap. (USD b)
PSYS IN
40.0
1,220/477
19/96/97
47.3
0.8
IP-led growth to be driven by HPCA; strong potential in rCloud
PES to underperform on long tail of small non-growing customers
Multiple efforts to revive PES growth, fruition may take 12 months
Expect steady EBITDA margins in the range of 25-26%
IP-led growth to be driven by HPCA; strong potential in rCloud
PSYS is confident of growing its IP-led revenues at 20%+ in FY15 without the
addition of any new IPs, driven largely by HPCA, and is also seeing strong scaling
potential rCloud after adding new capabilities.
Financial Snapshot (INR Billion)
Y/E March
2014E 2015E 2016E
Sales
EBITDA
Adj. PAT
Adj. EPS (INR)
EPS Gr. (%)
RoE (%)
RoCE (%)
Payout (%)
P/E (x)
P/BV (x)
16.8
4.4
2.5
63.6
35.6
22.9
16.1
22.0
18.6
3.8
19.5
5.0
3.1
78.4
23.2
23.6
18.6
17.9
15.1
3.2
23.4
6.0
3.9
97.5
24.4
24.2
19.0
16.4
12.1
2.6
PES to underperform on long tail of small non-growing customers
Growth in Product Engineering Services (PES) has been suffering due to a long
customer tail. While the top-clients budgets imply growth above 15% in the
bucket, overall growth may yet be subdued due to growth challenges in the
remainder of the PES business.
Multiple efforts to revive PES growth, fruition may take 12 months
PSYS is looking at client mining approach, and pruning of non-strategic tail in
order to improve quality of revenues and growth prospects in its bread-n-butter
business (60% of revenues in 3QFY14). PSYS expects its focus on Product
Engineering for Enterprise customers to yield results in 12 months time. This
could be a likely fillip to its growth in PES segment, along with mining ISVs.
Shareholding pattern (%)
As on
Dec-13 Sep-13 Dec-12
Promoter
39.0
39.0
39.0
Domestic Inst 14.4
16.8
17.3
Foreign
23.7
20.7
17.4
Others
23.0
23.5
26.3
Expect steady EBITDA margins in the range of 25-26%
Margin headwinds from wage hikes will be partially offset by business mix and
higher utilization. While EBITDA margin in 3QFY14 was 27.7% and may expand
further in 4Q, stable margin outlook going forward is 25-26%.
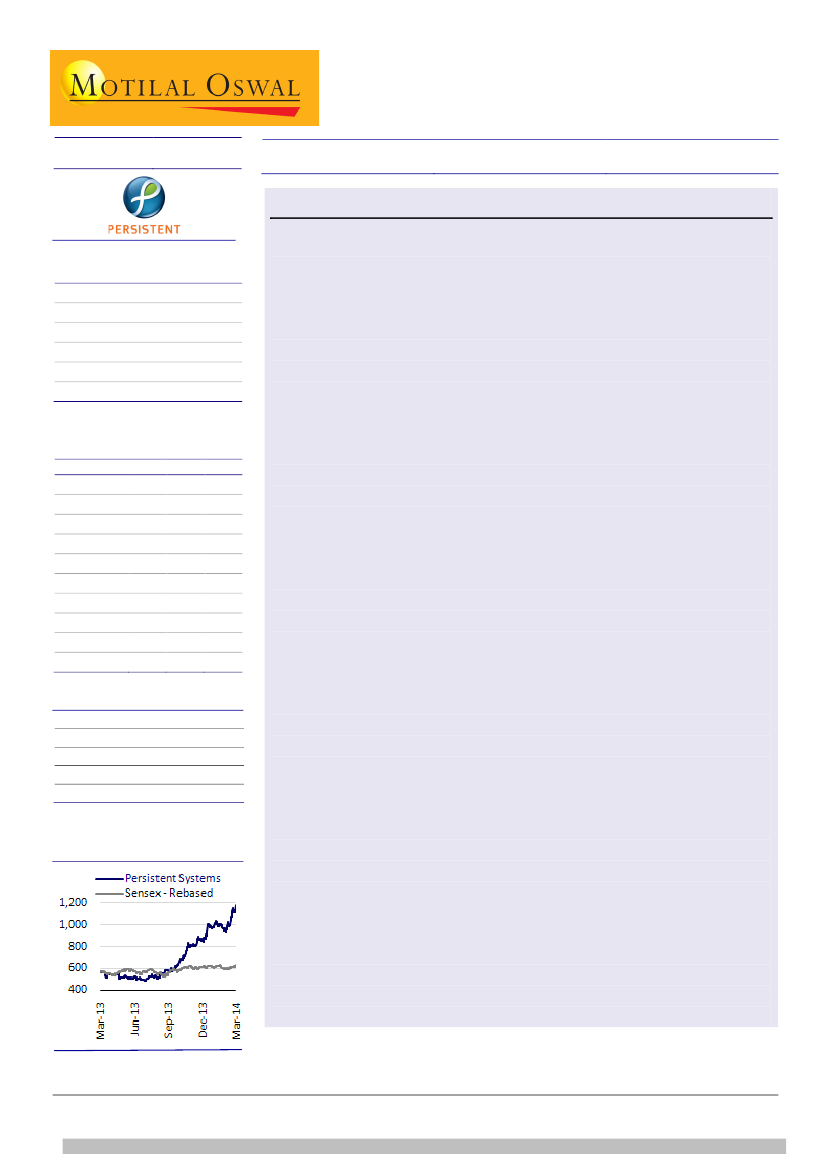
Stock Performance (1-year)
A play on new technologies and scalability
We see PSYS as one of the few companies in the tier-II IT space with the
potential to grow revenues in the range of or above 20%, given its focus on the
fast-growing SMAC business, multi-year relationships with marquee clientele in
the ISV space and unlikelihood of obsolescence in the segment over the
medium-to-long-term. We expect PSYS to grow its USD revenues at a CAGR of
19% and EPS at a CAGR of 24% over FY14-16. Our current target price of
INR1,170 discounts FY16E EPS by 12x, implying 3.5% upside. Our rating for the
stock is
Under Review.
Ashish Chopra
(Ashish.Chopra@MotilalOswal.com); +91 22 3982 5424
Siddharth Vora
(Siddharth.Vora@MotilalOswal.com); +91 22 3982 5585
Investors are advised to refer through disclosures made at the end of the Research Report.

Persistent Systems
Product Engineering for Enterprises will take 12 months before the results
become visible
PSYS articulated its strategy of taking its Product Engineering Services (PES) to
Enterprise Customers, with significant potential in the segment, and inroads to
the accounts provided through its platforms implementations for ISVs. Given
that this is a relatively new segment for the company, PSYS expects it to see
revenue traction going forward in 12 months time.
PSYS currently has been working on the PES segment with Enterprise customers,
which currently contributed ~10% to the overall PES revenues. PES has been
struggling to grow thus far, but the impetus to growth is likely to come from
fruition of the strategy around Enterprise customers.
Mining to be a key focus going forward – de-focusing on the tail
PSYS’ growth in the PES segment has been impacted due to a long tail of non-
growing customer accounts. Nearly half the revenues come from top-10
accounts, and given the visibility around budgets from the same, PSYS will grow
revenues from them by 15-20% even in FY15.
However, product engineering for start-up firms and the middle sized product
companies has seen limited revenue repeatability and as a result faced growth
challenges. As a result, the company is shifting towards looking at mining its
accounts better. Towards that end, it has identified 50 accounts which it will
seek to scale through a two-in-a-box approach, familiarized by Cognizant.
It is also looking at pruning the tail, which has limited potential for scalability
and thereby not strategic to PSYS over the long term. This is likely to keep PES
growth in FY15 between high single digits to low double digits in FY15 as well.
Top clients revenue contribution
Top Client - %
Top-5 clients - %
50
38
37
20
49
35
21
Top-10 clients - %
46
37
47
Overall revenues from top-
10 clients have remained
significant growth
contributor, more so the
top client
44
33
15
11
16
FY10
FY11
FY12
FY13
9MFY14
Source: MOSL, Company
Expect 20-25% growth in IP-led revenues, assuming no new additions to the
list of IPs
IP-led revenues have grown on the back of multiple acquisitions. However,
going forward, growth in the IP-led revenues in FY15 is expected to be 20-25% ,
in the absence of any new IP acquisitions – primarily led by HPCA.
The renewal of HPCA customers has been better than PSYS’ earlier estimates,
and the revenues from HPCA in FY14 started accruing by a quarter’s delay. In
FY15E, as a result of the renewals and delay by a quarter, HPCA revenues should
double, and will be a primary contributor to FY15 IP-led revenues growth.
2
6 March 2014

Persistent Systems
rCloud, the disaster recovery back-up cloud that PSYS acquired from Doyenz,
has had an annual run rate of USD4m. These revenues have thus far been from
small and medium businesses. PSYS has been adding further capabilities to its
rCloud platform, and revenues going forward could also accrue from larger
customers going forward.
IP-led revenues expected to be healthy in FY15
Expect traction in IP-led
revenues to continue in
FY15, even in the absence
of any new IP acquisitions
18
IP-led revenues (USD m)
124
41
49
YoY growth (%)
60
21
21
FY12
FY13
FY14E
FY15E
Source: MOSL, Company
Margins may decline going forward, but PSYS expects to sustain 25-26%
EBITDA margins
EBITDA margin in 3QFY14 was 27.7%, and may expand further in 4Q, which is a
seasonally stronger quarter for IP-led revenues. However, the margins will likely
decline going forward on the back of wage hikes becoming effective.
We expect EBITDA margin at the higher end of 25-26% guided band
EBITDA margins
24.3%
20.4%
25.9%
23.4%
25.9%
25.7%
FY10
FY11
FY12
FY13
FY14E
FY15E
Source: MOSL, Company
However, PSYS sees following levers in action to offset the impact from the
same: [1] Utilization, which could see an improvement going forward, [2]
Business mix skew towards higher margin IP-led revenues.
Given the significant depreciation in the INR, like-to-like pricing is unlikely to
expand, though realization rates could still be higher, driven by the business
mix. PSYS expects EBITDA margins to stabilize between 25-26%.
6 March 2014
3

Persistent Systems
Pricing improvement going forward is more likely to be mix-driven
Billing rates indexed at 100
120
115
110
105
100
95
Onsite
Offshore
Source: Company, MOSL
In the right place at the right time; but see limited upside in the near term
We see PSYS as one of the few companies in the tier-II IT space with the
potential to grow revenues in the range of or above 20%, given its focus on the
fast-growing SMAC business, multi-year relationships with marquee clientele in
the ISV space and unlikelihood of obsolescence in the segment over the
medium-to-long-term.
PES, is ~60% of the company’s revenues (3QFY14) and 9MFY14 revenues have
been flattish YoY. Fruition of client mining and Product Engineering for
Enterprises are two key factors that could potentially revive growth in the
bread-n-butter business for the company. We expect PSYS to grow its USD
revenues at a CAGR of 19% and EPS at a CAGR of 24% over FY14-16. Our current
target price of INR1,170 discounts FY16E EPS by 12x, implying 3.5% upside. Our
rating for the stock is
Under Review.
6 March 2014
4

Persistent Systems
Operating Metrics
1QFY12
Verticals (%)
Telecom & Wireless
Infrastructure & Systems
Life Sciences & Healthcare
Geography (%)
North America
Europe
RoW
Revenue Mix (%)
Services: Onsite
Services: Offshore
IP Led
Client Metrics (%)
Top Client
Top 2-5 Clients
Top 6-10 Clients
Clients billed
Prod. Eng. & Platforms
IP Led
Customer Engagement Size
USD3m+
USD1-3m
Repeat Business
Employee Metrics
Technical People
Sales & BD
Others
Total
Linear Utilization %
Attrition (%)
22.2
67.9
9.9
2QFY12
22
67.4
10.6
3QFY12
20.4
67.1
12.5
4QFY12
21
67.6
11.4
1QFY13
24.2
64.3
11.5
2QFY13
28
62.4
9.6
3QFY13
26.1
63.4
10.5
4QFY13
22.8
66.5
10.7
1QFY14
20.7
69.1
10.2
2QFY14
17.6
69.2
13.2
3QFY14
18
68.9
13.2
82.8
7.4
9.8
82
7.8
10.2
82.9
7.2
9.9
82.4
6.8
10.8
84.4
6.9
8.7
84.6
7.4
8
85.2
6.1
8.8
85.1
5.7
9.2
87.6
4.8
7.6
84.6
4.4
11
83.1
6
10.9
20.7
71.7
7.6
20.6
70.2
9.2
19.9
68.0
12.1
19.3
66.7
13.9
17.6
63.5
18.9
17.0
64.8
18.2
18.8
63.7
17.5
21.2
63.7
15.1
20.6
60.3
19.1
20.5
61.7
17.8
15.1
22.5
10.6
16
22.6
10.8
15.9
21.1
11.3
17.2
19.4
12.2
17.8
15.7
11.8
20.7
15.6
10.7
21.1
16.2
12.1
21.6
15.1
11.2
21.2
15.2
10.9
22.5
15.2
9.5
19.8
17.1
10.3
239
253
273
288
254
76
254
80
264
394
279
418
253
387
243
388
253
380
9
32
97
10
32
92.8
10
27
88.2
11
26
83.9
13
35
90.3
15
32
81.7
14
29
81.4
15
29
78.2
15
30
83
16
32
82.2
16
34
82.7
6178
119
323
6620
72.7
18.4
6469
113
318
6900
73.8
17.7
6288
103
315
6706
74.1
17.4
6223
95
310
6628
71.7
18.3
6132
94
310
6536
74.1
18.9
5956
99
315
6370
75.2
16.9
6287
101
331
6719
77.3
16
6540
99
331
6970
72.5
14.4
6689
119
336
7144
6982
128
347
7457
7109
139
354
7602
70
71.7
72.9
14.2
14
13.2
Source: MOSL, Company
6 March 2014
5

Persistent Systems
Financials and valuation
Income statement
Y/E March
Sales
Change (%)
Cost of Goods Sold
Gross Profit
% of Net Sales
Selling Expenses
EBITDA
% of Net Sales
Depreciation
EBIT
% of Net Sales
Other Income
PBT
Tax
Rate (%)
PAT
Change (%)
2011
7,758
29.1
4,723
3,036
39.1
1,453
1,583
20.4
424
1,159
14.9
344
1,504
108
7.2
1,396
21.3
2012
10,003
28.9
5,910
4,094
40.9
1,757
2,337
23.4
611
1,726
17.3
256
1,981
551
27.8
1,431
2.5
2013
12,945
29.4
7,311
5,634
43.5
2,283
3,352
25.9
783
2,569
19.8
61
2,630
754
28.7
1,876
31.2
2014E
16,804
29.8
9,511
7,293
43.4
2,936
4,357
25.9
1,025
3,332
19.8
198
3,530
985
27.9
2,544
35.6
(INR Million)
2015E
19,535
16.3
11,138
8,398
43.0
3,382
5,015
25.7
1,086
3,930
20.1
425
4,355
1,219
28.0
3,135
23.2
2016E
23,359
19.6
13,404
9,955
42.6
3,913
6,042
25.9
1,157
4,885
20.9
496
5,381
1,480
27.5
3,901
24.4
Balance sheet
Y/E March
Share Capital
Other Reserves
Net Worth
Minority Interest/others
Capital Employed
Gross Block
Less : Depreciation
Net Block
CWIP
Investments
Deferred Tax Assets
Other
Curr. Assets
Debtors
Cash & Bank Balance
Loans & Advances
Other Current Assets
Current Liab. & Prov
Net Current Assets
Application of Funds
3,677
1,582
1,000
869
226
1,602
2,075
7,501
2011
435
7,036
7,471
30
7,501
4,543
2,281
2,261
605
2,500
60
2012
400
8,005
8,405
71
8,483
6,090
2,892
3,197
528
123
107
149
6,040
2,033
3,290
535
182
1,660
4,379
8,483
2013
400
9,783
10,183
639
10,836
6,951
3,449
3,502
1,174
173
190
721
6,969
2,509
3,677
347
434
1,893
5,075
10,836
2014E
400
11,618
12,018
397
12,438
8,806
4,501
4,306
287
412
251
852
9,172
3,683
4,593
368
527
2,842
6,330
12,438
(INR Million)
2015E
400
14,115
14,515
397
14,935
10,206
5,571
4,635
287
412
251
852
11,639
4,282
6,402
428
527
3,141
8,498
2016E
400
17,287
17,687
397
18,107
11,906
6,708
5,199
287
412
251
852
14,666
5,120
8,508
512
527
3,560
11,107
14,935
18,107
E: MOSL Estimates
6 March 2014
6

Persistent Systems
Financials and valuation
Ratios
Y/E March
Diluted (INR)
EPS*
Cash EPS
Book Value
DPS
Payout %
Valuation (x)
P/E after ESOP chg
Cash P/E
EV/EBITDA
EV/Sales
Price/Book Value
Dividend Yield (%)
Profitability Ratios (%)
RoE
RoCE
Turnover Ratios
Debtors (Days)
Asset Turnover (x)
75
3.8
75
3.7
75
3.9
75
4.3
75
4.4
75
4.8
20.1
16.5
18.0
17.5
20.2
14.8
22.9
16.1
23.6
18.6
24.2
19.0
25.2
17.8
12.5
3.2
4.5
0.8
18.6
13.2
9.4
2.4
3.8
1.2
15.1
11.2
7.8
2.0
3.2
1.2
12.1
9.3
6.1
1.6
2.6
1.4
34.1
44.4
192.3
5.5
16.1
35.7
51.0
216.4
6.0
16.8
46.9
66.5
262.1
9.0
19.2
63.6
89.2
309.4
14.0
22.0
78.4
105.5
373.7
14.0
17.9
97.5
126.5
455.3
16.0
16.4
2011
2012
2013
2014E
2015E
2016E
Cash flow statement
Y/E March
CF from Operations
Chg. in Working Capital
Net Operating CF
Net Purchase of FA
Net Purchase of Invest.
Net Cash from Inv.
Issue of shares
Proceeds from LTB/STB
Dividend Payments
Net CF from Finan.
Free Cash Flow
Net Cash Flow
Opening Cash Balance
Closing CashBalance
2011
1,394
-460
935
-971
-939
-1,910
19
0
-255
-235
-37
-1,211
1,279
1,000
2012
1,526
27
1,553
-1,470
2,378
908
38
7
-274
-230
83
2,230
1,809
3,290
2013
2,778
260
3,038
-1,735
-50
-1,785
128
8
-407
-272
1,304
982
3,099
3,677
2014E
3,372
-582
2,790
-941
-239
-1,180
-71
9
-638
-700
1,849
910
2,988
4,593
(INR Million)
2015E
3,796
-359
3,437
-1,415
0
-1,415
443
0
-638
-195
2,022
1,826
3,862
2016E
4,562
-503
4,060
-1,721
0
-1,721
979
0
-638
341
2,339
2,679
4,556
6,402
8,508
E: MOSL Estimates
6 March 2014
7

Disclosures
This report is for personal information of the authorized recipient and does not construe to be any investment, legal or taxation advice to you. This research report does not constitute an offer, invitation or
inducement to invest in securities or other investments and Motilal Oswal Securities Limited (hereinafter referred as MOSt) is not soliciting any action based upon it. This report is not for public distribution
and has been furnished to you solely for your information and should not be reproduced or redistributed to any other person in any form.
Unauthorized disclosure, use, dissemination or copying (either whole or partial) of this information, is prohibited. The person accessing this information specifically agrees to exempt MOSt or any of its
affiliates or employees from, any and all responsibility/liability arising from such misuse and agrees not to hold MOSt or any of its affiliates or employees responsible for any such misuse and further agrees
to hold MOSt or any of its affiliates or employees free and harmless from all losses, costs, damages, expenses that may be suffered by the person accessing this information due to any errors and delays.
The information contained herein is based on publicly available data or other sources believed to be reliable. While we would endeavour to update the information herein on reasonable basis, MOSt and/or
its affiliates are under no obligation to update the information. Also there may be regulatory, compliance, or other reasons that may prevent MOSt and/or its affiliates from doing so. MOSt or any of its
affiliates or employees shall not be in any way responsible and liable for any loss or damage that may arise to any person from any inadvertent error in the information contained in this report. MOSt or any
of its affiliates or employees do not provide, at any time, any express or implied warranty of any kind, regarding any matter pertaining to this report, including without limitation the implied warranties of
merchantability, fitness for a particular purpose, and non-infringement. The recipients of this report should rely on their own investigations.
Persistent Systems
This report is intended for distribution to institutional investors. Recipients who are not institutional investors should seek advice of their independent financial advisor prior to taking any investment decision
based on this report or for any necessary explanation of its contents.
MOSt and/or its affiliates and/or employees may have interests/positions, financial or otherwise in the securities mentioned in this report. To enhance transparency, MOSt has incorporated a Disclosure of
Interest Statement in this document. This should, however, not be treated as endorsement of the views expressed in the report.
Disclosure of Interest Statement
1. Analyst ownership of the stock
2. Group/Directors ownership of the stock
3. Broking relationship with company covered
4. Investment Banking relationship with company covered
PERSISTENT SYSTEMS LTD
No
No
No
No
Analyst Certification
The views expressed in this research report accurately reflect the personal views of the analyst(s) about the subject securities or issues, and no part of the compensation of the research analyst(s) was, is,
or will be directly or indirectly related to the specific recommendations and views expressed by research analyst(s) in this report. The research analysts, strategists, or research associates principally
responsible for preparation of MOSt research receive compensation based upon various factors, including quality of research, investor client feedback, stock picking, competitive factors and firm revenues.
This report is not directed or intended for distribution to or use by any person or entity resident in a state, country or any jurisdiction, where such distribution, publication, availability or use would be contrary
to law, regulation or which would subject MOSt & its group companies to registration or licensing requirements within such jurisdictions.
Regional Disclosures (outside India)
This report is intended for distribution only to persons having professional experience in matters relating to investments as described in Article 19 of the Financial Services and Markets Act 2000 (Financial
Promotion) Order 2005 (referred to as "investment professionals"). This document must not be acted on or relied on by persons who are not investment professionals. Any investment or investment activity
to which this document relates is only available to investment professionals and will be engaged in only with such persons.
For U.K.
Motilal Oswal Securities Limited (MOSL) is not a registered broker - dealer under the U.S. Securities Exchange Act of 1934, as amended (the"1934 act") and under applicable state laws in the United
States. In addition MOSL is not a registered investment adviser under the U.S. Investment Advisers Act of 1940, as amended (the "Advisers Act" and together with the 1934 Act, the "Acts), and under
applicable state laws in the United States. Accordingly, in the absence of specific exemption under the Acts, any brokerage and investment services provided by MOSL, including the products and services
described herein are not available to or intended for U.S. persons.
This report is intended for distribution only to "Major Institutional Investors" as defined by Rule 15a-6(b)(4) of the Exchange Act and interpretations thereof by SEC (henceforth referred to as "major
institutional investors"). This document must not be acted on or relied on by persons who are not major institutional investors. Any investment or investment activity to which this document relates is only
available to major institutional investors and will be engaged in only with major institutional investors. In reliance on the exemption from registration provided by Rule 15a-6 of the U.S. Securities Exchange
Act of 1934, as amended (the "Exchange Act") and interpretations thereof by the U.S. Securities and Exchange Commission ("SEC") in order to conduct business with Institutional Investors based in the
U.S., MOSL has entered into a chaperoning agreement with a U.S. registered broker-dealer, Motilal Oswal Securities International Private Limited. ("MOSIPL"). Any business interaction pursuant to this
report will have to be executed within the provisions of this chaperoning agreement.
The Research Analysts contributing to the report may not be registered /qualified as research analyst with FINRA. Such research analyst may not be associated persons of the U.S. registered broker-
dealer, MOSIPL, and therefore, may not be subject to NASD rule 2711 and NYSE Rule 472 restrictions on communication with a subject company, public appearances and trading securities held by a
research analyst account.
For U.S.
Motilal Oswal Capital Markets Singapore Pte Limited is acting as an exempt financial advisor under section 23(1)(f) of the Financial Advisers Act(FAA) read with regulation 17(1)(d) of the Financial
Advisors Regulations and is a subsidiary of Motilal Oswal Securities Limited in India. This research is distributed in Singapore by Motilal Oswal Capital Markets Singapore Pte Limited and it is only directed
in Singapore to accredited investors, as defined in the Financial Advisers Regulations and the Securities and Futures Act (Chapter 289), as amended from time to time.
In respect of any matter arising from or in connection with the research you could contact the following representatives of Motilal Oswal Capital Markets Singapore Pte Limited:
Anosh Koppikar
Kadambari Balachandran
Email:anosh.Koppikar@motilaloswal.com
Email : kadambari.balachandran@motilaloswal.com
Contact(+65)68189232
Contact: (+65) 68189233 / 65249115
Office Address:21 (Suite 31),16 Collyer Quay,Singapore 04931
For Singapore
Motilal Oswal Securities Ltd
6 March 2014
Motilal Oswal Tower, Level 9, Sayani Road, Prabhadevi, Mumbai 400 025
Phone: +91 22 3982 5500 E-mail: reports@motilaloswal.com
8