6 March 2014
Update | Sector: Technology
KPIT Technologies
BSE Sensex
21,514
S&P CNX
6,401
CMP: INR166
TP: INR220
Buy
SAP could grow in double digits, drive EBITDA
Auto Engineering Services to be key growth driver
Stock Info
Bloomberg
Equity Shares (m)
52-Week Range (INR)
1, 6, 12 Rel. Per (%)
M.Cap. (INR b)
M.Cap. (USD b)
KPIT IN
194.0
189/92
-3/14/46
32.2
0.5
SAP turnaround will drive revenue acceleration in FY15 (13.3% USD revenue
growth estimate YoY).
Auto Engineering Services (24% of revenues) is a key driver of long term growth.
Revenue acceleration, EBITDA margin expansion (170bp YoY estimate) and
discontinuation of lower hedge rate forex losses drive are estimate of 32% EPS
growth in FY15.
Expect FCF to improve owing to limited likelihood of big-ticket acquisitions,
completion of earn-out payments.
Financial Snapshot (INR Billion)
Y/E March
2014E 2015E 2016E
Sales
EBITDA
PAT
EPS (INR)
EPS Gr. (%)
RoE (%)
RoCE (%)
P/E (x)
P/BV (x)
EV/EBITDA (x)
27.1
4.3
2.5
12.8
21.8
21.9
27.9
12.9
2.6
6.9
30.8
5.4
3.4
17.0
32.1
23.5
29.9
9.8
2.1
4.8
34.7
6.1
3.9
19.7
16.4
21.8
27.5
8.4
1.7
3.6
Turnaround in SAP to drive growth acceleration in FY15
9MFY14 revenues in SAP have declined 13% YoY. However, on the back of deal
signings, SAP should return to growth in FY15 and despite a weak exit, and USD
revenue growth in SAP could be in double digits. This drives our expectation of
13.3% YoY growth in FY15E USD revenues v/s 8.6% in FY14E.
Auto Engineering is a key driver of long term growth, IES seeing traction
Auto Engineering Services (24% of revenues) is likely to be a key growth driver
for the company (among fastest growing segments for the industry in FY14 as
per NASSCOM). The segment is KPIT’s core business and it expects revenues
from Auto Engineering to exceed 30% of the company’s revenues in the next 3
years, as the company scales to USD1b in revenues. IES should continue its
strong growth trend driven by JD Edwards. Growth prospects in JD Edwards are
sanguine for at least another couple of years. Despite continued challenge in
top account, growth in FY15 should be at least in line with industry.
Shareholding pattern (%)
As on
Dec-13 Sep-13 Dec-12
Promoter
22.5
22.9
24.3
Dom. Inst
7.0
11.1
10.7
Foreign
51.6
48.0
43.6
Others
18.9
18.0
21.3
Expect 32% earnings growth in FY15
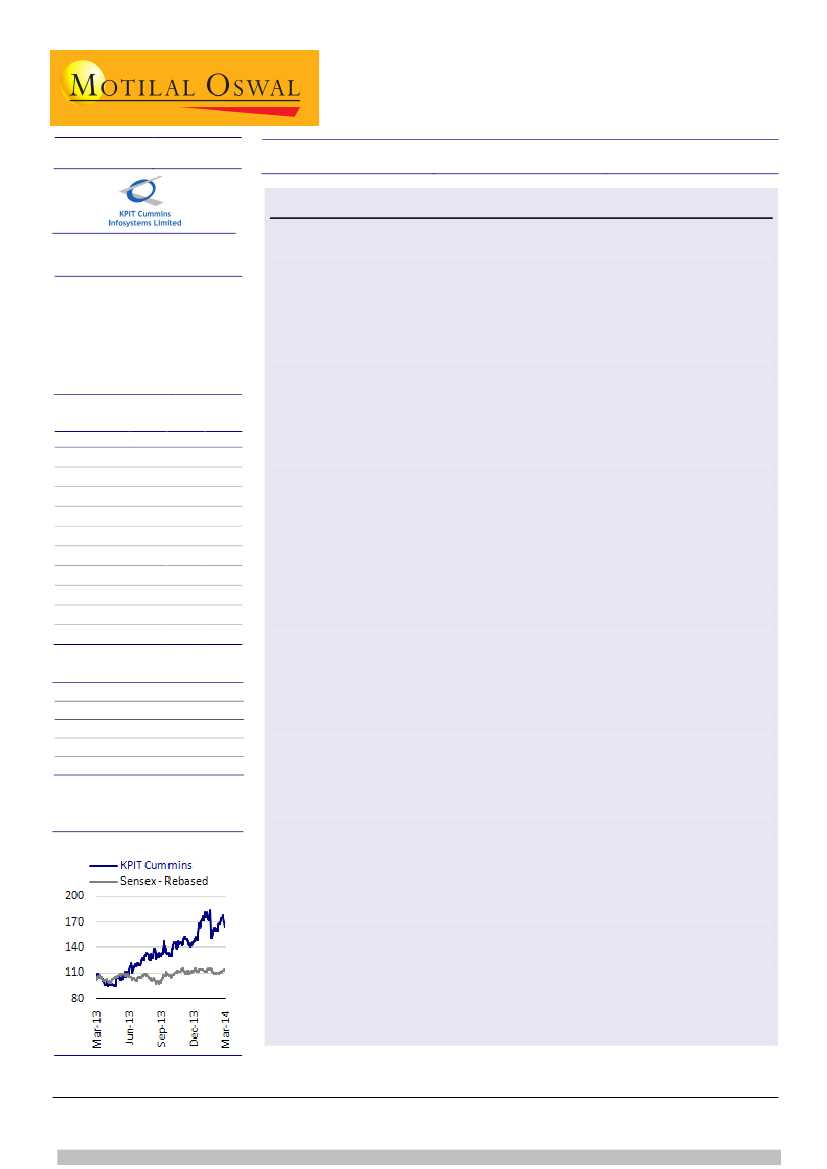
Stock Performance (1-year)
Revival in SAP growth in FY15 will propel the segment’s margins to positive mid
single digits from -4% to -5% as on 9MFY14, which will be a ~200bp margin
tailwind to overall company margins. We expect EBITDA margin to expand
170bp YoY to 17.5% in FY15. That, in combination with discontinuation of forex
losses of the magnitude in current year drive our expectation of 32% YoY
growth in FY15 earnings.
FCF likely to improve going forward, valuations limit risk
Given limited likelihood of any big ticket acquisition going forward, we expect
Free cash flow generation to improve for KPIT. Maintain
Buy,
with a price target
of INR220, which discounts FY16E EPS by 11x.
Ashish Chopra
(Ashish.Chopra@MotilalOswal.com); +91 22 3982 5424
Siddharth Vora
(Siddharth.Vora@MotilalOswal.com); +91 22 3982 5585
Investors are advised to refer through disclosures made at the end of the Research Report.

KPIT Technologies
SAP to turnaround in 4Q and carry momentum in FY15; focus on improving
SAP margins
Revenues from SAP were USD120.6m for KPIT in FY13, against which, 9MFY14
revenues stand at USD75m. The company expects SAP to turnaround in 4QFY14,
with significant growth, and carry the momentum into FY15 too, on the back of
ramp-ups in deal signings. Growth in SAP revenues could be in double digits next
year.
The decline in SAP revenues have also hurt the margins from the segment,
which is currently making losses at around 4-5%. Returning SAP to profitability is
a key focus area for KPIT going forward in FY15. Utilization in SAP has declined
to below 90% at onsite and well below 70% at offshore. This is expected to inch
up in FY15. Apart from utilization and growth, there are other rationalization
measures that will be exercised by the company. KPIT expects to exit next year
with high single digit margins and full year average of mid-single digits in FY15.
Expect growth in SAP to revive in FY15
Source: MOSL, Company
Lack of discretionary spending hurting Cummins account
Revenues from Cummins are likely to be flattish in FY14. Even in FY15, the KPIT
does not expect any significant growth and the revenues should remain range-
bound, primarily due to the fact that discretionary spending in the account has
been soft, with focus still on cost optimization.
However, KPIT still expects Cummins to be a USD100m account in the future,
and the incremental revenue opportunity should be led by upgrades in Oracle
platform once the company engages in discretionary spending. KPIT also sees
Cummins as a buyer of some of its new services like Analytics, which are
potential growth avenues within the account, but unlikely to drive growth in
FY15.
6 March 2014
2

KPIT Technologies
Cummins revenues are likely to remain range-bound in FY15 too, amid weak discretionary
spending
Top Client - Cummins
Growth (YoY %)
29.7
9.5
-27.4
64.1
FY09
46.5
FY10
51.0
FY11
66.1
FY12
77.8
FY13
78.0
FY14E
17.7
0.2
Source: MOSL, Company
Auto Engineering will be a key growth driver; healthy growth outlook in JD
Edwards for another couple of years
Automotive Engineering, which is 25% of the company’s business, is seeing
exports growth above the industry rates, driven by demand for services around
safety systems, intelligent driving, hybrid electric cars, fuel efficiency etc. The
exports in this segment as per NASSCOM are expected to grow 20.3% YoY to
USD1.62b, up from USD1.34b in FY13.
The segment is KPIT’s core business and it expects revenues from Auto
Engineering to exceed 30% of the company’s revenues, in the next 3 years, as
KPIT scales to USD1b in revenues. KPIT sees the segment potentially
contributing ~50% of the incremental revenues going forward.
Auto Engineering will be a key growth driver going forward
Auto Engineering Revenues (USD m)
Growth (YoY %)
34.6
79.6
59.1
99.0
24.4
80.6
10.9
FY11
FY12
FY13
9MFY14
Source: MOSL, Company
The Integrated Enterprise Services (IES) segment, which primarily derives
revenues from Oracle and JD Edwards (40.5% of revenues in 3QFY14) too, is
expected to continue growing well (26% growth in 9MFY14). Healthy FY14
growth is despite challenge in revenues from Oracle in the top account. JD
Edwards, the segment that scaled following KPIT’s acquisition of Systime, is
witnessing healthy growth prospects at least over the next couple of years.
6 March 2014
3

KPIT Technologies
Excluding Oracle revenues from Cummins, IES growth should remain strong
IES Revenues (USD m)
Growth (YoY %)
45.6
25.9
16.5
84.5
FY11
123.0
FY12
143.2
FY13
131.7
9MFY14
Source: MOSL, Company
Given the traction in Auto Engineering and IES, KPIT is expected to grow at least
in line with the industry in FY15, despite softness in the top account.
Better margins, lower hedge losses – expect healthy earnings growth in
FY15
KPIT’s 9MFY14 EBITDA margin at 15.6% includes -4 to -5% margin in SAP, which
is 24% of revenues. Revival in SAP growth in FY15 will propel its margins to
positive mid single digits, which will be a ~200bp margin tailwind at the overall
company level. We expect EBITDA margin to expand 170bp YoY to 17.5% in
FY15.
While there are other levers that will also drive further improvement in margins
in FY15, we expect offsets to the same coming from wage hikes and the
company’s investments in the front end.
Revenue acceleration and higher OPM in FY15 will get further compounded by
discontinuation of forex losses from lower-rate hedges in FY15. This drives our
assumption of 32% YoY PAT growth in FY15.
Expect revival in SAP growth to drive uptick in FY15 EBITDA margin
EBITDA Margin
23.1
22.1
17.5
15.0
16.3
13.9
15.8
FY09
FY10
FY11
FY12
FY13
FY14E
FY15E
Source: MOSL, Company
6 March 2014
4

KPIT Technologies
Auto Engineering niche to drive scale, FCF likely to improve
KPIT remains focused on select verticals, evidenced as the company added
strong ERP capabilities to its Engineering prowess by acquisitions of CPG, Sparta
and Systime. Going forward, it is looking to expand to new-age services like
Analytics, PLM and even IMS. Its focus on Auto engineering services should also
serve it well in its quest to expand to USD1b in revenues in a few years time.
While growth in FY15 should be at least in line with industry and significant beat
may be challenged by a weak exit and challenges in top account, growth reset in
Cummins will compound to the remaining business and facilitate reversion to
high organic growth for the company,
KPIT trades at 10x FY15E and 8.6x FY16E EPS. We expect the company to grow
its USD revenues at a CAGR of 14% over FY14-16E and EPS at a CAGR of 24%
during this period. Also, given limited likelihood of any big ticket acquisition
going forward, we expect Free cash flow generation to improve going forward.
Maintain
Buy,
with a price target of INR220, which discounts FY16E EPS by 11x.
6 March 2014
5

KPIT Technologies
Operating Metrics
Jun-11
Geography Analysis (%)
USA
Europe
ROW
LOB Analysis (%)
IES
Auto & Engg
SAP
BTU
Customer Details
Customers Added
Active Customers
USD1m+ Clients
Top Customer - Cummins (%)
Top 5 Customers (%)
Top 10 Customer (%)
Revenue Split (%)
Onsite
Offshore
Contract Type (%)
T&M
FP
Debtor Days
HR - Details
Development Team:
Onsite (Avg)
Offshore (Avg)
Onsite FTE
Offshore FTE
Total FTE
Development
Support Staff
Marketing
Total
Utiliization(%)
Onsite
Offshore (Incl. Trainees)
64.2
21.0
14.8
Sep-11
68.1
20.1
11.8
Dec-11
70.5
19.0
10.5
Mar-12
73.3
14.4
12.3
Jun-12
76.2
13.7
10.1
Sep-12
76.6
12.6
10.9
Dec-12
75.1
13.6
11.3
Mar-13
75.1
12.8
12.1
Jun-13
75.0
13.1
11.9
Sep-13
71.9
13.8
14.5
Dec-13
72.7
15.4
12.0
41.9
26.5
29.2
2.5
38.5
27.6
30.6
3.3
36.5
27.5
33.4
2.6
42.6
22.9
32.4
2.1
32.9
23.7
33.3
10.1
34.3
24.4
31.0
10.3
35.6
23.4
29.2
11.9
36.7
25.0
27.2
11.1
39.5
23.6
26.0
10.8
39.5
24.2
25.3
11.0
40.5
25.3
23.7
10.6
4.0
159.0
48.0
20.7
38.0
49.3
4.0
163.0
51.0
22.6
38.9
48.1
2.0
165.0
54.0
23.9
37.4
47.1
4.0
169.0
59.0
19.5
33.0
42.2
3.0
172.0
65.0
20.6
36.3
44.0
4.0
176.0
69.0
19.7
35.2
43.7
2.0
178.0
72.0
19.1
36.8
45.2
5.0
183.0
78.0
16.6
35.2
44.0
6.0
189.0
78.0
16.8
38.6
47.3
3.0
192.0
78.0
16.5
38.0
46.3
3.0
195.0
78.0
17.9
38.2
47.6
44.2
55.9
47.0
53.1
47.8
52.2
51.5
48.5
52.7
47.3
53.8
46.2
54.7
45.3
53.8
46.2
54.2
45.8
54.6
45.4
52.8
47.2
68.4
31.6
71
71.7
28.3
66
74.2
25.8
68
73.6
26.5
76
72.0
28.1
75
72.7
27.3
75
70.1
29.9
70
72.7
27.3
75
76.9
23.2
77
76.4
23.6
75
75.6
24.4
76
729
5,326
661
3,794
4,455
6,063
416
105
6,584
90.7
71.2
757
5,297
691
3,857
4,548
6,018
418
108
6,544
91.3
72.8
792
5,328
717
3,829
4,546
6,178
421
108
6,707
90.6
71.9
964
5,914
911
4,393
5,304
7,071
526
122
7,719
94.5
74.3
1,031
6,074
977
4,501
5,478
7,218
530
125
7,873
94.7
74.1
1,126
6,207
1,064
4,638
5,702
7,447
536
128
8,111
94.5
74.7
1,148
6,364
1,066
4,637
5,703
7,616
538
132
8,286
92.8
72.9
1,139
6,486
1,074
4,805
5,879
7,648
538
135
8,321
94.3
74.1
1,176
6,553
1,107
4,809
5,916
7,771
545
140
8,456
1,243
6,708
1,148
4,888
6,036
8,122
548
146
8,816
1,274
6,987
1,123
4,985
6,108
8,430
554
152
9,136
94.2
92.4
88.1
73.4
72.9
71.3
Source: MOSL, Company
6 March 2014
6

KPIT Technologies
Financials and valuation
Income statement
Y/E March
Sales
Change (%)
Cost of Services
SG&A Expenses
EBITDA
% of Net Sales
Depreciation
Interest
Other Income
PBT
Tax
Rate (%)
Minority Interest
PAT
Extraordinary
Net Income
Change (%)
FY11
10,120
38.3
6,492
2,106
1,522
15.0
411.3
25.9
17.6
1,103
155
14.0
-
948
-
948
10.5
FY12
14,897
47.2
9,934
2,885
2,078
13.9
444.9
78.1
128.0
1,683
437
25.9
(31.5)
1,215
-
1,215
28.2
FY13
22,386
50.3
14,640
4,096
3,650
16.3
466.1
153.9
(169.7)
2,860
766
26.8
(86.1)
2,009
-
2,009
65.3
FY14E
27,070
20.9
18,122
4,678
4,270
15.8
547.3
282.2
83.0
3,524
977
27.7
-
2,547
-
2,547
26.8
(INR Million)
FY15E
30,817
13.8
19,990
5,447
5,380
17.5
621.2
260.9
149.7
4,647
1,278
27.5
-
3,369
-
3,369
32.3
FY16E
34,689
12.6
22,554
6,044
6,091
17.6
702.4
260.9
244.4
5,372
1,450
27.0
-
3,921
-
3,921
16.4
Balance sheet
Y/E March
Share Capital
Reserves
Net Worth
Minority Interest
Loan & long term liabilities
Capital Employed
Fixed Assets
Other LT assets
Curr. Assets
Debtors
Cash & Bank Balance
Loans & Advances
Current Liab. & Prov
Net Current Assets
Application of Funds
FY11
340
5,692
6,032
63.7
1,105
7,201
1,581
1,300
5,719
2,525
2,096
1,097
1,875
3,844
7,201
FY12
356
6,769
7,125
333.7
1,189
8,649
1,853
4,527
6,983
4,380
1,838
766
4,714
2,269
8,649
FY13
386
10,178
10,564
270.2
1,602
12,437
2,005
5,797
10,047
4,673
3,957
1,417
5,411
4,635
12,437
FY14E
368
12,305
12,673
-
1,556
14,229
2,083
7,112
9,905
5,470
2,872
1,563
6,642
3,262
14,229
(INR Million)
FY15E
368
15,674
16,043
-
1,556
17,599
2,162
7,112
14,105
6,219
6,109
1,777
7,552
6,553
FY16E
368
19,596
19,964
-
1,556
21,520
2,159
7,112
18,941
6,971
9,979
1,992
8,464
10,477
17,599
21,520
E: MOSL Estimates
6 March 2014
7

KPIT Technologies
Financials and valuation
Ratios
Y/E March
Basic (INR)
EPS
Cash EPS
Book Value
DPS
Payout %
Valuation (x)
P/E
Cash P/E
EV/EBITDA
EV/Sales
Price/Book Value
Dividend Yield (%)
Profitability Ratios (%)
RoE
RoCE
Turnover Ratios
Debtors (Days)
Fixed Asset Turnover (x)
91
6.5
107
8.8
76
11.5
74
13.3
74
14.6
73
16.2
19.1
18.2
18.5
20.6
22.7
30.2
21.9
27.9
23.5
29.9
21.8
27.5
21.2
18.7
14.2
2.0
4.3
0.4
15.8
13.3
8.1
1.3
3.1
0.6
12.9
10.7
6.9
1.1
2.6
0.6
9.8
8.3
4.8
0.8
2.1
0.9
8.4
7.1
3.6
0.6
1.7
0.9
5.7
7.7
34.4
0.7
12.3
8.0
9.1
39.0
0.7
8.7
10.6
12.5
53.3
1.0
9.5
12.8
15.6
63.8
1.0
7.8
17.0
20.1
80.8
1.5
8.8
19.7
23.3
100.5
1.5
7.6
FY11
FY12
FY13
FY14E
FY15E
FY16E
Cash flow statement
Y/E March
CF from Operations
Cash for Working Capital
Net Operating CF
Net Purchase of FA
Net Purchase of Invest.
Net Cash from Invest.
Proc. from equity issues
Proceeds from LTB/STB
Dividend Payments
Cash Flow from Fin.
Net Cash Flow
Opening Cash Bal.
Add: Net Cash
Closing Cash Bal.
FY11
1,217
-574
643
-882
207
-675
1,203
-96
-64
1,043
1,011
1,052
1,011
2,096
FY12
1,874
-870
1,005
-3,002
174
-2,828
65
1,091
-72
1,084
-739
2,096
-739
1,838
FY13
2,366
-246
2,119
-623
121
-503
0
195
0
195
1,812
1,838
1,812
3,957
FY14E
3,277
287
3,564
-472
266
-207
0
-598
0
-598
2,759
3,957
2,759
2,872
(INR Million)
FY15E
4,252
-53
4,198
-700
0
-700
0
-261
0
-261
3,237
2,872
3,237
FY16E
4,885
-54
4,831
-700
0
-700
0
-261
0
-261
3,870
6,109
3,870
6,109
9,979
E: MOSL Estimates
6 March 2014
8

KPIT Technologies
NOTES
6 March 2014
9

Disclosures
This report is for personal information of the authorized recipient and does not construe to be any investment, legal or taxation advice to you. This research report does not constitute an offer, invitation or
inducement to invest in securities or other investments and Motilal Oswal Securities Limited (hereinafter referred as MOSt) is not soliciting any action based upon it. This report is not for public distribution
and has been furnished to you solely for your information and should not be reproduced or redistributed to any other person in any form.
Unauthorized disclosure, use, dissemination or copying (either whole or partial) of this information, is prohibited. The person accessing this information specifically agrees to exempt MOSt or any of its
affiliates or employees from, any and all responsibility/liability arising from such misuse and agrees not to hold MOSt or any of its affiliates or employees responsible for any such misuse and further agrees
to hold MOSt or any of its affiliates or employees free and harmless from all losses, costs, damages, expenses that may be suffered by the person accessing this information due to any errors and delays.
The information contained herein is based on publicly available data or other sources believed to be reliable. While we would endeavour to update the information herein on reasonable basis, MOSt and/or
its affiliates are under no obligation to update the information. Also there may be regulatory, compliance, or other reasons that may prevent MOSt and/or its affiliates from doing so. MOSt or any of its
affiliates or employees shall not be in any way responsible and liable for any loss or damage that may arise to any person from any inadvertent error in the information contained in this report. MOSt or any
of its affiliates or employees do not provide, at any time, any express or implied warranty of any kind, regarding any matter pertaining to this report, including without limitation the implied warranties of
merchantability, fitness for a particular purpose, and non-infringement. The recipients of this report should rely on their own investigations.
KPIT Technologies
This report is intended for distribution to institutional investors. Recipients who are not institutional investors should seek advice of their independent financial advisor prior to taking any investment decision
based on this report or for any necessary explanation of its contents.
MOSt and/or its affiliates and/or employees may have interests/positions, financial or otherwise in the securities mentioned in this report. To enhance transparency, MOSt has incorporated a Disclosure of
Interest Statement in this document. This should, however, not be treated as endorsement of the views expressed in the report.
Disclosure of Interest Statement
1. Analyst ownership of the stock
2. Group/Directors ownership of the stock
3. Broking relationship with company covered
4. Investment Banking relationship with company covered
KPIT TECHNOLOGIES LTD
No
No
No
No
Analyst Certification
The views expressed in this research report accurately reflect the personal views of the analyst(s) about the subject securities or issues, and no part of the compensation of the research analyst(s) was, is,
or will be directly or indirectly related to the specific recommendations and views expressed by research analyst(s) in this report. The research analysts, strategists, or research associates principally
responsible for preparation of MOSt research receive compensation based upon various factors, including quality of research, investor client feedback, stock picking, competitive factors and firm revenues.
This report is not directed or intended for distribution to or use by any person or entity resident in a state, country or any jurisdiction, where such distribution, publication, availability or use would be contrary
to law, regulation or which would subject MOSt & its group companies to registration or licensing requirements within such jurisdictions.
Regional Disclosures (outside India)
This report is intended for distribution only to persons having professional experience in matters relating to investments as described in Article 19 of the Financial Services and Markets Act 2000 (Financial
Promotion) Order 2005 (referred to as "investment professionals"). This document must not be acted on or relied on by persons who are not investment professionals. Any investment or investment activity
to which this document relates is only available to investment professionals and will be engaged in only with such persons.
For U.K.
Motilal Oswal Securities Limited (MOSL) is not a registered broker - dealer under the U.S. Securities Exchange Act of 1934, as amended (the"1934 act") and under applicable state laws in the United
States. In addition MOSL is not a registered investment adviser under the U.S. Investment Advisers Act of 1940, as amended (the "Advisers Act" and together with the 1934 Act, the "Acts), and under
applicable state laws in the United States. Accordingly, in the absence of specific exemption under the Acts, any brokerage and investment services provided by MOSL, including the products and services
described herein are not available to or intended for U.S. persons.
This report is intended for distribution only to "Major Institutional Investors" as defined by Rule 15a-6(b)(4) of the Exchange Act and interpretations thereof by SEC (henceforth referred to as "major
institutional investors"). This document must not be acted on or relied on by persons who are not major institutional investors. Any investment or investment activity to which this document relates is only
available to major institutional investors and will be engaged in only with major institutional investors. In reliance on the exemption from registration provided by Rule 15a-6 of the U.S. Securities Exchange
Act of 1934, as amended (the "Exchange Act") and interpretations thereof by the U.S. Securities and Exchange Commission ("SEC") in order to conduct business with Institutional Investors based in the
U.S., MOSL has entered into a chaperoning agreement with a U.S. registered broker-dealer, Motilal Oswal Securities International Private Limited. ("MOSIPL"). Any business interaction pursuant to this
report will have to be executed within the provisions of this chaperoning agreement.
The Research Analysts contributing to the report may not be registered /qualified as research analyst with FINRA. Such research analyst may not be associated persons of the U.S. registered broker-
dealer, MOSIPL, and therefore, may not be subject to NASD rule 2711 and NYSE Rule 472 restrictions on communication with a subject company, public appearances and trading securities held by a
research analyst account.
For U.S.
Motilal Oswal Capital Markets Singapore Pte Limited is acting as an exempt financial advisor under section 23(1)(f) of the Financial Advisers Act(FAA) read with regulation 17(1)(d) of the Financial
Advisors Regulations and is a subsidiary of Motilal Oswal Securities Limited in India. This research is distributed in Singapore by Motilal Oswal Capital Markets Singapore Pte Limited and it is only directed
in Singapore to accredited investors, as defined in the Financial Advisers Regulations and the Securities and Futures Act (Chapter 289), as amended from time to time.
In respect of any matter arising from or in connection with the research you could contact the following representatives of Motilal Oswal Capital Markets Singapore Pte Limited:
Anosh Koppikar
Kadambari Balachandran
Email:anosh.Koppikar@motilaloswal.com
Email : kadambari.balachandran@motilaloswal.com
Contact(+65)68189232
Contact: (+65) 68189233 / 65249115
Office Address:21 (Suite 31),16 Collyer Quay,Singapore 04931
For Singapore
Motilal Oswal Securities Ltd
6 March 2014
Motilal Oswal Tower, Level 9, Sayani Road, Prabhadevi, Mumbai 400 025
Phone: +91 22 3982 5500 E-mail: reports@motilaloswal.com
10