18 March 2014
Update | Sector: Automobiles
TVS Motor
BSE Sensex
21,810
S&P CNX
6,504
CMP: INR87
TP: INR120
Buy
Signs of recovery in 2Ws; Share of Scooters rising
Stock Info
Bloomberg
Equity Shares (m)
52-Week Range (INR)
1, 6, 12 Rel. Per (%)
M.Cap. (INR b)
M.Cap. (USD b)
TVSL gaining share in Scooters; South recovery augurs well
TVSL IN
475.1
90/28
-2/159/123
41.0
0.7
Financial Snapshot (INR Million)
Y/E March
2014E 2015E 2016E
Net Sales
80,007 96,330110,661
EBITDA
Adj PAT
EPS (INR)
Growth (%)
BV/Sh (INR)
RoE (%)
RoCE (%)
P/E (x)
P/BV (x)
4,720 6,117
2,861 3,765
5.5
45.5
30.0
19.9
20.1
15.6
2.9
7.9
42.9
35.6
24.1
25.4
10.9
2.4
7,436
4,741
10.0
25.9
42.7
25.5
28.0
8.7
2.0
Our analysis of the state-wise and product segment-wise two-wheeler (2W) sales
for the last four years up to 3QFY14 indicates initial signs of demand recovery.
October-February sales grew 9.1% against 3.5%/3.2% in 1HFY14/FY13. The weak
performing South region too has stabilized, registering 2.9% growth in 3QFY14
against 10.3% decline in 1HFY14.
Scooter volumes grew 18%, outpacing Motorcycle volume growth across regions.
The share of Scooters has increased from 21.3% in FY13 to 23.7% in 9MFY14. Post
the launch of
Jupiter
in September 2013, TVSL’s market share in Scooters has
increased.
In non-South markets, growth in Moped volumes has remained strong at 18%. In
Uttar Pradesh, the largest non-South market for Mopeds, volumes grew 20%.
TVSL is the only company currently operating in the Mopeds segment in India.
Recovery in South markets augurs well for TVSL, which derives 56% of its volumes
from this region. Over the next 12-18 months, TVSL plans to launch multiple
products across segments to reinforce its product portfolio. We expect EPS to
grow at a CAGR of 34% over FY14-16. Maintain Buy, with a target price of INR120
(12x FY16E EPS).
Initial signs of recovery in 2Ws; North and East driving growth
Shareholding pattern (%)
As on
Promoter
Dom. Inst
Foreign
Others
Dec-13 Sep-13 Dec-12
57.4
17.7
3.7
21.2
57.4
18.3
2.9
21.4
57.4
18.1
2.3
22.2
Initial signs of demand recovery are evident in the domestic two-wheeler
(2W) industry. October-February sales have grown 9.1% v/s 3.5%/3.2% in
1HFY14/FY13.
The North (13.2% growth) and East (17.1% growth) have been the key
growth drivers during the period.
The South has been the weakest performer, with volume decline of 6.5%,
largely due to 19.4% decline in the largest market, Tamil Nadu.
However, signs of recovery are visible in the South as well, with marginal
growth of 2.9% in 3QFY14 (v/s 10.3% decline in 1HFY14)
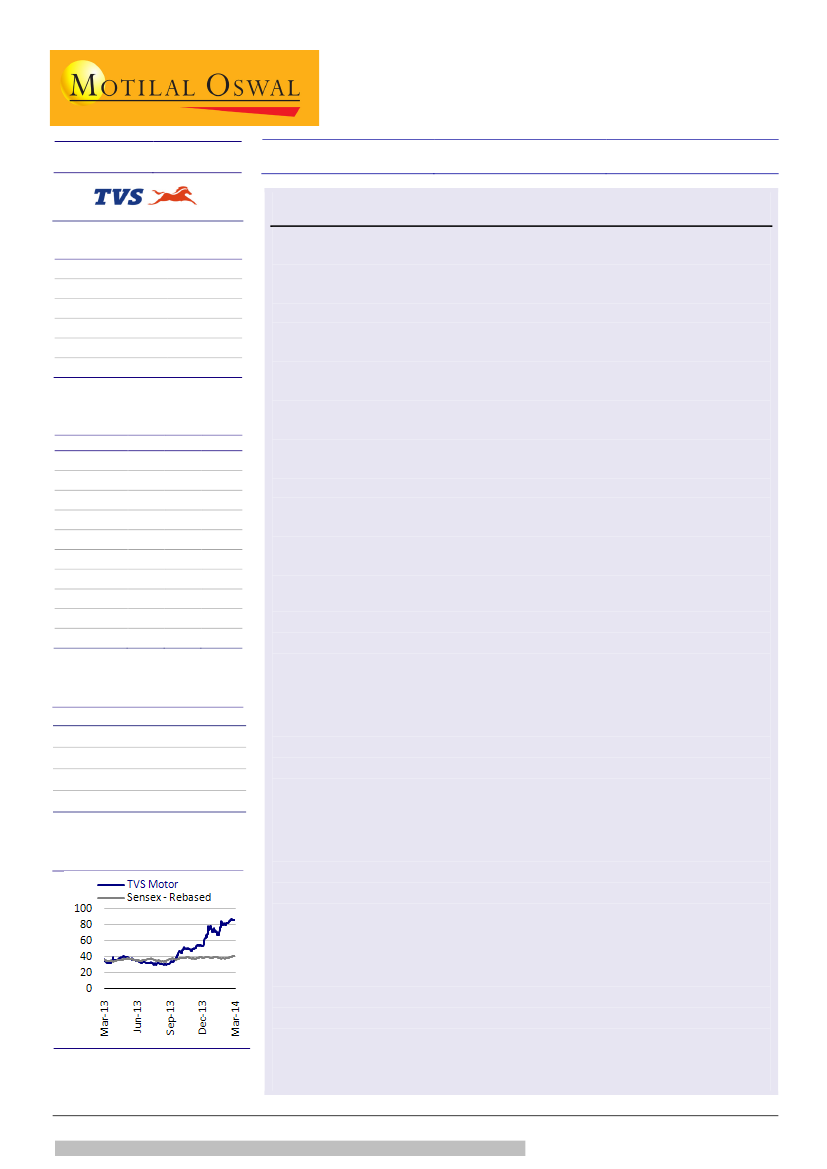
Stock Performance (1-year)
Scooters outperform across regions; Jupiter helps TVSL gain share
Scooter volumes grew 18%, outpacing Motorcycle growth across regions.
The share of Scooters has risen from 21.3% in FY13 to 23.7% in 9MFY14.
Post the launch of Jupiter in September 2013 in the non-South markets,
TVSL has witnessed healthy improvement in its market share in Scooters.
Mopeds register 18% growth in non-South markets
Moped volumes declined 10.6% in 9MFY14 due to 31% decline in the
largest market, Tamil Nadu, which contributes 47% of volumes.
In non-South markets, growth in Moped volumes has remained strong at
18%. In Uttar Pradesh, the largest non-South market for Mopeds, volumes
grew 20%.
Jinesh Gandhi
(Jinesh@MotilalOswal.com); +91 22 3982 5416
Chirag Jain
(Chirag.Jain@MotilalOswal.com); +91 22 3982 5418
Investors are advised to refer through disclosures made at the end of the Research Report.

TVS Motor
TVSL is the only company currently operating in the Mopeds.
TVSL gaining share in Scooters, South recovery augurs well; Buy
Post
Jupiter
launch, TVSL’s market share in Scooters has increased in non-
South markets. Launch in the South market in 4QFY14 would further boost
TVSL’s share.
Recovery in South markets augurs well for TVSL, given its high dependence
on this region (South India, which contributed 31% of industry volumes in
FY13, accounted for 56% of TVSL’s volumes).
Over the next 12-18 months, TVSL plans to launch multiple products across
segments to reinforce and fill gaps in its product portfolio.
We expect EPS to grow at a CAGR of 34% and FCF to grow at a CAGR of 25%
over FY14-16, with RoE improving from 19.9% to 25.5%.
Sustained strength of the Scooter industry and TVSL’s market share gains,
coupled with initial signs of recovery in the South, increase our confidence
in TVSL’s ability to deliver strong volume-led earnings growth. We now
value TVSL at 12x (v/s 10x earlier) FY16E EPS of INR10.
Maintain
Buy,
with a target price of INR120.
18 March 2014
2

TVS Motor
Initial signs of recovery in 2Ws
North and East driving growth, South stabilizing
Initial signs of demand recovery are evident in the domestic two-wheeler (2W)
industry. October-February sales have grown 9.1% v/s 3.5%/3.2% in 1HFY14/FY13.
The North (13.2% growth) and East (17.1% growth) have been the key growth drivers
during the period.
The South has been the weakest performer, with volume decline of 6.5%, largely due
to 19.4% decline in the largest market, Tamil Nadu.
However, signs of recovery are visible in the South as well, with marginal growth of
2.9% in 3QFY14 (v/s 10.3% decline in 1HFY14).
North and East driving two-wheeler industry growth
Two-wheeler (2W) industry growth has improved from 3.2% in FY13 to 5.8% in
9MFY14, driven by strong growth in the North and the East.
2W volumes grew 13% in the North and 17% in the East during 9MFY14.
Growth in the West also improved from 1.1% in FY13 to 7.6% in 9MFY14.
The South has been the weakest performer, with volume decline of 6.5%, largely
due to 19.4% decline in the largest market, Tamil Nadu.
North and East registers growth, while South declines (%)
FY12
9.7
13.2
17.1
9.8
FY13
14.0
7.6
1.1
(1.2)
3.3
9MFY14
18.6
12.4
5.8
3.2
Domestic 2W industry recovering over past two quarters
Domestic YoY (%)
12.4
7.1
3.2
13.8
8.9
10.1
2.4
(1.9)
FY12
FY13
1QFY14 2QFY14 3QFY14 Jan-14
Feb-14
North
East
West
(6.5)
South
Total
Source: Company, MOSL
Source: Company, Industry, MOSL
Tamil Nadu drags South performance, but recovery signs visible
Consumer sentiment in the South, particularly Tamil Nadu, has been weak over
the last couple of years due to drought and major power shortage, which
impacted industrial activity.
However, with improved power availability and relatively better monsoon in
FY14, there are signs of recovery in Tamil Nadu – 2W volumes declined 9.3% in
3Q after 30% decline in 2Q and 18% decline in 1Q.
In Karnataka and Andhra Pradesh, 2W volumes grew 21% and 12.9%,
respectively in 3QFY14.
18 March 2014
3

TVS Motor
Within the South, Tamil Nadu has been the worst hit (%)
FY13
23.7
1.6
(1.3)
5.8 7.5
(0.3)
(19.4)
Andhra
Pradesh
Karnataka
Kerala
Tamil Nadu South Zone
1QFY14
3.3
(6.5)
9MFY14
Signs of recovery visible in 3QFY14 in the South, as well (%)
Andhra Pradesh
Tamil Nadu
Karnataka
South Zone
3.4 7.6
(5.4)
(9.9)
21.0
12.9
Kerala
2.9
(9.3)
(8.5)
(10.8)
(18.0)
(10.9)
(30.0)
2QFY14
3QFY14
Source: Company, Industry, MOSL
18 March 2014
4

TVS Motor
Scooters outperform; Jupiter helps TVSL gain share
Mopeds register healthy growth in non-South markets
Motorcycle volumes grew 3.5% in 9MFY14, driven by 9.6% growth in the North and
13.1% growth in the East, though the South saw 9.7% decline.
Scooter volumes grew 18%, outpacing Motorcycle volume growth across regions. The
share of Scooters has increased from 21.3% in FY13 to 23.7% in 9MFY14. Post the
launch of
Jupiter
in September 2013 in the non-South markets, TVSL has witnessed
healthy improvement in its market share in Scooters.
Moped volumes declined 10.6% in 9MFY14 due to 31% decline in the largest market,
Tamil Nadu, which contributes 47% of volumes. However, in non-South markets,
growth has remained strong at 18%. In Uttar Pradesh, the largest non-South market
for Mopeds, volumes grew 20%.
Motorcycle grew 3.5% in 9MFY14, led by North and East (%)
FY12
13.1
6.5
FY13
13.1
4.8
(0.5)
9MFY14
16.7
10.1
3.5
0.2
(1.8)
(9.7)
North
East
West
South
Total
South also witnessed positive growth in 3QFY14 (%)
1QFY14
23.8
13.0
4.8 12.0
7.3
9.1
11.2
5.2
(2.0)
3.9
(13.5)
(17.8)
South
6.4 7.1
2QFY14
3QFY14
8.3
9.6
(0.3)
(3.9)
(2.9)
Total
North
East
West
Source: Company, Industry, MOSL
Scooters outperform across regions; share at 23.7% v/s 12% in FY07
Scooter volumes grew 18%, outpacing Motorcycle volume growth across
regions. The share of Scooters has increased from 21.3% in FY13 (12% in FY07)
to 23.7% in 9MFY14.
Changing customer preferences are driving value migration from motorcycles to
scooters in India.
Scooters outperform motorcycles across regions (9MFY14, %) Share of scooters rises further (%)
Scooters
37.8
29.4
9.6
13.1
16.4
4.8
9.2
14 16
17
20
10
12
14
17
21 22 23
25
19 21
Motorcycle
FY11
FY12
FY13
9MFY14
29
25
(9.7)
North
East
West
South
North
East
West
South
Source: Company, Industry, MOSL
18 March 2014
5

TVS Motor
Mopeds register 18% growth in non-South market
UP is the largest non-South
market for Mopeds, with
9% share. In 9MFY14,
Moped volumes grew
20% in UP.
Moped volumes declined 10.6% in 9MFY14 due to 31% decline in the largest
market, Tamil Nadu, which contributes 47% of volumes.
In non-South markets, growth in Moped volumes has remained strong at 18%.
In Uttar Pradesh, the largest non-South market for Mopeds, volumes grew 20%.
Overall volumes down due to high South exposure
Moped growth 9MFY14 (%)
18
8
Mopeds register growth across non-South markets (%)
FY11
FY12
31.7
17.1
10.5
(2.3)
(10.6)
(21.7)
North
East
West
South
PAN India
6.7
12.4
13.5
11.6
FY13
9MFY14 (YoY)
(31)
Tamil Nadu
Excl. Tamil Nadu
Excl. South
Source: Company, Industry, MOSL
18 March 2014
6

TVS Motor
TVSL gaining share in Scooters
South recovery augurs well; Buy
Post the launch of its 110cc Scooter,
Jupiter,
TVSL’s market share in Scooters has
increased in non-South markets. Launch in the South market in 4QFY14 would further
boost its share.
Recovery in South markets augurs well for TVSL, given its high dependence on this
region (South India, which contributed 31% of industry volumes in FY13, accounted for
56% of TVSL’s volumes).
TVSL is well positioned to benefit from the scooterization wave in India. Over the next
12-18 months, it plans to launch multiple products across segments to reinforce and
fill gaps in its product portfolio.
We expect EPS to grow at a CAGR of 34% and FCF to grow at a CAGR of 25% over
FY14-16, with RoE improving from 19.9% to 25.5%. Maintain Buy.
Jupiter helps TVSL gain share; new Scooty to further strengthen position
With
Jupiter
launch, TVSL has the complete range of scooters, with products in
every sub-segment (women, unisex, men). Demand for
Jupiter
remains strong,
with a waiting period across major markets.
Post the launch of its 110cc Scooter,
Jupiter,
TVSL’s market share in Scooters has
increased in non-South markets. Launch in the South market in 4QFY14 would
further boost its share.
Upcoming launch of
Scooty Zest
in April 2014 (110cc engine, currently offering
90cc variant) will further strengthen TVSL’s positioning in the women's Scooter
space.
We expect TVSL’s Scooter volumes to register a CAGR of 19.5% over FY14-16,
driven by product actions, capacity ramp-up and robust Scooter industry
growth.
Post Jupiter launch, TVSL gains share in non-South market (%) TVSL gains share in Motorcycles, driven by gains in North (%)
FY11
FY12
FY13
1HFY14
3QFY14
31.0
22.2
10.6
13.8
8.7
6.4
North
10.0
East
19.2
10.8
5.1
9.0
West
21.0
South
North
East
West
South
Total
5.0
5.7
5.9
6.0
5.7
FY11
FY12
FY13
9MFY14
10.4
16.3
6.3
6.7
7.0
5.63
5.56
5.3
5.1
5.3
Source: Company, Industry, MOSL
Recovery signs visible in South; TVSL could benefit disproportionately
Performance of the 2W industry has been the weakest in the South market,
which saw 6.5% volume decline in 9MFY14, largely due to 19.4% decline in Tamil
Nadu.
However, signs of recovery are visible in the South as well, with marginal growth
of 2.9% in 3QFY14 (v/s decline of 10.3% in 1HFY14).
7
18 March 2014

TVS Motor
South India, which contributed 31% of industry volumes in FY13, accounted for
56% of TVSL’s volumes.
New launches, recovery in the South and robust 19.5% CAGR in Scooter volumes
should drive 13.3% CAGR in TVSL’s overall volumes over FY14-16.
…particularly in Mopeds and Scooters
TVS South FY13 vol. exposure (%)
67
South recovery could benefit TVSL disproportionately…
FY13 volume share (%)
North
East
West
South
31
34
22
9
13
TVS Motor
13
22
Industry
58
53
56
30
Mopeds
Motorcycles
Scooters
Total
Source: Company, Industry, MOSL
Reinforcing strong product pipeline, filling gaps in portfolio
Limited product actions were the key reason for TVSL’s significant market share
loss from 22.3% in FY03 to 12% in 1HFY14.
Unlike the past, TVSL has a strong product pipeline and plans to launch a
product every quarter, including two new executive motorcycles and a diesel
three-wheeler.
Unlike the past, TVSL now has a robust product pipeline
Timeline
1QFY15
1QFY15
2QFY15
2QFY15
2QFY15
Product
Scooty Zest
Star City
Diesel 3W
Victor
4-stroke
Moped
Category
Comments
Scooter (110cc engine)
Same 110cc engine as in Wego, Jupiter
Motorcycle (110cc engine) Product upgrade (all-new platform)
Diesel segment constitute 65% of three-wheeler
Three-wheeler
Motorcycle (110cc engine) To share platform with Star City upgrade model
Moped (100cc)
To improve fuel efficiency, currently 2-stroke 70cc
available
Source: Company, Industry, MOSL
Success of new launches could yield disproportionate gains
Given its wide distribution network (second to Hero MotoCorp) and low base,
success of any one or two launches could drive disproportionate gains in market
share and volumes for TVSL.
Wide network could help TVSL achieve disproportionate gains from successful launches
900
845
No. of dealers
650
700
Hero Moto
TVS Motor
Bajaj Auto
HMSI
Source: Company, MOSL
18 March 2014
8

TVS Motor
Sale of non-core investments + healthy cash from operations = net cash
Healthy cash from operations (FCF CAGR of 25% over FY14-16) coupled with sale
of non-core investments should transform TVSL into a net cash company by
FY16.
TVSL had net debt of INR6.2b in FY13. It recently sold its majority stake in its
Energy venture, reducing consolidated debt by INR2.6b.
High FCF to transform TVSL into net cash company by FY16
FCF (INR m)
6,866
5,054
571
5,309
480
3,717
8,181
6,170
224
822
48
17
FY15E
FY16E
FY12
FY13
FY14E
FY15E
FY16E
-2,080
-1,565
Net debt (INR m)
Interest cost (INR m)
Expect FCF CAGR of 25% over FY14-16
CFO (INR m)
Capex (INR m)
5,433
2,672 3,303 2,536
3,474
6,619
4,440
-767
-1,768
FY12
FY13
-1,959
FY14E
-1,557
Source: Company, MOSL
Maintain Buy with a target price of INR120
TVSL is well positioned to benefit from the scooterization wave in India. Over
the next 12-18 months, it plans to launch multiple products across segments to
reinforce and fill gaps in its product portfolio.
We expect EPS to grow at a CAGR of 34% and FCF to grow at a CAGR of 25%
over FY14-16, with RoE improving from 19.9% to 25.5%. We expect TVSL to be a
net cash company by FY16, driven by strong FCF.
Sustained strength of the Scooter industry and TVSL’s market share gains,
coupled with initial signs of recovery in the South, increase our confidence in
TVSL’s ability to deliver strong volume-led earnings growth. We now value TVSL
at 12x (v/s 10x earlier) FY16E EPS of INR10.
Maintain
Buy,
with a target price of INR120.
18 March 2014
9

TVS Motor
Financials and valuation
Income statement
Y/E March
Net Sales
Change (%)
EBITDA
EBITDA Margin (%)
Depreciation
EBIT
Interest
Other Income
Extraordinary items
PBT
Tax
Tax Rate (%)
Reported PAT
Adjusted PAT
Change (%)
2011
62,880
44.1
3,954
6.3
1,073
2,882
723
356
34
2,481
535
21.6
1,946
1,972
3.7
2012
71,415
13.6
4,694
6.6
1,175
3,518
571
217
0
3,165
674
21.3
2,491
2,491
26.3
2013
70,650
-1.1
4,090
5.8
1,304
2,786
480
246
916
1,636
476
29.1
1,160
1,810
-27.3
2014E
80,007
13.2
4,720
5.9
1,291
3,429
224
308
-303
3,815
954
25.0
2,861
2,634
45.5
(INR Million)
2015E
96,330
20.4
6,117
6.4
1,388
4,729
48
339
0
5,020
1,255
25.0
3,765
3,765
42.9
2016E
110,661
14.9
7,436
6.7
1,470
5,966
17
373
0
6,321
1,580
25.0
4,741
4,741
25.9
Balance sheet
Y/E March
Share Capital
Reserves
Net Worth
Debt
Deferred Tax
Total Capital Employed
Gross Fixed Assets
Less: Acc Depreciation
Net Fixed Assets
Capital WIP
Investments
Current Assets
Inventory
Debtors
Cash & Bank
Loans & Adv, Others
Curr Liabs & Provns
Curr. Liabilities
Provisions
Net Current Assets
Total Assets
2011
475
9,519
9,994
7,678
957
18,629
19,723
10,347
9,376
574
6,611
12,014
5,279
2,706
60
3,969
9,946
9,453
494
2,068
18,629
2012
475
11,221
11,696
8,311
976
20,982
21,545
11,289
10,256
525
9,309
11,055
5,846
2,080
130
2,998
10,163
9,585
577
892
20,982
2013
475
11,772
12,247
6,345
931
19,523
22,479
12,365
10,115
361
8,688
12,029
5,097
3,005
175
3,752
11,670
11,136
534
359
19,523
2014E
475
13,799
14,274
4,345
931
19,550
24,479
13,656
10,823
320
8,953
13,092
5,455
3,069
628
3,940
13,638
12,429
1,209
-546
19,550
(INR Million)
2015E
2016E
475
475
16,453
19,804
16,928
20,279
4,320
3,820
931
931
22,179
25,030
25,979
27,479
15,043
16,514
10,936
10,966
385
443
9,953
10,953
17,446
21,817
6,380
7,329
3,431
4,245
3,498
5,899
4,137
4,344
16,541
19,148
14,965
17,191
1,576
1,957
904
2,669
22,179
25,030
E: MOSL Estimates
18 March 2014
10

TVS Motor
Financials and valuation
Ratios
Y/E March
Basic (INR)
EPS
Cash EPS
Book Value
DPS
Payout (incl. Div. Tax.)
Valuation (x)
P/E
Cash P/E
Price / Book Value
EV/Sales
EV/EBITDA
Dividend Yield (%)
Profitability Ratios (%)
RoE
RoCE
Turnover Ratios
Asset Turnover (x)
2011
4.2
6.4
21.0
1.1
31.1
2012
5.2
7.7
24.6
1.3
28.8
2013
3.8
6.6
25.8
1.2
56.5
2014E
5.5
8.3
30.0
1.5
29.1
2015E
7.9
10.8
35.6
2.0
29.5
2016E
10.0
13.1
42.7
2.5
29.3
22.7
13.2
3.4
0.7
11.6
1.4
15.6
10.5
2.9
0.6
9.5
1.7
10.9
8.0
2.4
0.4
6.9
2.3
8.7
6.6
2.0
0.4
5.2
2.9
21.2
17.8
23.0
19.8
15.1
15.7
19.9
20.1
24.1
25.4
25.5
28.0
3.4
3.4
3.6
4.1
4.3
4.4
Cash flow statement
Y/E March
OP/(Loss) before Tax
Depreciation
Others
Interest
Direct Taxes Paid
(Inc)/Dec in Wkg Cap
CF from Op. Activity
(Inc)/Dec in FA & CWIP
(Pur)/Sale of Invt
Others
CF from Inv. Activity
(Inc)/Dec in Debt
Interest Paid
Dividend Paid
Others
CF from Fin. Activity
Inc/Dec of Cash
Add: Beginning Balance
Closing Balance
2011
2,481
813
0
470
811
-674
2,341
-1,074
830
223
-21
-3,968
-703
-411
1,812
-3,271
-950
1,010
60
2012
3,165
942
0
408
700
626
4,409
-1,768
-2,699
658
-3,809
-778
-571
-659
2,269
261
861
-731
130
2013
1,628
1,076
0
327
527
800
4,181
-767
-295
77
-985
-276
-517
-715
564
-945
2,251
-2,077
175
2014E
3,512
1,291
0
224
954
1,359
5,125
-1,959
-265
308
-1,916
-2,000
-224
-834
303
-2,755
454
175
628
(INR Million)
2015E
2016E
5,020
6,321
1,388
1,470
0
0
48
17
1,255
1,580
1,419
637
6,281
6,493
-1,565
-1,557
-1,000
-1,000
339
373
-2,227
-2,185
-25
-500
-48
-17
-1,112
-1,390
0
0
-1,184
-1,907
2,870
2,402
628
3,498
3,498
5,899
E: MOSL Estimates
18 March 2014
11

Disclosures
This report is for personal information of the authorized recipient and does not construe to be any investment, legal or taxation advice to you. This research report does not constitute an offer, invitation or
inducement to invest in securities or other investments and Motilal Oswal Securities Limited (hereinafter referred as MOSt) is not soliciting any action based upon it. This report is not for public distribution
and has been furnished to you solely for your information and should not be reproduced or redistributed to any other person in any form.
Unauthorized disclosure, use, dissemination or copying (either whole or partial) of this information, is prohibited. The person accessing this information specifically agrees to exempt MOSt or any of its
affiliates or employees from, any and all responsibility/liability arising from such misuse and agrees not to hold MOSt or any of its affiliates or employees responsible for any such misuse and further agrees
to hold MOSt or any of its affiliates or employees free and harmless from all losses, costs, damages, expenses that may be suffered by the person accessing this information due to any errors and delays.
The information contained herein is based on publicly available data or other sources believed to be reliable. While we would endeavour to update the information herein on reasonable basis, MOSt and/or
its affiliates are under no obligation to update the information. Also there may be regulatory, compliance, or other reasons that may prevent MOSt and/or its affiliates from doing so. MOSt or any of its
affiliates or employees shall not be in any way responsible and liable for any loss or damage that may arise to any person from any inadvertent error in the information contained in this report. MOSt or any
of its affiliates or employees do not provide, at any time, any express or implied warranty of any kind, regarding any matter pertaining to this report, including without limitation the implied warranties of
merchantability, fitness for a particular purpose, and non-infringement. The recipients of this report should rely on their own investigations.
This report is intended for distribution to institutional investors. Recipients who are not institutional investors should seek advice of their independent financial advisor prior to taking any investment decision
based on this report or for any necessary explanation of its contents.
MOSt and/or its affiliates and/or employees may have interests/positions, financial or otherwise in the securities mentioned in this report. To enhance transparency, MOSt has incorporated a Disclosure of
Interest Statement in this document. This should, however, not be treated as endorsement of the views expressed in the report.
Disclosure of Interest Statement
1. Analyst ownership of the stock
2. Group/Directors ownership of the stock
3. Broking relationship with company covered
4. Investment Banking relationship with company covered
TVS MOTOR CO LTD
No
No
No
No
TVS Motor
Analyst Certification
The views expressed in this research report accurately reflect the personal views of the analyst(s) about the subject securities or issues, and no part of the compensation of the research analyst(s) was, is,
or will be directly or indirectly related to the specific recommendations and views expressed by research analyst(s) in this report. The research analysts, strategists, or research associates principally
responsible for preparation of MOSt research receive compensation based upon various factors, including quality of research, investor client feedback, stock picking, competitive factors and firm revenues.
This report is not directed or intended for distribution to or use by any person or entity resident in a state, country or any jurisdiction, where such distribution, publication, availability or use would be contrary
to law, regulation or which would subject MOSt & its group companies to registration or licensing requirements within such jurisdictions.
Regional Disclosures (outside India)
This report is intended for distribution only to persons having professional experience in matters relating to investments as described in Article 19 of the Financial Services and Markets Act 2000 (Financial
Promotion) Order 2005 (referred to as "investment professionals"). This document must not be acted on or relied on by persons who are not investment professionals. Any investment or investment activity
to which this document relates is only available to investment professionals and will be engaged in only with such persons.
For U.K.
Motilal Oswal Securities Limited (MOSL) is not a registered broker - dealer under the U.S. Securities Exchange Act of 1934, as amended (the"1934 act") and under applicable state laws in the United
States. In addition MOSL is not a registered investment adviser under the U.S. Investment Advisers Act of 1940, as amended (the "Advisers Act" and together with the 1934 Act, the "Acts), and under
applicable state laws in the United States. Accordingly, in the absence of specific exemption under the Acts, any brokerage and investment services provided by MOSL, including the products and services
described herein are not available to or intended for U.S. persons.
This report is intended for distribution only to "Major Institutional Investors" as defined by Rule 15a-6(b)(4) of the Exchange Act and interpretations thereof by SEC (henceforth referred to as "major
institutional investors"). This document must not be acted on or relied on by persons who are not major institutional investors. Any investment or investment activity to which this document relates is only
available to major institutional investors and will be engaged in only with major institutional investors. In reliance on the exemption from registration provided by Rule 15a-6 of the U.S. Securities Exchange
Act of 1934, as amended (the "Exchange Act") and interpretations thereof by the U.S. Securities and Exchange Commission ("SEC") in order to conduct business with Institutional Investors based in the
U.S., MOSL has entered into a chaperoning agreement with a U.S. registered broker-dealer, Motilal Oswal Securities International Private Limited. ("MOSIPL"). Any business interaction pursuant to this
report will have to be executed within the provisions of this chaperoning agreement.
The Research Analysts contributing to the report may not be registered /qualified as research analyst with FINRA. Such research analyst may not be associated persons of the U.S. registered broker-
dealer, MOSIPL, and therefore, may not be subject to NASD rule 2711 and NYSE Rule 472 restrictions on communication with a subject company, public appearances and trading securities held by a
research analyst account.
For U.S.
Motilal Oswal Capital Markets Singapore Pte Limited is acting as an exempt financial advisor under section 23(1)(f) of the Financial Advisers Act(FAA) read with regulation 17(1)(d) of the Financial
Advisors Regulations and is a subsidiary of Motilal Oswal Securities Limited in India. This research is distributed in Singapore by Motilal Oswal Capital Markets Singapore Pte Limited and it is only directed
in Singapore to accredited investors, as defined in the Financial Advisers Regulations and the Securities and Futures Act (Chapter 289), as amended from time to time.
In respect of any matter arising from or in connection with the research you could contact the following representatives of Motilal Oswal Capital Markets Singapore Pte Limited:
Anosh Koppikar
Kadambari Balachandran
Email:anosh.Koppikar@motilaloswal.com
Email : kadambari.balachandran@motilaloswal.com
Contact(+65)68189232
Contact: (+65) 68189233 / 65249115
Office Address:21 (Suite 31),16 Collyer Quay,Singapore 04931
For Singapore
Motilal Oswal Securities Ltd
18 March 2014
Motilal Oswal Tower, Level 9, Sayani Road, Prabhadevi, Mumbai 400 025
Phone: +91 22 3982 5500 E-mail: reports@motilaloswal.com
12