24 March 2014
Update | Sector: Textiles
Arvind Ltd
BSE Sensex
22,055
S&P CNX
6,584
CMP: INR148
TP: INR215
Buy
Acquires 49% stake in Calvin Klein India for INR0.9b
Stock Info
Bloomberg
Equity Shares (m)
52-Week Range (INR)
1, 6, 12 Rel. Per (%)
M.Cap. (INR b)
M.Cap. (USD b)
Re-iterates Arvind’s transformation into a brand power house
ARVND IN
258.2
160/65
-7/70/78
38.1
0.6
Arvind buys 49% in CK India JV; parent PVH to own balance 51%
Arvind Brands and Retail Ltd (100% subsidiary of Arvind Ltd) has entered into an
agreement to purchase 49% stake in Calvin Klein India from erstwhile JV
partners (Murjani Group and Matrix Partners) for a consideration of INR0.9b.
While Arvind will own 49%, the balance 51% will continue to be owned by
Calvin Klein’s global parent Phillips Van Heusen Corp (PVH). The deal values CK
India at an Enterprise Value of INR1.8b, at 8-10x FY15 EV / EBITDA multiple.
Financial Snapshot (INR Million)
Y/E March
2014E 2015E 2016E
Net Sales
66,519 80,908 96,622
EBITDA
Adj PAT
EPS (INR)
Growth (%)
BV/Share
( )
RoE (%)
RoCE (%)
P/E (x)
P/BV (x)
9,273 11,691 14,503
3,324 4,279 5,790
12.9
33.9
13.9
14.4
11.5
1.5
16.6
28.8
15.9
16.4
8.9
1.3
22.4
35.3
18.5
18.9
6.6
1.1
Calvin Klein is well known and a highly scalable brand
Calvin Klein brand is one of the top three most coveted brands globally. CK India
revenues stand at ~INR1.25b and have grown at a 30% CAGR over the last 3
years with an EBITDA margin of ~8%-9%. CK runs 41 stores in India with an
average store size of 1,000 sq. ft each, all of which are franchise based apart
from having 34 shops in shops. It derives 90% of revenues come from Jeans
(80% men’s and 20% from women’s), while balance 10% come from Innerwear.
Around 70% of revenues come from EBOs while balance 30% comes from MBOs
and departmental stores. Management plans to add around 15 EBOs p.a. over
next 2 years and also leverage its existing departmental stores and MBOs
network to attain 30-35% CAGR. With most store additions being added in
franchise model complimented with aggressive scale up across MBOs, margins
are set to improve to 14% in FY15 with capex intensity remaining low. Arvind
and PVH will have equal managerial involvement in growing the CK brand in
India.
97.8 111.4 130.8
Shareholding pattern (%)
As on
Promoters
Dom. Inst.
Foreign
Others
Dec-13 Sep-13 Dec-12
43.8
18.2
19.2
18.8
44.0
19.4
15.7
20.9
43.5
18.3
17.4
20.8
CK acquisition to further drive product extensions
Post CK acquisition, Arvind will command a 90% market share in one of the
fastest growing ‘Bridge To Luxury’ segment (with a strong portfolio of
Tommy
Hilfiger, Gant, Nautica
and
CK).
With brands like
Calvin Klein, Tommy Hilfiger,
US Polo, Ed Hardy and Flying Machine,
Arvind has a complete portfolio of denim
brands with price points from INR750 to INR10,000. CK as a brand has universal
appeal and hence Arvind plans to introduce CK accessories immediately;
followed by formal wear and suits in the medium term. Meanwhile Arvind now
has a very strong innerwear portfolio spanning brands like
Hanes, CK, US Polo
and
Tommy
which it plans to scale up to INR1.5b sales / INR5.0b by FY15 / FY18.
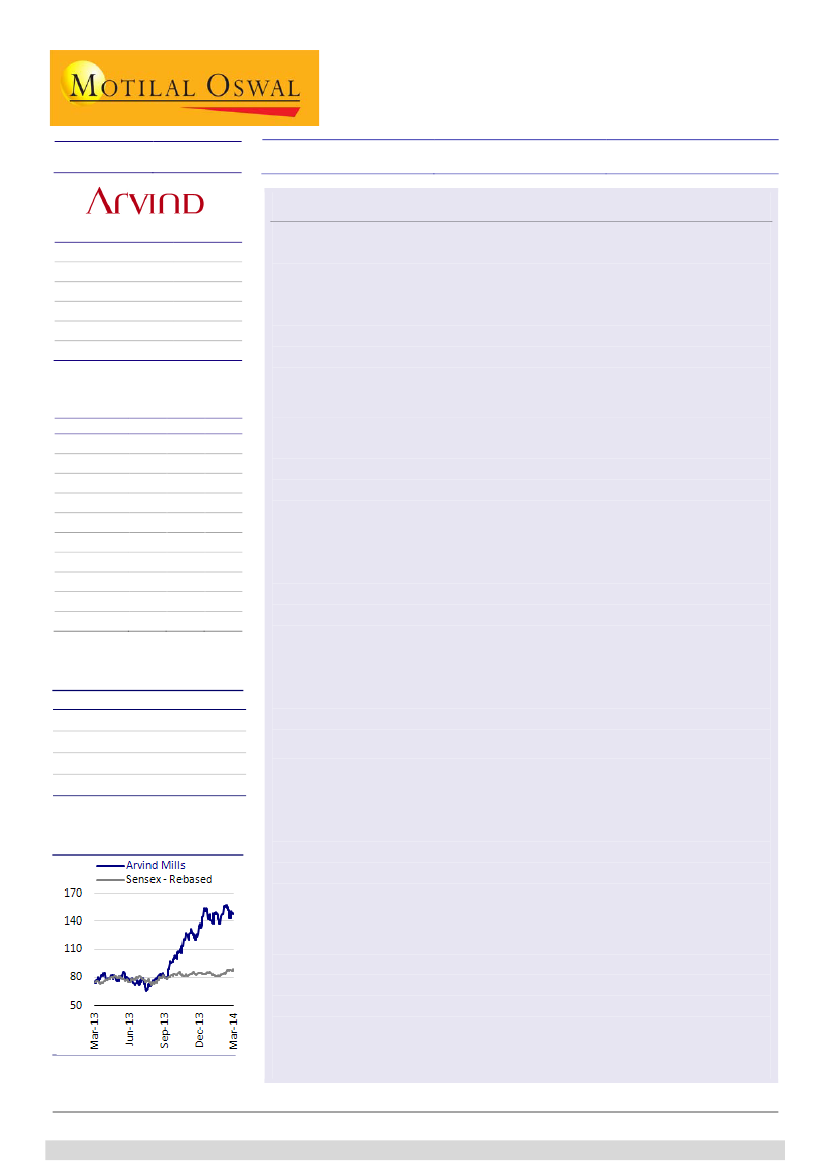
Stock Performance (1-year)
Valuation and view: maintain Buy
While we upgrade our EBITDA assumptions marginally, we believe that the
acquisition of CK provides huge scalability potential with improvement in
brands and retail margins going forward. Given decade high return rations and
increased contribution from brands and retail segment, we value ARVND at 6x
FY16E EV/EBITDA and arrive at a target price of INR215. Maintain
Buy.
Niket Shah
(Niket.Shah@MotilalOswal.com); +91 22 39825426
Atul Mehra
(Atul.Mehra@motilaloswal.com); +91 22 3982 5417
Investors are advised to refer through disclosures made at the end of the Research Report.

Arvind Ltd
Arvind buys 49% in CK India; PVH to own 51%
CK India does revenues of INR1.2b+, with high single digit EBITDA margins
Deal valued at 8-10x
FY15E EV/EBITDA…
Smart acquisition…
Arvind Brands and Retail Ltd (100% subsidiary of Arvind Ltd) has finalized a deal to
purchase 49% stake in Premium Garments Wholesale Trading Private Limited, the
licensee of the Calvin Klein trademarks in India. The stake will be acquired from
Murjani Group and US-based private equity fund Matrix Partners for a consideration
of INR0.9b.
While Arvind will own 49%, the balance 51% will continue to be owned by Calvin
Klein’s global parent Phillips Van Heusen Corp (PVH). The deal values CK India at an
Enterprise Value of INR1.8b, at 8-10x FY15 EV / EBITDA multiple. CK India does
revenues in excess of INR1b with EBITDA margins in high single digits making it a
promising addition to Arvind’s brand’s list.
….With high scalability potential in India
CK India revenues stand at ~INR1.25b and have grown at a 30% CAGR over the last 3
years with an EBITDA margin of ~8%-9%. CK runs 41 stores in India with an average
store size of 1,000 sq. ft each, all of which are franchise based apart from having 34
shops in shops. It derives 90% of revenues come from Jeans (80% men’s and 20%
from women’s), while balance 10% come from Innerwear. Around 70% of revenues
come from EBOs while balance 30% comes from MBOs and departmental stores.
Management plans to add around 15 EBOs p.a. over next 2 years and also leverage
its existing departmental stores and MBOs network to attain 30-35% CAGR. With
most store additions being added in franchise model complimented with aggressive
scale up across MBOs, margins are set to improve to 14% in FY15 with capex
intensity remaining low. Arvind and PVH will have equal managerial involvement in
growing the CK brand in India.
Largely a denim brand currently…
Innerwear
10%
Global sales of CK
amount to USD7.6b
Men’s category dominates revenue mix
Men
80%
Women
100%
20%
0%
Jeans
Innerwear
Jeans
90%
Source: Company, MOSL
24 March 2014
2

Arvind Ltd
~70% of revenue through EBOs
CK India runs ~41 EBOs and 34 shop-in-shops
41
34
EBOs
Shop-in-Shops
Source: Company, MOSL
Power brands turnover
Power brands (INR m)
Power brands % of total brands
90%
86%
86%
Power brands margin (%)
11.0
9.3
7.4
9.5
78%
2,180
FY10
3,940
FY11
6,200
FY12
7,290
FY13
FY10
FY11
FY12
FY13
Source: Company, MOSL
Percentage contribution to total power brands revenue
Tommy, 11.3%
Flying machine,
15.0%
Arrow, 43.8%
US Polo, 30.0%
Source: Company, MOSL
24 March 2014
3

Arvind Ltd
Newer product extensions to drive growth
Accessories, Formal wear, and Innerwear to be key growth drivers
Arvind is targeting
INR5b revenues in
Innerwear business
over next 3 years
Improving scale to lead to new product opportunities
Post CK acquisition, Arvind will command a 90% market share in one of the fastest
growing ‘Bridge To Luxury’ segment (with a strong portfolio of
Tommy Hilfiger, Gant,
Nautica
and
CK).
With brands like
Calvin Klein, Tommy Hilfiger, US Polo, Ed Hardy
and Flying Machine,
Arvind has a complete portfolio of denim brands with price
points from INR750 to INR10,000. CK as a brand has universal appeal and hence
Arvind plans to introduce CK accessories immediately; followed by formal wear and
suits in the medium term.
Brand portfolio improves with entry of CK
Source: Company
Meanwhile Arvind now has a very strong innerwear portfolio spanning brands like
Hanes, CK, US Polo and Tommy. Arvind is targeting INR1.5b sales in innerwear in
FY15 and plans to ramp this up to INR5b over next 3 years.
Arvind targets INR5b revenues for the innerwear portfolio
24 March 2014
4

Arvind Ltd
Calvin Klein is well known global brand
Calvin Klein brand is one of the most frequently purchased brand in the world and
amongst the top three most coveted brands as per a recent AC Nielson Global
Luxury Brand Study. Global retail sales of products sold under the Calvin Klein
brands were approximately USD7.6b in over 100 countries across 2,800 retail stores
in 2012. Calvin Klein is an USD600m brand in China.
Calvin Klein is a USD7.6b brand globally…
Asia/Rest of the
World
19%
Latin America
4%
North America
54%
Europe
23%
Source: Company, MOSL
… and runs 2,800 stores across the world
Source: Company, MOSL
24 March 2014
5

Arvind Ltd
Valuations and Outlook
Acquisition re-iterates Arvind’s transformation into a brand power house
Value Arvind at 6x
FY16E EV / EBITDA
Maintain ‘Buy’ with a price target of INR215
We expect ARVND’s revenue to post 20% CAGR over FY14-16E complimented by
100bp margin expansion due to improvement in brands and retail margins. Return
ratios are expected to improve further over FY14-16E with ROCE set to improve
from levels of 14.5% in FY14 to ~19% in FY16E and RoE from 14.2% in FY14 to 18.4%
in FY16E driven by improvement in margins and reduction in capex intensity.
Decade high return ratios and increased contribution from brands segment warrant
a re-rating in our view. We value ARVND at 6x FY16E EV/EBITDA, in line with 5 year
historical average multiple of 6.4x 1 year forward EV/EBITDA and arrive at a target
price of INR215. Maintain
Buy.
EV/EBITDA valuation (INRm)
EBITDA- FY16E
Target Multiple- 6x
Target Enterprise Value
Less:- Debt
Add:- Cash
Target Mcap
No of shares
Value per share
14,503
6.0
86,293
34,108
3,372
55,557
258.0
215
Source: Company, MOSL
Arvind one year forward EV/EBITDA
Source: Company, MOSL
24 March 2014
6

Arvind Ltd
Financials and valuation
Consolidated - Income Statement
Y/E March
Net Sales
Cha nge (%)
EBITDA
Ma rgi n (%)
Depreci a ti on
EBIT
Int. a nd Fi na nce Cha rges
Other Income - Rec.
PBT bef. EO Exp.
EO Expens e/(Income)
PBT after EO Exp.
Current Ta x
Deferred Ta x
Ta x Ra te (%)
Reported PAT
PAT Adj for EO items
Cha nge (%)
Ma rgi n (%)
Les s : Mi onri ty Interes t
Net Profit
FY12
49,251
20.6
6,022
12.2
1,614
4,408
3,091
1,185
2,502
-2,450
4,953
622
-28
12.0
4,359
2,202
33.2
4.5
0.1
2,202
0.0
FY13
52,925
7.5
6,874
13.0
2,043
4,831
3,153
806
2,483
0
2,483
58
-56
0.1
2,481
2,481
12.6
4.7
-3.4
2,484
0.0
FY14E
66,519
25.7
9,273
13.9
2,418
6,855
3,727
562
3,690
0
3,690
369
0
10.0
3,321
3,321
33.9
5.0
-3.4
3,324
0.0
(INR Million)
FY15E
80,908
21.6
11,691
14.5
2,720
8,971
4,335
709
5,345
0
5,345
1,069
0
20.0
4,276
4,276
28.8
5.3
-3.4
4,279
0.0
FY16E
96,622
19.4
14,503
15.0
2,977
11,526
4,571
760
7,715
0
7,715
1,929
0
25.0
5,786
5,786
35.3
6.0
-3.4
5,790
0.0
Consolidated - Balance Sheet
Y/E March
Equi ty Sha re Ca pi ta l
Tota l Res erves
Preference Ca pi ta l
Net Worth
Mi nori ty Interes t
Deferred Li a bi l i ti es
Tota l Loa ns
Capital Employed
Gros s Bl ock
Les s : Accum. Deprn.
Net Fixed Assets
Ca pi ta l WIP
Total Investments
Curr. Assets, Loans&Adv.
Inventory
Account Recei va bl es
Ca s h a nd Ba nk Ba l a nce
Loa ns a nd Adva nces
Curr. Liability & Prov.
Account Pa ya bl es
Provi s i ons
Net Current Assets
Appl. of Funds
E: MOSL Es ti ma tes
FY12
2,580
17,738
0
20,318
91
189
21,283
41,881
39,668
13,737
25,932
1,918
417
25,827
11,261
6,422
709
7,435
12,213
11,206
1,006
13,614
41,881
0.0
FY13
2,580
19,959
0
22,540
108
58
24,608
47,313
42,875
15,930
26,945
2,076
678
32,635
14,129
7,547
1,856
9,104
15,021
14,130
891
17,614
47,313
0.0
FY14E
2,580
22,650
0
25,230
108
58
30,608
56,004
48,375
18,348
30,027
2,129
678
41,956
18,574
9,659
2,798
10,924
18,785
17,816
969
23,171
56,004
0.0
(INR Million)
FY15E
2,580
26,159
0
28,740
108
58
33,608
62,513
52,375
21,069
31,306
2,427
678
51,136
23,345
11,527
3,156
13,109
23,035
21,971
1,063
28,102
62,513
0.0
FY16E
2,580
31,179
0
33,760
108
58
34,108
68,033
55,875
24,046
31,829
2,416
678
61,007
28,139
13,765
3,372
15,731
27,897
26,721
1,176
33,110
68,033
0.0
24 March 2014
7

Arvind Ltd
Financials and valuation
Ratios
Y/E March
Basic (INR)
EPS
Ca s h EPS
BV/Sha re
DPS
Pa yout (%)
Valuation (x)
P/E
Ca s h P/E
P/BV
EV/Sa l es
EV/EBITDA
Di vi dend Yi el d (%)
Return Ratios (%)
RoE
RoCE
Working Capital Ratios
As s et Turnover (x)
Inventory (Da ys )
Debtor (Da ys )
Leverage Ratio (x)
Current Ra ti o
Debt/Equi ty
11.8
13.9
1.2
83.5
47
2.1
1.0
FY12
8.5
14.8
78.7
1.0
6.9
FY13
9.6
17.5
87.4
1.7
20.1
15.5
8.5
1.7
1.1
8.8
1.1
11.6
12.7
1.1
97.4
51
2.2
1.1
FY14E
12.9
22.2
97.8
2.1
19.1
11.6
6.7
1.5
1.0
7.1
1.4
13.9
14.4
1.2
101.9
52
2.2
1.2
FY15E
16.6
27.1
111.4
2.6
18.0
9.0
5.5
1.3
0.8
5.9
1.7
15.9
16.4
1.3
105.3
51
2.2
1.2
FY16E
22.4
34.0
130.8
2.6
13.3
6.6
4.4
1.1
0.7
4.7
1.7
18.5
18.9
1.4
106.3
51
2.2
1.0
Consolidated - Cash Flow Statement
Y/E March
Net Profi t / (Los s ) Before Ta x a nd E
Depreci a ti on
Interes t & Fi na nce Cha rges
Di rect Ta xes Pa i d
(Inc)/Dec i n WC
CF from Operations
Others
CF from Operating incl EO
(i nc)/dec i n FA
(Pur)/Sa l e of Inves tments
Others
CF from Investments
Is s ue of Sha res
(Inc)/Dec i n Debt
Interes t Pa i d
Di vi dend Pa i d
Others
CF from Fin. Activity
Inc/Dec of Cash
Add: Begi nni ng Ba l a nce
Closing Balance
FY12
4,953
1,614
2,786
839
-1,874
6,640
-3,288
3,352
-2,324
136
2,523
335
0
-620
-2,944
0
0
-3,563
124
585
709
FY13
2,483
2,043
2,826
620
-1,700
5,033
-461
4,573
-2,815
-281
-213
-3,308
0
3,195
-3,014
-298
0
-117
1,147
709
1,856
FY14E
3,690
2,418
3,727
369
-4,614
4,852
0
4,852
-5,552
0
0
-5,552
0
6,003
-3,727
-634
0
1,642
942
1,856
2,798
(INR Million)
FY15E
5,345
2,720
4,335
1,069
-4,573
6,757
0
6,757
-4,299
0
0
-4,299
0
3,003
-4,335
-770
0
-2,101
358
2,798
3,156
FY16E
7,715
2,977
4,571
1,929
-4,792
8,542
0
8,542
-3,488
0
0
-3,488
0
503
-4,571
-770
0
-4,837
216
3,156
3,372
24 March 2014
8

Arvind Ltd
NOTES
24 March 2014
9

Disclosures
This report is for personal information of the authorized recipient and does not construe to be any investment, legal or taxation advice to you. This research report does not constitute an offer, invitation or
inducement to invest in securities or other investments and Motilal Oswal Securities Limited (hereinafter referred as MOSt) is not soliciting any action based upon it. This report is not for public distribution
and has been furnished to you solely for your information and should not be reproduced or redistributed to any other person in any form.
Unauthorized disclosure, use, dissemination or copying (either whole or partial) of this information, is prohibited. The person accessing this information specifically agrees to exempt MOSt or any of its
affiliates or employees from, any and all responsibility/liability arising from such misuse and agrees not to hold MOSt or any of its affiliates or employees responsible for any such misuse and further agrees
to hold MOSt or any of its affiliates or employees free and harmless from all losses, costs, damages, expenses that may be suffered by the person accessing this information due to any errors and delays.
The information contained herein is based on publicly available data or other sources believed to be reliable. While we would endeavour to update the information herein on reasonable basis, MOSt and/or
its affiliates are under no obligation to update the information. Also there may be regulatory, compliance, or other reasons that may prevent MOSt and/or its affiliates from doing so. MOSt or any of its
affiliates or employees shall not be in any way responsible and liable for any loss or damage that may arise to any person from any inadvertent error in the information contained in this report. MOSt or any
of its affiliates or employees do not provide, at any time, any express or implied warranty of any kind, regarding any matter pertaining to this report, including without limitation the implied warranties of
merchantability, fitness for a particular purpose, and non-infringement. The recipients of this report should rely on their own investigations.
This report is intended for distribution to institutional investors. Recipients who are not institutional investors should seek advice of their independent financial advisor prior to taking any investment decision
based on this report or for any necessary explanation of its contents.
MOSt and/or its affiliates and/or employees may have interests/positions, financial or otherwise in the securities mentioned in this report. To enhance transparency, MOSt has incorporated a Disclosure of
Interest Statement in this document. This should, however, not be treated as endorsement of the views expressed in the report.
Disclosure of Interest Statement
1. Analyst ownership of the stock
2. Group/Directors ownership of the stock
3. Broking relationship with company covered
4. Investment Banking relationship with company covered
ARVIND LTD
No
No
No
No
Arvind Ltd
Analyst Certification
The views expressed in this research report accurately reflect the personal views of the analyst(s) about the subject securities or issues, and no part of the compensation of the research analyst(s) was, is,
or will be directly or indirectly related to the specific recommendations and views expressed by research analyst(s) in this report. The research analysts, strategists, or research associates principally
responsible for preparation of MOSt research receive compensation based upon various factors, including quality of research, investor client feedback, stock picking, competitive factors and firm revenues.
This report is not directed or intended for distribution to or use by any person or entity resident in a state, country or any jurisdiction, where such distribution, publication, availability or use would be contrary
to law, regulation or which would subject MOSt & its group companies to registration or licensing requirements within such jurisdictions.
Regional Disclosures (outside India)
This report is intended for distribution only to persons having professional experience in matters relating to investments as described in Article 19 of the Financial Services and Markets Act 2000 (Financial
Promotion) Order 2005 (referred to as "investment professionals"). This document must not be acted on or relied on by persons who are not investment professionals. Any investment or investment activity
to which this document relates is only available to investment professionals and will be engaged in only with such persons.
For U.K.
Motilal Oswal Securities Limited (MOSL) is not a registered broker - dealer under the U.S. Securities Exchange Act of 1934, as amended (the"1934 act") and under applicable state laws in the United
States. In addition MOSL is not a registered investment adviser under the U.S. Investment Advisers Act of 1940, as amended (the "Advisers Act" and together with the 1934 Act, the "Acts), and under
applicable state laws in the United States. Accordingly, in the absence of specific exemption under the Acts, any brokerage and investment services provided by MOSL, including the products and services
described herein are not available to or intended for U.S. persons.
This report is intended for distribution only to "Major Institutional Investors" as defined by Rule 15a-6(b)(4) of the Exchange Act and interpretations thereof by SEC (henceforth referred to as "major
institutional investors"). This document must not be acted on or relied on by persons who are not major institutional investors. Any investment or investment activity to which this document relates is only
available to major institutional investors and will be engaged in only with major institutional investors. In reliance on the exemption from registration provided by Rule 15a-6 of the U.S. Securities Exchange
Act of 1934, as amended (the "Exchange Act") and interpretations thereof by the U.S. Securities and Exchange Commission ("SEC") in order to conduct business with Institutional Investors based in the
U.S., MOSL has entered into a chaperoning agreement with a U.S. registered broker-dealer, Motilal Oswal Securities International Private Limited. ("MOSIPL"). Any business interaction pursuant to this
report will have to be executed within the provisions of this chaperoning agreement.
The Research Analysts contributing to the report may not be registered /qualified as research analyst with FINRA. Such research analyst may not be associated persons of the U.S. registered broker-
dealer, MOSIPL, and therefore, may not be subject to NASD rule 2711 and NYSE Rule 472 restrictions on communication with a subject company, public appearances and trading securities held by a
research analyst account.
For U.S.
Motilal Oswal Capital Markets Singapore Pte Limited is acting as an exempt financial advisor under section 23(1)(f) of the Financial Advisers Act(FAA) read with regulation 17(1)(d) of the Financial
Advisors Regulations and is a subsidiary of Motilal Oswal Securities Limited in India. This research is distributed in Singapore by Motilal Oswal Capital Markets Singapore Pte Limited and it is only directed
in Singapore to accredited investors, as defined in the Financial Advisers Regulations and the Securities and Futures Act (Chapter 289), as amended from time to time.
In respect of any matter arising from or in connection with the research you could contact the following representatives of Motilal Oswal Capital Markets Singapore Pte Limited:
Anosh Koppikar
Kadambari Balachandran
Email:anosh.Koppikar@motilaloswal.com
Email : kadambari.balachandran@motilaloswal.com
Contact(+65)68189232
Contact: (+65) 68189233 / 65249115
Office Address:21 (Suite 31),16 Collyer Quay,Singapore 04931
For Singapore
Motilal Oswal Securities Ltd
24 March 2014
Motilal Oswal Tower, Level 9, Sayani Road, Prabhadevi, Mumbai 400 025
Phone: +91 22 3982 5500 E-mail: reports@motilaloswal.com
10