29 Nov 2012
Technology
TECHNOLOGY: Takeaways from management meetings; Expect
3Q to remain soft; Decision making continues to be slow
We met with managements of IT companies to get a sense on CY13 client budgets
and their expectations for the current quarter. Key Takeaways:
While it is still early to ascertain clients’ budgets for CY13, companies are not
worried about the same. Deal pipeline is not shrinking, suggesting continued
growth. However, discretionary spending remains weak and decision making
continues to be slow.
3QFY13 is expected to be a weak quarter. Furloughs are likely to impact onsite
volumes at some companies as much as 4 working days (6% of onsite volumes
assuming a 65 working day quarter). Given anticipated drop in utilization,
margins too are likely to soften.
Pricing discipline has been maintained by competition at large and companies
do not expect any pressures on that front. Outlook remains for stable pricing.
1. HCL TECH: Expect strong deal signings led by higher win rates,
healthy pipeline; margins to remain above 16.5%
Deal pipeline of HCL Tech (HCLT IN, CMP INR643, Mkt cap USD8.1b, Buy) in ITO
remains healthy with USD61b worth of deals in the market expected in 2HCY12.
Total deals in CY13 is expected to increase to USD120b from USD102b in CY12.
HCL’s win ratios in the past have been 25‐30% and have improved now. The
company would be disappointed with win ratios of less than 40%.
ITO and IMS market remain lucrative. Of the total USD273b worth of churn deals
expected between Oct 2012 – Dec 2014, two‐thirds fall in these two segments.
Healthy deal pipeline coupled with improved win ratios indicate likelihood of
strong TCV of deal signings in the next two quarters.
While the opportunity in ITO / IMS have made other players focus on these
segments as well, HCL expects its early mover advantage and higher end
capabilities in full ITO deals to hold it in good stead.
Margins are expected to be stable. Residual impact of wage hikes and increased
investments in hunting are headwinds to the margins, but the company expects
gradual improvement in the pyramid and maturation of large deals to help
offset the same.
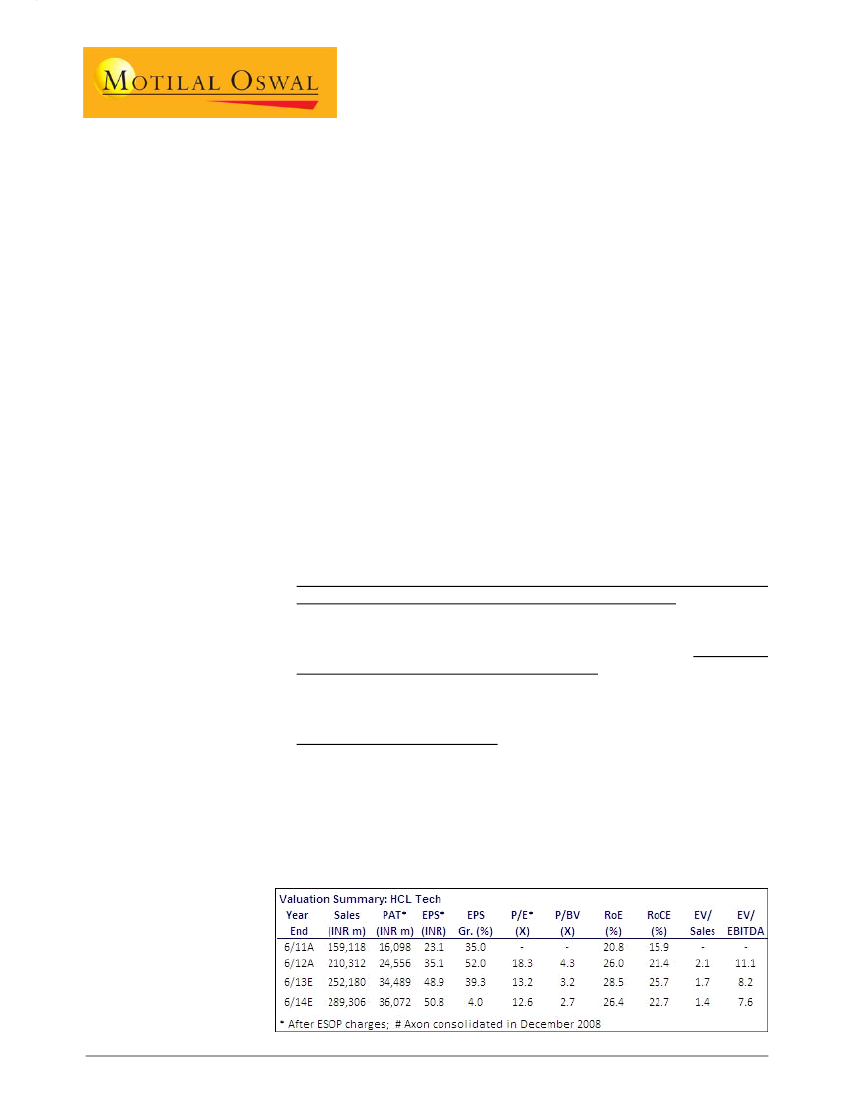
The stock trades 13.2x FY13x and 12.6x FY14E. Higher revenue growth visibility
at HCL compared to peers coupled with healthy margin performance make a
case for higher multiples. Maintain Buy with TP of INR712 (14x FY14 EPS), 11%
upside.
1
 Motilal Oswal Financial Services
Technology
Renewal deal pipeline remains healthy, improved win ratios will help grab sizeable
TCV of deals
Deal pipeline in ITO remains healthy. Of the USD61b worth of deals in the
market expected in 2HCY12, USD25b were reported in 3QCY12 and USD36b are
expected in the last quarter.
Total deals in CY13 are expected to increase to USD120b in from USD102b in
CY12. TPI’s estimate for deals in CY14 is USD113b.
While HCL Tech earlier used to have win ratios of 25‐30%, it has gone on to
improve the same. 1QFY13 win ratio was 51%. While this was an exceptional
quarter, the company suggests that win ratios below 40% will be disappointing.
This augurs well for the total TCV of deals signed during the deal closure‐heavy
period.
USD61b worth deals are expected in 2HCY12
Majority of the deals in the next 9 quarters are in IMS and full ITO
Not worried about competition; ITO constitutes the largest proportion of deals
The increased number of deals TCV in the churn market has made the space
lucrative for more players than HCL alone, as a result of which competition is
likely to be higher. HCL has been largely competing with the likes of IBM,
Accenture and Cap Gemini in the past.
The company however, is not perturbed about the increase in competition from
Indian vendors. Of the total USD273b worth of deals expected between Oct
2012 – Dec 2014, USD184b are in ITO / IMS. These are HCL Tech’s strength, and
while the opportunity has made other players focus on them, HCL expects its
early mover advantage and higher end capabilities compared to peers to hold it
in good stead.
While RTB will drive growth, CTB will not be dismal despite challenged
discretionary spending
Weak macro has meant that majority of the deals fall in the RTB (Run‐The‐
Business) space, while CTB (Change‐The‐Business) spends remain sluggish. The
company expects RTB spends to drive growth going forward given plenty of deal
opportunities presented by the pipeline.
However, the company is not very worried around growth in the EAS segment,
despite muted spends on smaller discretionary projects in the medium term. It
has successfully managed to unlock capital in clients’ CTB spends after making
entry through RTB spends. Additionally, significant acceleration in transition to
29 Nov 2012
2
 Motilal Oswal Financial Services
Technology
cloud based solutions and Mobility solutions are showing fast growth, albeit on
a small base.
EAS declined QoQ, while IMS drove growth during the quarter
Does not expect margins to breach guidance as multiple headwinds will be offset
by tailwinds from growth
Margins in 2QFY13 will see headwinds from: [1] residual impacts from wage
hikes (100bp QoQ impact), [2] increased investment in hunting (SGA has come
down by 140bp from 14.4% in 2QFY12 to 13% in 1QFY13) and [3] Transition
costs in the new deals expected to kick‐start after deal signings during the
quarter.
Also, the company saw multiple levers exercised in FY12 that aided margin
expansion apart from currency: [1] Utilization including trainees is the highest in
the last 10 quarters (74.2%), [2] Revenue from Fixed price contracts improved
720bp YoY to 51.2% and [3] Revenue proportion from offshore expanded 200bp
YoY to 44.3%
Despite the headwinds and significant extraction of tailwinds, HCL Tech expects
growth and continued maturity of large deals will help it maintain its margin
above 16.5%, as there may be room for more offshoring and also, more
significantly, improvement of the employee pyramid, two of its key margin
levers.
Multiple revenue levers have been exercised, driving uptick
in margins, apart from benefits from currency
2.TECH MAHINDRA: Multiple trends drive positive outlook on
organic growth outside BT; Focus on client mining continues at
Satyam; Buy with 29% upside
Internal cost optimization at BT has been hurting revenues from top‐account for
Tech Mahindra (TECHM IN, CMP INR893, Mkt cap USD2.1b, Buy). Revenues from
the account are expected to remain sluggish despite some growth from
broadband and data segments.
29 Nov 2012
3
 Motilal Oswal Financial Services
Technology
Outside BT, organic growth in Tech Mahindra is expected to at least match
industry growth. Trends like vendor consolidation, offshoring by potentially
under‐outsourced clients, emerging markets have kept the growth engine
fuelled.
Accounts like AT&T
continue
to hold potential to offshore more to the
company. Couple of recent large deals will result in an increase in the number of
clients in the higher revenue brackets.
At Mahindra Satyam, with annualized revenue per client at USD5.5m (USD8m
for larger peers), mining potential in remains significant, and can potentially
drive impressive growth. Pipeline in Manufacturing continues to be healthy.
While client‐specific traction has resulted in impressive growth at BFSI, the
company aims to diversify revenue base in the same.
TECHM trades at 10x FY13E and 8.5x FY14E EPS. We expect the company to
match, if not beat, industry’s performance, despite the exposure to the
challenged Telecom vertical, and estimate USD revenue CAGR of 12% over FY12‐
14 and an EPS CAGR of 22% during this period. Maintain Buy with a TP of
INR1150 (11x FY14 EPS), 29% upside.
Headwinds to revenue from BT on account of internal cost optimization
Revenues from BT declined 3.8% QoQ in 2QFY13 for Tech Mahindra, with
current quarterly run‐rate at USD98m. While re‐tendering activity did take a
breather, BT continues with its internal cost optimization measures, driving
expectation of sluggish revenues from the same. While there do not seem
chances of revenue uptick from BT, there may be some more declines in the
account, going forward.
Spends in Telecom have been muted and incremental spends have been driven
by the wireless segment, where BT’s limited presence has impacted IT spends.
However, within the account, there has been some growth in wireless and data
services segments.
Downward trend in revenues from BT may continue going forward
Growth in non‐BT accounts remains impressive, helped by HGS
acquisition revenues in 2Q
29 Nov 2012
4
 Motilal Oswal Financial Services
Technology
Prospects of organic growth outside BT remain healthy
Tech Mahindra’s second largest customer continues to grow healthily for the
company, with significant room still existing to increase the wallet share. IT
spend at AT&T is multiple times that in BT, presenting opportunity for sustained
growth in that account going forward.
Also, ramps ups from deals signed like that with Royal KPN will add further
incremental revenues. Tech Mahindra revenues have been impacted negatively
by ~USD30m on account of Etisalat, order cancellation by Cox communications
and some rationalization in low margin Indian BPO accounts. There will be no
further impact YoY in FY14 from these factors
BPO has significantly outperformed other segments, driving revenue growth
Multiple trends driving growth; confident of growing in‐line with of better than
industry (ex‐BT)
Trends driving growth for Tech Mahindra are: [1] vendor consolidation, [2]
incremental outsourcing from under‐outsourced clients, [3] emerging markets
and [4] technologies like Network, Cloud, Mobility and Analytics.
The company is chasing two very large deals in the Managed Services space,
although decision making remains slow in the same. The segment currently
contributes 15‐16% to company’s revenues.
Mahindra Satyam: Mining potential will continue to be tapped to drive growth
Annualized revenue per client at Mahindra Satyam is ~USD5.5m, significantly
lower than that of larger sized peers, where annualized revenue per client is
upwards of USD8m for the larger peers. Given that the company has a
significant number of clients in F‐500 / G‐2000 space, the potential to mine
clients better is a clear opportunity that could drive growth. The company
continues to invest efforts in achieving the same.
Manufacturing and BFSI have been strong verticals for the company. Pipeline in
Manufacturing remains healthy. Revenue in BFSI, however, is concentrated
among few clients, and client specific traction has driven growth in revenues in
the vertical. The company aims to diversify its revenue base going forward.
29 Nov 2012
5
 Motilal Oswal Financial Services
Technology
Growth at Satyam has accelerated over the past 3 quarters,
Manufacturing and BFSI have been stronger verticals
Margins to remain range‐bound at both the companies with wage hikes out of the
way
While full quarter revenue from HGS will impact margins at Tech Mahindra from
the next quarter, the company does not see any significant downward shift in its
margin trajectory. Cost optimization measures will help maintain margins within
a band.
At Satyam too, there are no significant headwinds to margins, with wage hikes
behind both the companies. Utilization at Satyam is 72.3%, a potential margin
lever. Also, if growth does come largely from top accounts’ farming, there will
be scale benefits helping margins.
TECHM: both EBITDA margin and Utilization have inched up in the last Satyam: Margins have expanded on multiple levers including SGA
rationalization
few quarters ,
3.PERSISTENT SYSTEMS: Traction continues in both IP‐driven and
non‐IP businesses; changing business mix augurs well for margin
profile
Persistent’s (PSYS IN, CMP INR479, Mkt cap USD345m, Neutral) thrust on IP‐led
revenues saw the segment contribute 18.9% in 2QFY13. The company continues
to assess hundreds of potential products, in order to increase its IP‐driven
revenue portfolio, and is contemplating expanding its product managers team
significantly.
6
29 Nov 2012
 Motilal Oswal Financial Services
Technology
While decision making continues to linger, the company is witnessing strong
traction in the non‐IP businesses as well. On its small base, PSYS reiterated its
intention of outperforming Nasscom’s modest growth outlook for the industry.
Gross margins in the IP‐led segment have been ~50‐55% at the portfolio level.
While these require higher selling spends, in a couple of these products, PSYS
obtains royalty revenue on sales by its client, thereby implying no outgo of sales
dollars. Higher proportion of IP revenues are favorably changing the company’s
margin profile.
PSYS has progressively increased its payout ratio from 7% in FY10 to 15% in FY11
and 16.4% in FY12. It expects payout ratio to continue increasing going forward
too.
PSYS trades at 9.7x FY13E and 8.7x FY14E EPS. We expect PSYS to grow its
revenues at a CAGR of 16.5% over FY12‐14 and an EPS CAGR of 26% during this
period. We believe that re‐rating will be a function of: [1] Sustained healthy
margins – which faces challenge from high attrition and little room to increase
offshore mix and [2] Greater predictability on revenues. Early signs of the same
emanate from company’s expectation of at least USD32m annual revenues from
(currently) 5 revenue streams in the IP‐driven segment. Our target price of
INR495 discounts FY14E EPS by 9x. Neutral.
Heightened focus on IP‐driven revenues – continuing to scout for more products
Revenue proportion from IP‐driven businesses was a positive surprise at PSYS in
2QFY13. The company’s strong thrust on this segment indicates that revenue
contribution may further increase over time. Persistent is looking at hundreds of
products in the market, where it could seek to obtain the IP and add to its
basket of IP‐driven revenue streams. The company is also contemplating adding
significant number of product managers, who can drive the business with an in‐
depth know‐how of the product environment.
Currently, PSYS derives IP revenues from 5 sources – PaxPro, Doyenz rCloud,
Royalty revenues, connectors and Location business from OpenWave. Annual
stable revenue stream from these products currently stands at USD32m (~13%
of revenues 2QFY13 annualized revenues).
29 Nov 2012
7
 Motilal Oswal Financial Services
Technology
T
USD r
revenue growth picking up with increasing contribution from IP
P‐
led bu
usiness ,
IP‐led reven
nues have seen a
a significant sur
rge in the last 4 quarters
on PSYS’ ass
set‐buying spree
e
Curre
ency and busines
ss mix shift in fav
vor of IP‐led revenues have help
p
grow margins
Traction in
n non‐IP busin
ness remains
s strong
While decision making continue to linger, the compan is witnessi strong
es
ny
ing
traction in the no
on‐IP busines
sses as well. On its sma base, the company
all
reiterated its intention of outgr
rowing the N
Nasscom’s mo
odest growth rates for
h
the ind
dustry.
It had earlier cited that deal pipeline has in
ncreased by 2
20‐25% v/s that in the
previou
us quarter. A
Also, it will ge
et back to hir
ring after 4 consecutive quarters of
net hea
adcount redu
uction, and will add ~600 n
net employee
es in 2HFY13.
Margin pro
ofile improve
ement driven
by changing
business mix
x
EBITDA margin at P
A
PSYS has mov up from 19% in 2QFY to 27% in 2QFY13.
ved
Y13
n
While currency m
made a sign
nificant contribution tow
wards the same, the
compa
any’s changing
g business m
mix in favor of
f IP‐led reven
nues has also played its
part. R
Revenues from
m IP‐driven se
egments cont
tributed 18.9
9% in 2QFY13
3, v/s 7.6%
in 2QFY
Y12.
Gross margins in th
he IP‐led segm
ment have be
een ~50‐55% at the portf
%
folio level.
While these requir higher sell
re
ling spends, in a couple of these PSY obtains
YS
royalty
y revenue on sales by its c
client, thereby implying no
o outgo of sales dollars
from PSYS. Higher proportion
of IP revenues are fa
r
avorably changing the
compa
any’s margin p
profile.
Progressively better payout ratio is expect
ted to continue t
to increase
 Motilal Oswal Financial Services
Technology
Dividend payout likely to continue increasing
At the time of listing, PSYS had indicated that payout ratio would be between
10‐30%. The company has progressively increased its payout ratio from 7% in
FY10 to 15% in FY11 and 16.4% in FY12. It expects payout ratio to continue
increasing going forward too, which is a positive for the stock from valuations
perspective.
4.KPIT CUMMINS: Expect sequential revenue and margin decline
in 3Q; To raise debt following capital infusion
3Q is expected to be a soft quarter for KPIT Cummins (KPIT IN, CMP INR128, Mkt
cap USD427m, Buy) with revenue expected to decline sequentially on account of
furloughs and the resulting drop in utilization is expected to drive QoQ margin
decline by 50‐100bp.
The company remains confident of bettering the lower end of guided revenue
band for FY13 (USD408‐418m). Its revenue in 2QFY13 was USD103.6m, and the
company expects to exit the year with at least USD108m, after a sequential
decline in 3QFY13.
KPIT’s impending cash outflows towards earn‐outs and raising the stake in
Systime from 76%
100% are as follows: [1] USD15‐16m towards Sparta and
USD2m towards CPG in 3QFY13, [2] USD20‐24m towards increasing stake in
Systime to 100% in 1QFY14, and [3] USD3m in CPG in FY14. In INR terms, these
amount to INR2.2b by 1QFY14. The company has raised INR1.6b through capital
infusion and is expected to raise additional debt of ~INR1b.
Top account, Cummins, is expected to moderate in 3Q and revenues may be soft
going forward too. Cummins has announced cut in costs overall after a muted
outlook on revenue growth, and the same is likely to impact IT budgets too,
having direct implications for KPIT.
The stock trades at 11.8x FY13E and 9.8x FY14E EPS. While we remain positive
on the company’s fundamental business strengths offered by a differentiated
positioning, returns from current levels are limited by soft outlook in the near
term and recent upside in the stock (~11% in 2 weeks). Our target price of
INR144 (13% upside) discounts FY14E EPS by 11x.
Expect 3Q to be a soft quarter with sequential decline in revenue and margins
3QFY13 is expected to be a soft quarter for KPIT
Revenue is expected to
decline sequentially on account of furloughs – resulting in loss of 4 days of
volumes QoQ and also due to closure of a project in top account Cummins,
impacting revenues by ~USD750k.
Also, the furloughs in the festive season are expected to impact the SAP
segment the most, driving drop in utilization in the same. Margins at SAP will as
a result, remain low, after falling to 7% in 2QFY13, as the company continues to
endeavor to align its skills post SAP’s acquisition of successfactors. As a result,
29 Nov 2012
9
 Motilal Oswal Financial Services
Technology
T
USD r
recvenue expect
ted to decline se
equentially, a firs
st in 14 quarters
s
3QFY13 may see a QoQ decline in overall E
e
EBITDA margins in the ran of 50‐
nge
100bp.
.
EBITDA mar
rgin expected to drop in 3Q on a
account of lower
r utilization,
driven by fu
urloughs
Confident of meeting th
he lower end
d of the reven
nue guidance
e for FY13
Despite
e QoQ decline in USD reve
enues, the co
ompany expre
essed its conf
fidence on
beating
g the lower e
end of the rev
venue guidan
nce of USD40
08‐418m. Its r
revenue in
2QFY13 was USD10
03.6m, and th
he company e
expects to exi
it the year with at least
USD10
08m, after a se
equential dec
cline in 3QFY1
13.
Also EB
BITDA margin
n in 1HFY13 w
was 15.9% and the compan
ny expects to
o exit FY13
with at
t least 16%, d
despite sequential margin d
decline in 3Q
QFY13E.
PAT w definitely beat higher end of the guidance de
will
y
r
espite signific
cant forex
losses in 2Q, as the guidance wa
as based on IN
NR50/USD, w
while currency
y has been
signific
cantly more fa
avorable.
Expec
cts to better low
wer end of the re
evenue guidance
e in FY13
Exit margin may exceed 16%
%
To raise De
ebt in additio
on to recent c
capital infusio
on to meet im
mpending ear
rn‐outs
KPIT’s impending c
cash outflow towards e
ws
earn‐outs and raising the stake in
d
e
Systime from 76%
100% are as follows: [1 USD15‐16m towards S
a
1]
m
Sparta and
USD2m towards CP in 3QFY1 [2] USD20
m
PG
13,
0‐24m towar increasing stake in
rds
g
Systime to 100% in 1QFY14, and
[3] USD3m in
n CPG in FY14
4.
Impend
ding earn‐ou up to 1Q
uts
QFY14 amoun to ~INR2.2 At the en of last
nt
2b.
nd
quarter, the compa had tota cash of IN
any
al
NR1.85b and debt worth INR2.38b.
Throug
gh capital infu
usion recently
y, KPIT raised
INR1.6b.
 Motilal Oswal Financial Services
Technology
T
The co
ompany will raise debt in a
addition to re
ecent capital funding, amo
ounting to
~INR1b The injection of funds will take ca of the ea
b.
are
arn‐outs, and the cash
d
levels w
will not drop as a result, a
a cushion which the comp
pany wants to
o maintain
in case
e any acquisition materializ
zes.
Cummins e
expected to t
taper off goin
ng forward
Cummins accounte for 19.7% of the com
ed
%
mpany’s reve
enues in 2QF
FY13. The
accoun
nt is expected
d to moderate
e in 3Q and r
revenues may
y be soft goin
ng forward
too. Cummins has announced cut in costs overall after a muted outlook on
r
ue growth, an
nd the same is likely to im
mpact IT budgets too, hav
ving direct
revenu
implica
ations for KPIT
T.
KPIT enjoys ~50% of the IT spe from Cummins, follo
end
owed by TCS and then
Infosys ~60% of th revenues from Cummin are towards business IT services
s.
he
f
ns
and the
e remaining t
towards Engin
neering.
Top client lik
kely to underper
rform company average perform
mance going for
rward following
g
commentary
y by Cummins
Looking for acquisitions
s in the engin
neering space
e and small p
pockets in SAP
P
The co
ompany cont
tinues to sco for acquisitions most in the En
out
tly
ngineering
space. In the Enter
rprises services segment, KPIT largely has the capa
abilities in
place, apart from so
ome pockets in SAP.
Acquisitions are no expected to
ot
o exceed the size of some of company’s recent
e
forays, thereby ind
,
dicating no significant de
s
eterioration of the Balan sheet.
nce
Organic capex of the company is
s expected to stay at ~USD
D7‐8m annually.
 Motilal Oswal Financial Services
Technology
Disclosures
This report is for personal information of the authorized recipient and does not construe to be any investment, legal or taxation advice to you. This research report does not constitute an offer, invitation or
inducement to invest in securities or other investments and Motilal Oswal Securities Limited (hereinafter referred as MOSt) is not soliciting any action based upon it. This report is not for public distribution
and has been furnished to you solely for your information and should not be reproduced or redistributed to any other person in any form.
Unauthorized disclosure, use, dissemination or copying (either whole or partial) of this information, is prohibited. The person accessing this information specifically agrees to exempt MOSt or any of its
affiliates or employees from, any and all responsibility/liability arising from such misuse and agrees not to hold MOSt or any of its affiliates or employees responsible for any such misuse and further agrees
to hold MOSt or any of its affiliates or employees free and harmless from all losses, costs, damages, expenses that may be suffered by the person accessing this information due to any errors and delays.
The information contained herein is based on publicly available data or other sources believed to be reliable. While we would endeavour to update the information herein on reasonable basis, MOSt and/or
its affiliates are under no obligation to update the information. Also there may be regulatory, compliance, or other reasons that may prevent MOSt and/or its affiliates from doing so. MOSt or any of its
affiliates or employees shall not be in any way responsible and liable for any loss or damage that may arise to any person from any inadvertent error in the information contained in this report . MOSt or any
of its affiliates or employees do not provide, at any time, any express or implied warranty of any kind, regarding any matter pertaining to this report, including without limitation the implied warranties of
merchantability, fitness for a particular purpose, and non-infringement. The recipients of this report should rely on their own investigations.
This report is intended for distribution to institutional investors. Recipients who are not institutional investors should seek advice of their independent financial advisor prior to taking any investment decision
based on this report or for any necessary explanation of its contents.
MOSt and/or its affiliates and/or employees may have interests/positions, financial or otherwise in the securities mentioned in this report. To enhance transparency, MOSt has incorporated a Disclosure of
Interest Statement in this document. This should, however, not be treated as endorsement of the views expressed in the report.
Disclosure of Interest Statement
1. Analyst ownership of the stock
2. Group/Directors ownership of the stock
3. Broking relationship with company covered
4. Investment Banking relationship with company covered
Technology
No
No
No
No
Analyst Certification
The views expressed in this research report accurately reflect the personal views of the analyst(s) about the subject securities or issues, and no part of the compensation of the research analyst(s) was, is,
or will be directly or indirectly related to the specific recommendations and views expressed by research analyst(s) in this report. The research analysts, strategists, or research associates principally
responsible for preparation of MOSt research receive compensation based upon various factors, including quality of research, investor client feedback, stock picking, competitive factors and firm revenues.
Regional Disclosures (outside India)
This report is not directed or intended for distribution to or use by any person or entity resident in a state, country or any jurisdiction, where such distribution, publication, availability or use would be contrary
to law, regulation or which would subject MOSt & its group companies to registration or licensing requirements within such jurisdictions.
For U.K.
This report is intended for distribution only to persons having professional experience in matters relating to investments as described in Article 19 of the Financial Services and Markets Act 2000 (Financial
Promotion) Order 2005 (referred to as "investment professionals"). This document must not be acted on or relied on by persons who are not investment professionals. Any investment or investment activity
to which this document relates is only available to investment professionals and will be engaged in only with such persons.
For U.S.
MOSt is not a registered broker-dealer in the United States (U.S.) and, therefore, is not subject to U.S. rules. In reliance on the exemption from registration provided by Rule 15a-6 of the U.S. Securities
Exchange Act of 1934, as amended (the "Exchange Act") and interpretations thereof by the U.S. Securities and Exchange Commission ("SEC") in order to conduct business with Institutional Investors
based in the U.S., Motilal Oswal has entered into a chaperoning agreement with a U.S. registered broker-dealer, Marco Polo Securities Inc. ("Marco Polo").
This report is intended for distribution only to "Major Institutional Investors" as defined by Rule 15a-6(b)(4) of the Exchange Act and interpretations thereof by SEC (henceforth referred to as "major
institutional investors"). This document must not be acted on or relied on by persons who are not major institutional investors. Any investment or investment activity to which this document relates is only
available to major institutional investors and will be engaged in only with major institutional investors.
The Research Analysts contributing to the report may not be registered /qualified as research analyst with FINRA. Such research analyst may not be associated persons of the U.S. registered broker-
dealer, Marco Polo and therefore, may not be subject to NASD rule 2711 and NYSE Rule 472 restrictions on communication with a subject company, public appearances and trading securities held by a
research analyst account.
Motilal Oswal Securities Ltd
Motilal Oswal Tower, Level 9, Sayani Road, Prabhadevi, Mumbai 400 025
Phone: +91 22 3982 5500 E‐mail: reports@motilaloswal.com
29 Nov 2012
12