5 April 2014
4QFY14 Results Update | Sector:
Capital Goods
BHEL
BSE SENSEX
22,360
Bloomberg
Equity Shares (m)
M.Cap. (INR b) / (USD b)
52-Week Range (INR)
1, 6, 12 Rel. Per (%)
S&P CNX
6,694
BHEL IN
2,447.6
450.2/7.5
208/100
5/16/-18
Financials & Valuation (INR Million)
Y/E MAR
Net Sales
EBITDA
Adj PAT
Adj.EPS(INR)
Gr. (%)
BV/Sh.(INR)
RoE (%)
RoCE (%)
P/E (x)
P/BV (X)
2014 2015E 2016E
387,725 317,823 350,020
47,216 33,706 47,570
33,789 23,557 36,659
14.4
-46
133
10.7
12.0
12.8
1.4
9.6
-33
140
7.1
6.9
19.1
1.3
15.0
56
149
10.4
10.1
12.3
1.2
CMP: INR184
TP: INR240
Buy
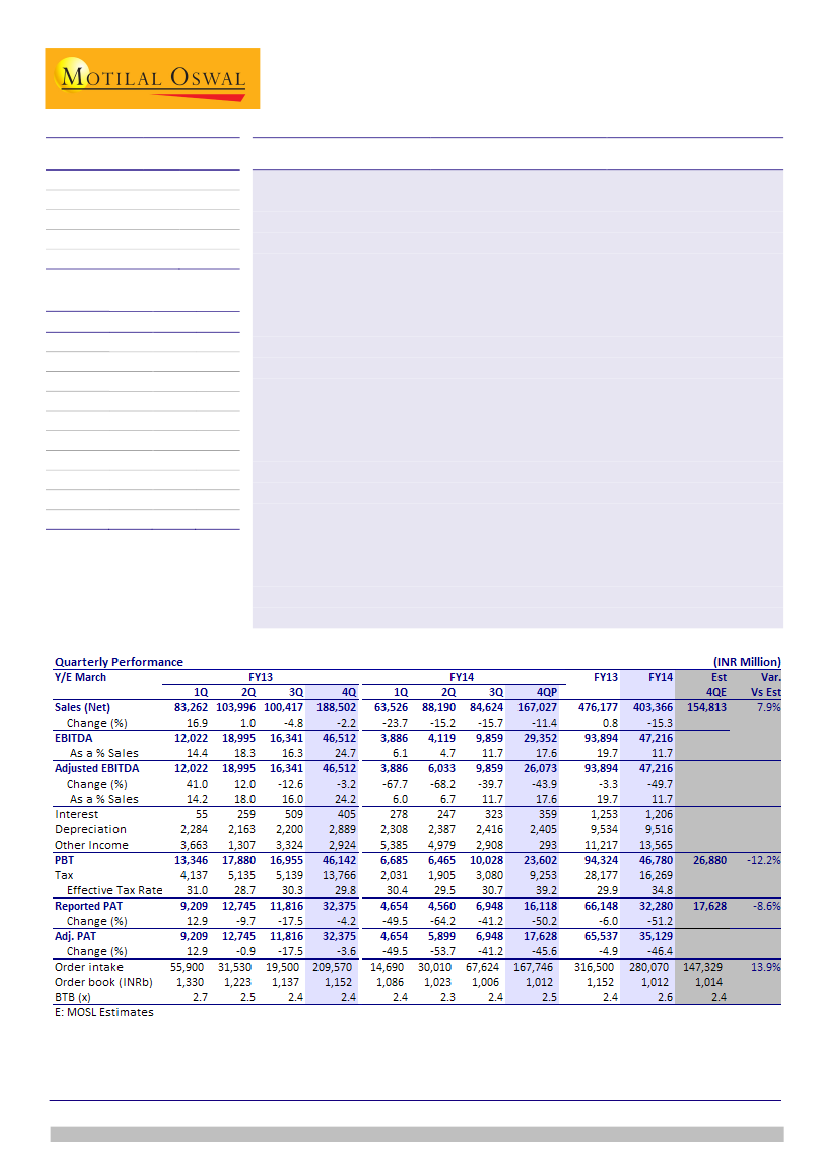
BHEL provisional numbers in-line with estimates:
margins possibly at
normative levels BHEL reported provisional FY14 earnings, with Revenues at
INR404b (down 19.5% YoY), PBT at INR46.8b (down 50% YoY) and PAT at
INR32.3b (down 51% YoY). The numbers are largely in-line with our estimates,
with Revenues at INR404b and PAT at INR33.8b (variance of 4.7%).
Order intake at INR280b in FY14 (vs INR317b in FY13), entails 4QFY14
intake at INR163b:
During 4QFY14, BHEL’s order intake stands at INR168b vs
INR112b in 9mFY14. Key orders received in 4Q includes: i) 1980MW NTPC North
Karanpura (EPC, INR80b), ii) 1600MW NTPC Darlipalli (Boilers, INR30b), iii) hydro
power projects in Punjab / J&K (INR13b), etc. In addition, we understand that
BHEL has emerged as L1 in i) 1320MW Ennore SEZ (EPC, INR78b) ii) 6X196MW
Pranhita Lift Irrigation (~INR25-30b) etc.
Maintain Buy, BHEL is strongly exposed to cyclical factors:
BHEL is strongly
exposed to cyclical factors: i) Contribution margins at ~40-41% vs expected
EBIDTA margin of 12.4% in FY14, leading to a meaningful operating leverage, ii)
Core NWC stable at ~200 days; cyclical factors of retention money (at ~200 days
in FY14E vs 55-60 days in FY07-09) and customer advances (deteriorated from
63% of revenues in FY09 to 34% in FY13) that impacted reported NWC are
expected to normalize, as we expect BTB to increase from 2.2x currently to 3x in
FY15/16E. We maintain
Buy
with a revised Price target of INR240/sh (16x FY16E),
30% upside.
Satyam Agarwal
(AgarwalS@MotilalOswal.com); +91 22 3982 5410
Nirav Vasa
(Nirav.Vasa@MotilalOswal.com); +91 22 3982 5422
Investors are advised to refer through disclosures made at the end of the Research Report.

BHEL
BHEL provisional numbers in-line with estimates; margins possibly at
normative levels
BHEL reported provisional FY14 earnings, with Revenues at INR404b (down
19.5% YoY), PBT at INR46.8b (down 50% YoY) and PAT at INR32.3b (down 51%
YoY). The numbers are largely in-line with our estimates, with Revenues at
INR404b and PAT at INR33.8b (variance of 4.7%). Adjusted for the PBT loss of
INR1.9b on merger of BHPV (largely related to readjustment of staff costs based
on BHEL’s norms for actuarial valuations, etc), we expect FY14 adjusted PAT at
INR35b (down 46% YoY).
Revenues were impacted given slow moving orders from private sector (at
~20%+ of the order book), and also delayed execution due to lack of regulatory
clearances, local issues, delays in payment / LCs, etc. Importantly, the
provisional results indicate that the margins have possibly bounced back to
more normative levels (1HFY14 margins at just 6.5% and were impacted by
higher provisions, etc).
BHEL: Provisional numbers vs Actual financials (INR B)
INR B
FY06
FY07
FY08
FY09
FY10
FY11
FY12
FY13
FY14
Provisional
Revenues
144.1
187.0
216.1
275.1
340.5
434.5
493.0
500.2
403.7
Net Profit
16.2
23.9
28.2
30.4
42.9
60.2
68.7
64.9
32.3
138.2
188.4
214.0
280.3
341.5
433.8
495.1
501.6
403.9
Actual #
Revenues
Net Profit
16.8
24.1
28.6
31.4
43.1
60.1
70.4
66.2
33.8
% Variation
Revenues
(4.1)
0.7
(1.0)
1.9
0.3
(0.2)
0.4
0.3
0.1
Net Profit
3.7
0.8
1.4
3.3
0.5
(0.2)
2.5
2.0
4.7
Source: MOSL, Company
Order intake at INR280b in FY14 (vs INR317b in FY13), entails 4QFY14 intake
at INR163b
During 4QFY14, BHEL’s order intake stands at INR168b vs INR112b in 9mFY14.
Key orders received in 4Q includes: i) 1980MW NTPC North Karanpura (EPC,
INR80b), ii) 1600MW NTPC Darlipalli (Boilers, INR30b), iii) hydro power projects
in Punjab / J&K (INR13b), etc. In addition, we understand that BHEL has
emerged as L1 in i) 1320MW Ennore SEZ (EPC, INR78b) ii) 6X196MW Pranhita
Lift Irrigation (~INR25-30b) etc.
BHEL’s order intake had declined from peak levels of ~INR600b in FY10/FY11 to
average levels of INR270b in FY12/FY13. Thus, FY14 intake at IINR280b has
remained at similar levels. Our statistical analysis of the macro data-points on
demand and supply dynamics in the power sector suggests that the new cycle of
powergen capex could commence over the next 12-15 months. 'Timing the
recovery' remains the key moving variable. However we believe that what
matters is not 'timing the project awards', but the time when markets believe
that project awards 'could possibly' commence. And that time is now.
(Refer our
detailed Thematic - BTG ordering: Emerging from the 'Eclipse', December 2013).
5 April 2014
2

BHEL
Order intake had improved in 4Q, led by NTPC project awards
Revenue de-growth given constrained environment
Source: Company
BHEL: 20% of power sector order book is slow moving, based on our understanding
Award
May-09
Mar-10
May-09
Jul-09
Mar-10
Mar-10
Mar-11
Mar-11
Sep-10
Oct-11
Mar-12
Project
Korba West Power Co Ltd
Bela TPP, Maharashtra
OPG Power, Gujarat
Malibrahmani, Angul TPP
Surana Power, Raichur TPP
Usha Jayaswal TPP
Indiabulls Nashik - Phase II
Indiabulls Amravati - Phase II
Raigarh TPP
Singrauli
Vizag
Total
% of Power sector order book
Customer
Avantha
Ideal Energy Projects
OPG
Monnet Power
Surana Power
Abhijit Group
Indiabulls
Indiabulls
Visa Power
Dainik Bhaskar
Abhijeet Projects
Source: Company
MW
600
270
270
525
420
540
1,350
1,350
600
1,320
300
7,545
INR B
12.9
7.0
6.8
13.2
11.4
12.7
28.9
28.9
13.3
37.8
6.3
179.1
21%
Source: MOSL, Company
Maintain Buy, BHEL is strongly exposed to cyclical factors
BHEL is strongly exposed to cyclical factors: i) Contribution margins at ~40-41%
vs expected EBIDTA margin of 12.4% in FY14, leading to a meaningful operating
leverage, ii) Core NWC stable at ~200 days; cyclical factors of retention money
(at ~200 days in FY14E vs 55-60 days in FY07-09) and customer advances
(deteriorated from 63% of revenues in FY09 to 34% in FY13) that impacted
reported NWC are expected to normalize, as we expect BTB to increase from
2.2x currently to 3x in FY15/16E.
We expect Free Cash Flows to improve from ~INR16-19b in FY13/14E to ~INR75-
88b in FY15/16E, leading to a sizeable increase in net cash from INR63b in FY13
to INR174b in FY16E (~40% of current market cap). We maintain
Buy
with a
revised Price target of INR240/sh (16x FY16E), 30% upside.
5 April 2014
3

BHEL
Operating Matrix
FY13
Order Intake (INR b)
Power
R&M
Industry
International Business
Cancellations
Total Order Intake
Order intake (GW)
Order backlog (INR B)
Power
Industry
International Business
Total Order backlog
Growth (%)
Segmental Revenues
Power
Industry
International Business
Total Revenues
EBITDA Margins (%)
Contribution Margins (%)
Staff Costs (%)
Other Expenses (%)
Employees (in 000)
INR 000/empl
Cash / (Debt), INR B
Cash
Retention Money
Debt
Net Cash / (Debt)
INR/sh
227
29
41
20
-
317
9.6
FY14E
162
30
47
25
-
264
6.0
FY15E
264
36
56
25
-
382
8.8
FY16E
217
44
73
25
-
359
7.2
933
115
104
1,152
43.2
792
97
123
1,012
(16.6)
822
98
142
1,063
44.7
789
108
161
1,058
(5.9)
396
100
6
502
19.4
42.1
11.9
10.9
49.4
1,177
333
65
6
404
12.4
42.7
15.1
15.2
48.4
1,247
270
55
6
331
10.3
42.6
18.8
13.5
49.9
1,247
295
64
6
365
13.3
42.4
17.0
12.2
48.4
1,285
77.3
168.5
-14.2
231.6
94.6
72.9
226.4
-14.1
285.2
116.5
125.4
183.7
-14.1
295.0
120.5
187.9
139.1
-14.1
312.9
127.9
Source: Company, MOSL
5 April 2014
4

Capital Goods
5
April 2014

BHEL
BHEL: an investment profile
Company description
Increase in retention money, due to delay in
BHEL is India’s dominant producer of power and
project commissioning schedules.
Operating Matrix
industrial machinery and a leading EPC company,
Industry segment is majorly dependent on captive
Source: Company, MOSL
established in the late 1950s as the government’s
power orders for its order inflows. Other segments
wholly-owned subsidiary.
like transportation & power T&D are still in
Please
currently
page
report….
Post divestment, the government
enter first
has an
of BTG
developing stage.
equity stake of 67.7%. The company has 14
manufacturing divisions, 8 service centers, 4 power
Recent developments
sector regional centers besides project sites spread
BHEL has finalized its plans to set up an integrated
across all over India and abroad.
plant for providing eng to end solutions for setting
It has a manufacturing capacity of 20GW spread
up a solar based power plant. Capex for the
across multiple factories in India.
proposed plant is INR30b.
Key investment arguments
Order backlog at the end of 4QFY14 stands at
Rs1trn, representing book to bill ratio of 2.2x.
With an installed capacity of 20GW, BHEL’s installed
capacity is the largest in India and is on par with its
Chinese and Korean counter parts thereby giving
BHEL sizeable competitive muscle to compete,
execute and deliver on time.
Valuation and view
We expect Free Cash Flows to improve from
~INR16-19b in FY13/14E to ~INR75-88b in
FY15/16E, leading to a sizeable increase in net cash
from INR63b in FY13 to INR174b in FY16E (~40% of
current market cap). We maintain
Buy
with a
revised Price target of INR240/sh (16x FY16E), 30%
upside.
Sector view
We maintain our positive view on the sector.
Key investment risks
20% of the order book (~ INR 200b) is slow moving.
Comparative valuations
P/E (x)
P/BV (x)
EV/Sales (x)
EV/EBITDA (x)
FY14E
FY15E
FY14E
FY15E
FY14E
FY15E
FY14E
FY15E
BHEL
13.1
19.5
1.4
1.3
1.0
1.1
8.4
10.2
L&T Crompton
22.7
26.4
17.8
12.6
22.7
1.9
2.5
2.0
1.6
0.6
1.4
0.5
14.9
11.8
12.3
8.0
EPS: MOSL forecast v/s consensus (INR)
MOSL
Forecast
FY15
FY16
9.6
15.0
Consensus
Forecast
14.9
13.4
Variation
(%)
-35.6%
11.7%
Target price and recommendation
Current
Price (INR)
184
Target
Price (INR)
240
Upside
(%)
30.4
Reco.
Neutral/Buy
Shareholding pattern (%)
Promoter
Domestic Inst
Foreign
Others
Dec-13
67.7
12.0
15.9
4.5
Sep-13
67.7
12.0
15.5
4.8
Dec-12
67.7
12.5
15.1
4.7
Stock performance (1-year)
5 April 2014
6

BHEL
Financials and valuation
Income statement
Y/E March
Revenues
Change (%)
EBITDA
EBITDA Margin (%)
Depreciation
EBIT
Interest
Other Income
Extraordinary items
PBT
Tax
Tax Rate (%)
Reported PAT
Adjusted PAT
Change (%)
(INR Million)
2013
2014
2015E
2016E
476,177 387,725 317,823 350,020
1
-19
-18
10
93,898 47,216 33,706 47,570
19.4
11.9
10.3
13.3
9,534
84,364
1,253
11,217
-4
94,324
28,177
29.9
66,148
65,540
-5
9,516
37,700
1,206
13,565
0
50,058
16,269
32.5
33,789
35,129
-46
10,664
23,042
1,155
12,254
0
34,141
10,584
31.0
23,557
23,557
-33
11,908
35,662
1,245
17,953
0
52,370
15,711
30.0
36,659
36,659
56
Ratios
Y/E March
Basic (INR)
EPS
Cash EPS
Book Value
DPS
Payout (incl. Div. Tax.)
Valuation(x)
P/E
Cash P/E
Price / Book Value
EV/EBITDA
Dividend Yield (%)
Profitability Ratios (%)
RoE
RoCE
Turnover Ratios (%)
Asset Turnover (x)
Debtors (No. of Days)
Inventory (No. of Days)
Creditors (No. of Days)
Leverage Ratios (%)
Net Debt/Equity (x)
2013
26.8
30.7
124.4
5.4
20.0
2014
14.4
18.2
133.3
4.1
30.0
2015E
9.6
14.0
139.6
2.9
30.0
2016E
15.0
19.8
149.3
4.5
35.1
6.9
6.0
1.5
4.1
2.9
23.7
31.1
1.8
300.7
88.7
97.5
-0.2
12.8
10.1
1.4
8.3
2.3
10.7
12.0
1.3
382.4
93.0
88.7
-0.2
19.1
13.2
1.3
10.1
1.6
7.1
6.9
1.0
398.9
99.7
84.1
-0.3
12.3
9.3
1.2
5.8
2.4
10.4
10.1
1.0
314.3
106.8
87.1
0.0
Balance sheet
Y/E March
Share Capital
Reserves
Net Worth
Debt
Deferred Tax
Total Capital Employed
Gross Fixed Assets
Less: Acc Depreciation
Net Fixed Assets
Capital WIP
Investments
Current Assets
Inventory
Debtors
Cash & Bank
Loans & Adv, Others
Curr Liabs & Provns
Curr. Liabilities
Provisions
Net Current Assets
Total Assets
2013
4,895
299,546
304,441
14,152
-15,507
303,086
107,832
63,248
44,585
11,716
4,292
625,185
117,638
398,882
77,321
31,344
382,692
293,270
89,421
242,493
303,086
2014
4,895
321,475
326,370
14,094
-15,507
324,958
117,634
72,005
45,630
5,000
4,292
614,786
100,808
414,470
72,946
26,562
344,750
247,862
96,888
270,036
324,958
(INR Million)
2015E
2016E
4,895
4,895
336,764 360,555
341,659 365,451
14,094 14,094
-15,507 -15,507
340,246 364,038
129,424 143,214
82,669 94,577
46,755 48,638
5,000
5,000
4,292
4,292
594,222 626,907
88,990 105,006
356,072 308,949
125,394 187,898
23,766 25,054
310,023 320,799
208,707 213,951
101,315 106,848
284,199 306,109
340,246 364,038
E: MOSL Estimates
Cash flow statement
Y/E March
OP/(Loss) before Tax
Depreciation
Others
Interest
Direct Taxes Paid
(Inc)/Dec in Wkg Cap
CF from Op. Activity
(Inc)/Dec in FA & CWIP
(Pur)/Sale of Invt
Others
CF from Inv. Activity
Inc/(Dec) in Net Worth
Inc / (Dec) in Debt
Interest Paid
Divd Paid (incl Tax)
CF from Fin. Activity
Inc/(Dec) in Cash
Add: Opening Balance
Closing Balance
2013
94,329
9,534
0
1,253
28,177
-8,217
31,108
-9,390
325
0
-9,065
-43
12,918
1,253
23,064
-11,442
10,601
66,720
77,321
2014
50,058
9,516
0
1,206
16,269
-8,409
15,567
-3,846
0
0
-3,846
0
-58
1,206
14,833
-16,097
-4,376
77,321
72,945
(INR Million)
2015E
34,141
10,664
0
1,155
10,584
53,947
75,196
-11,790
0
0
-11,790
0
0
1,155
9,803
-10,958
52,448
72,946
125,394
2016E
52,370
11,908
0
1,245
15,711
39,245
88,441
-13,790
0
0
-13,790
0
0
1,245
10,902
-12,147
62,504
125,394
187,898
5 April 2014
7

Disclosures
This report is for personal information of the authorized recipient and does not construe to be any investment, legal or taxation advice to you. This research report does not constitute an offer, invitation or
inducement to invest in securities or other investments and Motilal Oswal Securities Limited (hereinafter referred as MOSt) is not soliciting any action based upon it. This report is not for public distribution
and has been furnished to you solely for your information and should not be reproduced or redistributed to any other person in any form.
Unauthorized disclosure, use, dissemination or copying (either whole or partial) of this information, is prohibited. The person accessing this information specifically agrees to exempt MOSt or any of its
affiliates or employees from, any and all responsibility/liability arising from such misuse and agrees not to hold MOSt or any of its affiliates or employees responsible for any such misuse and further agrees
to hold MOSt or any of its affiliates or employees free and harmless from all losses, costs, damages, expenses that may be suffered by the person accessing this information due to any errors and delays.
The information contained herein is based on publicly available data or other sources believed to be reliable. While we would endeavour to update the information herein on reasonable basis, MOSt and/or
its affiliates are under no obligation to update the information. Also there may be regulatory, compliance, or other reasons that may prevent MOSt and/or its affiliates from doing so. MOSt or any of its
affiliates or employees shall not be in any way responsible and liable for any loss or damage that may arise to any person from any inadvertent error in the information contained in this report. MOSt or any
of its affiliates or employees do not provide, at any time, any express or implied warranty of any kind, regarding any matter pertaining to this report, including without limitation the implied warranties of
merchantability, fitness for a particular purpose, and non-infringement. The recipients of this report should rely on their own investigations.
BHEL
This report is intended for distribution to institutional investors. Recipients who are not institutional investors should seek advice of their independent financial advisor prior to taking any investment decision
based on this report or for any necessary explanation of its contents.
MOSt and/or its affiliates and/or employees may have interests/positions, financial or otherwise in the securities mentioned in this report. To enhance transparency, MOSt has incorporated a Disclosure of
Interest Statement in this document. This should, however, not be treated as endorsement of the views expressed in the report.
Disclosure of Interest Statement
1. Analyst ownership of the stock
2. Group/Directors ownership of the stock
3. Broking relationship with company covered
4. Investment Banking relationship with company covered
BHARAT HEAVY ELECTRICALS
No
No
No
No
Analyst Certification
The views expressed in this research report accurately reflect the personal views of the analyst(s) about the subject securities or issues, and no part of the compensation of the research analyst(s) was, is,
or will be directly or indirectly related to the specific recommendations and views expressed by research analyst(s) in this report. The research analysts, strategists, or research associates principally
responsible for preparation of MOSt research receive compensation based upon various factors, including quality of research, investor client feedback, stock picking, competitive factors and firm revenues.
This report is not directed or intended for distribution to or use by any person or entity resident in a state, country or any jurisdiction, where such distribution, publication, availability or use would be contrary
to law, regulation or which would subject MOSt & its group companies to registration or licensing requirements within such jurisdictions.
Regional Disclosures (outside India)
This report is intended for distribution only to persons having professional experience in matters relating to investments as described in Article 19 of the Financial Services and Markets Act 2000 (Financial
Promotion) Order 2005 (referred to as "investment professionals"). This document must not be acted on or relied on by persons who are not investment professionals. Any investment or investment activity
to which this document relates is only available to investment professionals and will be engaged in only with such persons.
For U.K.
Motilal Oswal Securities Limited (MOSL) is not a registered broker - dealer under the U.S. Securities Exchange Act of 1934, as amended (the"1934 act") and under applicable state laws in the United
States. In addition MOSL is not a registered investment adviser under the U.S. Investment Advisers Act of 1940, as amended (the "Advisers Act" and together with the 1934 Act, the "Acts), and under
applicable state laws in the United States. Accordingly, in the absence of specific exemption under the Acts, any brokerage and investment services provided by MOSL, including the products and services
described herein are not available to or intended for U.S. persons.
This report is intended for distribution only to "Major Institutional Investors" as defined by Rule 15a-6(b)(4) of the Exchange Act and interpretations thereof by SEC (henceforth referred to as "major
institutional investors"). This document must not be acted on or relied on by persons who are not major institutional investors. Any investment or investment activity to which this document relates is only
available to major institutional investors and will be engaged in only with major institutional investors. In reliance on the exemption from registration provided by Rule 15a-6 of the U.S. Securities Exchange
Act of 1934, as amended (the "Exchange Act") and interpretations thereof by the U.S. Securities and Exchange Commission ("SEC") in order to conduct business with Institutional Investors based in the
U.S., MOSL has entered into a chaperoning agreement with a U.S. registered broker-dealer, Motilal Oswal Securities International Private Limited. ("MOSIPL"). Any business interaction pursuant to this
report will have to be executed within the provisions of this chaperoning agreement.
The Research Analysts contributing to the report may not be registered /qualified as research analyst with FINRA. Such research analyst may not be associated persons of the U.S. registered broker-
dealer, MOSIPL, and therefore, may not be subject to NASD rule 2711 and NYSE Rule 472 restrictions on communication with a subject company, public appearances and trading securities held by a
research analyst account.
For U.S.
Motilal Oswal Capital Markets Singapore Pte Limited is acting as an exempt financial advisor under section 23(1)(f) of the Financial Advisers Act(FAA) read with regulation 17(1)(d) of the Financial
Advisors Regulations and is a subsidiary of Motilal Oswal Securities Limited in India. This research is distributed in Singapore by Motilal Oswal Capital Markets Singapore Pte Limited and it is only directed
in Singapore to accredited investors, as defined in the Financial Advisers Regulations and the Securities and Futures Act (Chapter 289), as amended from time to time.
In respect of any matter arising from or in connection with the research you could contact the following representatives of Motilal Oswal Capital Markets Singapore Pte Limited:
Anosh Koppikar
Kadambari Balachandran
Email:anosh.Koppikar@motilaloswal.com
Email : kadambari.balachandran@motilaloswal.com
Contact(+65)68189232
Contact: (+65) 68189233 / 65249115
Office Address:21 (Suite 31),16 Collyer Quay,Singapore 04931
For Singapore
Motilal Oswal Securities Ltd
5 April 2014
Motilal Oswal Tower, Level 9, Sayani Road, Prabhadevi, Mumbai 400 025
Phone: +91 22 3982 5500 E-mail: reports@motilaloswal.com
8