17 April 2014
3QFY14 Results Update | Sector:
Technology
HCL Technologies
BSE SENSEX
22,629
Bloomberg
Equity Shares (m)
52-Week Range (INR)
1, 6, 12 Rel. Per (%)
S&P CNX
6,779
HCLT IN
699.5
1,589/674
-3/21/69
CMP: INR1,424
TP: INR1,700
Buy
M.Cap. (INR b) / (USD b) 985.9/16.3
Financials & Valuation (INR Billion)
Y/E June
Sales
EBITDA
PAT
EPS (INR)
EPS Gr. (%)
2014E 2015E 2016E
330.1
86.6
61.2
86.4
51.6
371.4
91.4
71.0
99.7
15.3
360.9
36.1
30.8
14.3
9.5
426.8
102.0
80.1
111.7
12.0
446.6
30.8
27.7
12.8
9.8
BV/Sh.(INR) 279.1
41.2
RoE (%)
RoCE (%)
P/E (x)
EV/EBITDA
( )
34.7
16.5
10.5
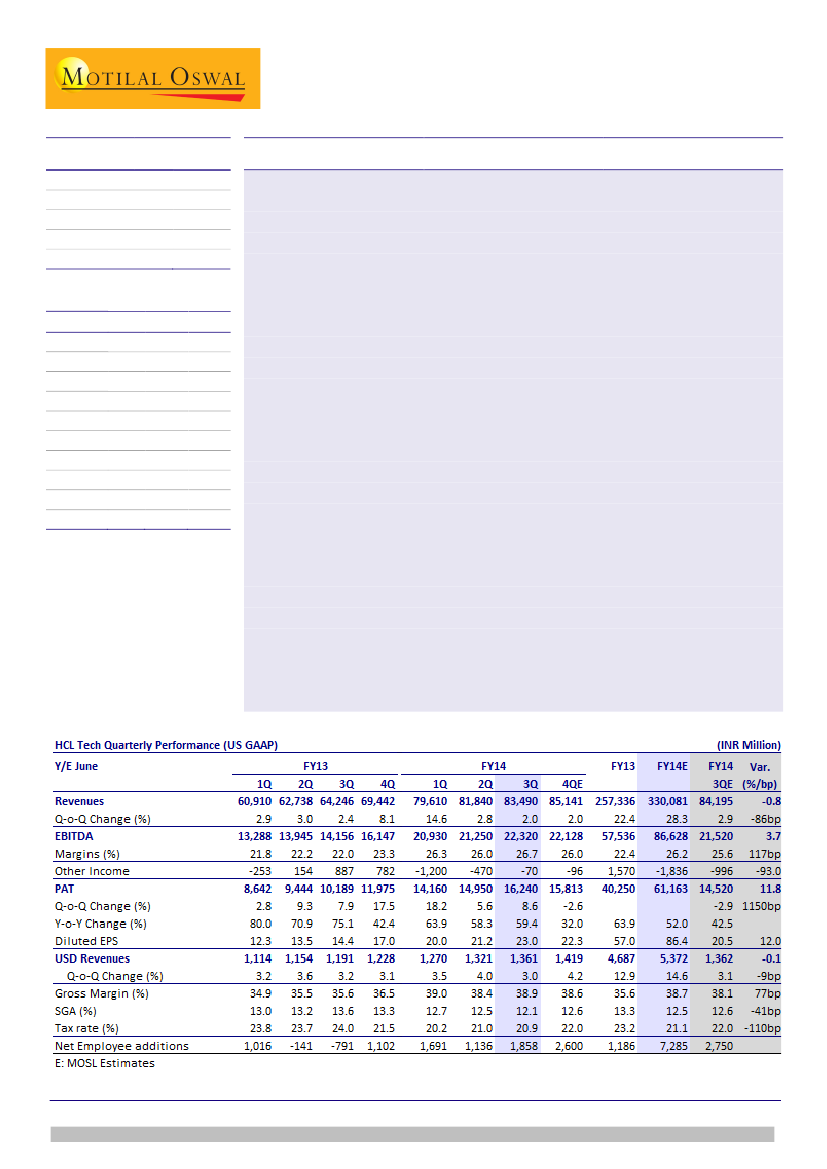
Higher OPM, lower forex loss results in higher than expected PAT:
HCLT’s USD
revenue for 3QFY14 grew 3% QoQ to USD1,361m, in line with our estimate of
USD1,362m. EBITDA margin expanded 70bp QoQ to 26.7%, higher than our
estimate of 25.6%. PAT grew 8.5% QoQ to INR16.2b, well above our estimate of
INR14.5b, led by higher operating income and lower forex losses (INR1.42b v/s our
estimate of INR2.4b).
Software Services gaining traction:
Software Services revenue grew 2% QoQ to
USD831m v/s our estimate of USD826m. IMS grew 5% QoQ v/s our estimate of
6.3% QoQ growth. BPO business declined 1.3% QoQ v/s our estimate of 2.2% QoQ
growth.
Deal wins remain healthy:
For the sixth quarter in a row, HCLT signed deals with a
TCV of over USD1b, taking total 9MFY14 TCV to USD3b+. HCLT has already signed
as many deals as it had announced in the full year FY13. It remains on track to sign
USD4b+ deals in FY14, which would translate into more than 30% growth
compared to the TCV announcements in FY13.
Efficiencies driving margin surprise:
Margin expansion was aided by 30bp QoQ
decline in SGA to 12.15% (our estimate: 12.6%). The company has been on course
for G&A rationalization for some time now, and had extracted 130bp from G&A
efficiencies over 2QFY13-2QFY14.
Visibility of growth acceleration; Buy:
Continued order closures keep revenue
growth prospects sanguine. While profitability may cool off, HCLT could continue
to surprise positively on efficiency gains. We expect HCLT to grow its USD revenue
at a CAGR of 15% and EPS at a CAGR of 14% over FY14-16. Improvement in
Software Services growth makes a case for stock re-rating. Our target price of
INR1,700 discounts FY16E EPS by 15x.
Buy.
Ashish Chopra
(Ashish.Chopra@MotilalOswal.com); +91 22 3982 5424
Siddharth Vora
(Siddharth.Vora@MotilalOswal.com); +91 22 3982 5585
Investors are advised to refer through disclosures made at the end of the Research Report.

HCL Technologies
3QFY14: Revenue in line; margin beat driven by IMS
HCL Tech’s 3QFY14 USD revenues grew 3% QoQ to USD 1,361m in line with our
estimate of USD1,362m; 3.1% QoQ growth in reported and CC terms. Revenues
in software services grew to USD 832.2m, +2.1% QoQ (v/s estimate of 1.4% QoQ
growth to USD826m), BPO business declined to USD61m, 0.7% QoQ (v/s
estimate of 2.2% QoQ growth to USD62.5m) and IMS grew to USD468.5, +5%
QoQ (v/s estimate of +6.3% QoQ growth to USD473m).
While IMS / BPO revenues are lower than estimate, this was made up by above
estimate growth of 2.1% in software services vs our est of 1.4% QoQ.
Services now contributing substantially to growth with IMS
Revenues grew 3% in line with estimates
Source: Company, MOSL
EBITDA margin increased by 70bp QoQ to 26.7%; above our estimate of 25.6%, -
40bp QoQ. EBIT margin was 24.7%, +100bp QoQ v/s our estimate of 23.3% (-
40bp). 100bp improvement in margins was led by IMS margins which improved
190bps QoQ to 25.4% supported by Software Services which showed a marginal
improvement of 30bp QoQ to 25.3%, while BPO margins declined by 70bp QoQ
to 5.3% due to decline in revenues.
Highest gross addition since 2QFY12
EBITDA margin expanded 70bps above our est. of 23.3%
Source: Company, MOSL
PAT was INR16.2b, +8.6% QoQ, above our estimate of INR14.5b. Apart from
higher operating income, beat to PAT was contributed by lower forex losses at
INR1.42b v/s our estimate of INR2.4b and effective tax rate was 20.9%, lower
than our estimate of 22%.
17 April 2014
2

HCL Technologies
Segment-wise performance: Software Services revival continues
IMS grew +5.1% QoQ to USD446m and 5% in CC terms, it continues to be the
single largest growth driver for the company. Software Services segment grew
2.1% QoQ and in CC terms, continuing its trend of healthy growth of 2.3% last
quarter. BPO segment declined 0.7% QoQ to USD61m and 1.3% in CC terms.
IMS continues to dominate growth (%)
Services
EAS
Engg and R&D Services
ADM
IMS
BPO
Contr.
to rev.
17.2
27.7
16.1
34.4
4.5
QoQ
Gr.
4.0
0.1
2.2
5.1
(0.7)
Contr to
inc rev.
4 Qtr
CQGR
22.9
0.3
21.1
2.0
0.6
1.6
59.0
7.1
(1.1)
4.4
Source: Company, MOSL
Among verticals, growth was driven by Public Services (+14% QoQ CC), BFSI
(+6.4% QoQ CC) and Retail & CPG (+2.7% QoQ CC). 4-quarter CQGR across
verticals shows that the key contributors to the company’s growth are Public
Services, Manufacturing and BFSI.
BFSI and Public Services drove growth among verticals (%)
Verticals
Financial Services
Manufacturing
Retail & CPG
Telecom MP&E
Life Sciences & Healthcare
Public Services
Others
Contr.
to rev.
26.9
33.3
8.5
8.4
10.4
10.1
2.3
QoQ
Gr.
6.8
2.0
2.8
(2.6)
(0.7)
13.9
(20.4)
Contr to
inc rev.
4 Qtr
CQGR
58.3
5.3
22.3
7.6
7.5
2.2
(7.8)
9.4
(2.4)
1.3
42.3
10.8
(20.3)
(13.7)
Source: Company, MOSL
Among geographies, RoW grew fastest (+10.4% QoQ CC), followed by Europe
(+4.8% QoQ CC). Europe continues to be key growth driver in the recent
quarters, with 4-quarter CQGR of 6%. Growth in RoW seems to be public
services driven as it has been flattish for peers.
Europe and RoW led growth during the quarter (%)
Geographies
US
Europe
RoW
Contr.
to rev.
55.4
31.8
12.8
QoQ
Gr.
0.4
4.8
11.0
Contr to
inc rev.
4 Qtr
CQGR
7.5
2.7
49.8
6.0
42.6
0.7
Source: Company, MOSL
17 April 2014
3

HCL Technologies
Comparison across peers
Growth (%)
Industry
BFSI
Mfg and Hi Tech
Retail
Public Services / Energy Utilities
Services
ADM
EAS
IMS
BPO
Regions
US
Europe
RoW
HCLT
6.4
2.0
2.8
10.1
2.2
4.0
5.0
-0.7
0.4
4.8
11.1
TCS
2.4
-0.4
-0.3
1.9
0.9
1.9
1.9
5.4
INFY
-0.5
0.4
-3.5
5.3
-0.9
-3.1
3.9
3.8
0.9
-0.8
4.7
1.0
0.1
-1.0
Source: Company, MOSL
Deal signings keep growth visibility intact; cost optimization-led margin
beat
For the sixth quarter in a row, HCLT signed USD1b+ TCV of deals, taking total
9MFY14 TCV to USD3b+. HCLT has already signed as many deals as it had
announced in the full year FY13. HCLT remains on track to sign USD4b+ deals in
FY14, which would be more than 30% growth YoY, compared to TCV
announcements in FY13. As a result, growth visibility in HCLT remains the
highest among peers, and we expect growth acceleration of FY14 to continue in
FY15.
Deal signings give higher growth visibility
Deals TCV (USD b)
1
1
1.5
1
1
1
1
1
Source: MOSL, Company
HCLT continued to surprise on the margins front, this time led by IMS. Beat to
margins was efficiency-led, with SGA coming down further. The company had
mentioned even in the last quarter that it is actively rationalizing its G&A spend,
which had already helped extract ~130bp operating margins. S&M spend
continues to be healthy.
17 April 2014
4

HCL Technologies
Intact: visibility on growth, execution on margins; Maintain Buy
We retain our revenue estimates post the results, and expect HCLT to accelerate
growth on the back of continued traction in deal wins. Modest upgrades in our
EBIT margin estimates follow yet another quarter of margin surprise, driven by
continued cost efficiencies. Consequently, our EPS estimates are up 3.6%/2.5%
for FY15E/16E.
Continued closure of orders keeps prospects of revenue growth at HCLT
sanguine. While the profitability for the company may cool off going forward,
execution towards extracting efficiencies has been continued to drive
outperformance to street expectations. Secondly, with greater proportion of
locals at onsite, the sensitivity of margins to currency has come down too,
reducing the risk to margins in the event of INR appreciation. Our FY16E EBIT
margin estimate of 21.7% is 230bp lower than that in FY14, downside risk to
which is limited. We expect HCLT to grow its USD revenues at a CAGR of 15%
over FY14-16E and EPS at a CAGR of 14% during this period. HCLT has the
highest visibility on growth acceleration in FY15. Also, improvement in software
services growth makes a case for re-rating in the stock on better business mix.
Our target price of INR1,700 discounts FY16E by 15x. Maintain
Buy.
Change in estimates
Revised
FY14E FY15E
61.4
60.0
5,372 6,189
14.6% 15.2%
24.0% 22.6%
86.4
99.7
51.6% 15.3%
FY16E
60.0
7,114
14.9%
21.7%
111.7
12.0%
FY14E
61.6
5,369
14.6%
23.3%
82.9
45.4%
Earlier
FY15E
60.0
6,176
15.0%
21.9%
96.3
16.0%
FY16E
60.0
7,075
14.6%
21.4%
109.0
13.2%
FY14E
-0.2%
0.0%
5bp
77bp
4.2%
Change
FY15E
0.0%
0.2%
20bp
67bp
3.6%
FY16E
0.0%
0.6%
38bp
34bp
2.5%
INR/USD
USD Revenue - m
USD revenue growth
EBIT Margin
EPS - INR
EPS Growth
Source: Company, MOSL
Other result highlights
Overall headcount increased by 1,858 employees during the quarter to 90,190
employees. Gross additions during the quarter of 8,291.
Blended utilization for the quarter was 84.2%, +10bp QoQ.
The company signed deals in excess of USD1bn TCV which includes 1
transformational deals (v/s 15 in the previous quarter).
Attrition rate in IT Services was 16.9%, v/s 16.6% in 2QFY14.
Billed receivables increased to 58 days (v/s 54 in 1QFY14).
Revenue proportion from Fixed Price contracts increased 140bp QoQ to 55.7%.
Total hedges amount to USD1b, USD854m of which is cash flow hedges and
USD155m are Balance Sheet hedges. The hedges are at an average rate of
INR56.46 for the next 12 months and INR65.18 levels for future periods.
17 April 2014
5

HCL Technologies
Story in Charts
ISG upgraded the opportunity in the churn markets…
… HCLT continues to reap its benefits through deal wins…
Source: Company, MOSL
..reflected in IMS being a key growth driver for HCLT
Uptick in software services growth improves the growth mix
Source: Company, MOSL
Growth and scale have driven Continued OPM surprise...
…and 4 consecutive year of spectacular PAT growth
th
Source: Company, MOSL
17 April 2014
6

HCL Technologies
Operating Metrics
1QFY12 2QFY12 3QFY12 4QFY12 1QFY13 2QFY13
Service Line wise (%)
Enterprise App. Services
Engineering and R&D Services
Custom Application
Infrastructure Services
BPO Services
Vertical wise (%)
BFSI
Manufacturing
Retail & CPG
Telecom MP&E
Life Sciences
Public Services
Others
Geography wise (%)
US
Europe
RoW
Client wise (%)
Top 5 clients
Top 10 clients
Top 20 clients
QoQ Growth (%)
Service Line wise
Enterprise App. Services
Engineering and R&D Services
Custom Application
Infrastructure Services
BPO Services
Vertical wise
BFSI
Manufacturing
Retail & CPG
Telecom MP&E
Life Sciences
Public Services
Others
Geography wise
US
Europe
RoW
Client wise
Top 5 clients
Top 10 clients
Top 20 clients
19.8
18.6
32.4
24.6
4.6
25.1
29.0
8.5
6.8
7.6
8.0
6.6
55.8
26.6
17.5
15.3
24.1
34.2
20.3
18.9
32.8
23.4
4.5
25.3
29.5
8.8
6.4
8.6
6.4
6.9
58.8
26.8
14.4
15.8
24.2
33.9
20.7
18.5
32.1
24.0
4.7
24.0
29.0
8.6
6.7
9.1
6.8
7.2
56.7
27.6
15.7
16.0
24.3
33.9
20.8
18.6
31.3
24.8
4.4
23.8
28.4
8.6
6.7
10.8
7.2
6.4
56.6
28.0
15.4
16.4
24.7
34.1
19.9
18.1
31.0
26.6
4.5
24.1
31.6
9.2
10.4
12.0
6.9
5.8
57.0
27.9
15.1
16.2
24.5
33.6
19.0
17.6
30.6
28.4
4.4
25.8
31.0
9.0
10.3
11.9
7.0
4.8
56.9
28.5
14.6
15.7
24.2
33.3
3QFY13
19.0
17.1
29.7
29.9
4.3
25.0
28.4
8.9
6.7
11.3
7.7
4.8
57.1
28.9
14.0
15.4
24.0
32.8
4QFY13
17.3
17.3
29.2
31.5
4.3
25.3
32.7
8.6
10.1
11.3
8.0
4.0
57.0
30.5
12.5
15.4
23.8
33.0
1QFY14
17.3
16.9
28.4
33.1
4.3
26.0
33.3
8.3
9.1
11.6
7.8
3.9
57.2
30.2
12.6
15.1
23.8
33.2
2QFY14
17.1
16.6
28.0
33.7
4.6
25.9
33.6
8.6
8.9
10.8
9.2
3.1
56.9
31.3
11.8
14.8
23.8
33.6
3QFY14
17.2
16.1
27.7
34.4
4.5
26.9
33.3
8.5
8.4
10.4
10.1
2.3
55.4
31.8
12.8
15.0
24.1
34.2
-1.4
8.8
6.0
4.5
-2.3
0.5
7.8
12.0
-0.3
0.1
0.3
20.5
6.8
2.3
-1.4
3.4
2.0
0.8
4.5
3.6
3.2
-3.0
-0.3
2.8
3.7
5.6
-4.0
15.4
-18.4
6.6
7.4
2.6
-16.2
5.3
2.4
1.1
4.6
0.4
0.4
5.2
7.1
-2.7
0.8
0.2
7.4
8.5
9.0
7.0
-1.1
5.6
11.8
3.8
3.0
2.5
3.5
3.6
0.5
6.5
-3.6
2.2
0.9
3.0
3.0
22.3
9.1
-8.4
2.8
4.5
1.1
5.6
4.7
3.6
-1.3
0.4
2.2
10.7
5.5
4.5
14.8
10.4
60.1
14.6
-1.1
-6.5
3.9
2.8
1.2
1.9
2.3
1.7
-1.1
0.8
2.3
10.6
1.3
10.9
1.7
1.4
2.6
2.8
5.1
-14.2
3.5
5.9
0.2
0.4
2.4
2.7
3.2
0.2
0.1
8.6
0.8
0.0
-5.5
2.0
-32.9
-2.0
13.5
3.2
3.5
4.6
-1.1
1.2
2.3
1.6
-6.1
4.3
1.4
8.6
3.1
4.3
18.7
-0.4
55.4
3.1
7.1
-14.1
2.9
8.8
-8.0
3.1
2.2
3.7
1.2
1.4
0.6
8.7
1.9
6.2
5.6
-0.7
-6.4
6.8
1.5
-2.6
4.0
2.6
3.2
2.5
2.1
2.4
6.0
13.7
3.8
5.0
7.5
1.2
-3.8
21.8
-16.9
3.4
7.8
-2.3
4.0
0.1
2.2
5.1
-0.7
6.8
2.0
2.8
-2.6
-0.7
13.9
-20.4
0.4
4.8
11.0
1.5
1.9
4.4
3.5
4.0
4.3
4.1
5.3
4.9
Source: MOSL, Company
17 April 2014
7

HCL Technologies
HCL Technologies: an investment profile
Company description
HCL Technologies is one of the largest IT services
companies in India, employing over 88,000 people. It is a
leader in remote infrastructure management,
engineering and R&D services and has sizeable BPO,
Enterprise Solutions and ADM practices.
Recent developments
HCLT won deals amounting to TCV of USD1b+ in
3QFY14.
HCL Tech signed 12 transformational deals during
quarter.
Valuation and view
Key investment arguments
Healthy strike rate in large deal wins have
ascertained the company’s prowess in the RTB space.
Fastest growth trajectory in the infrastructure
management space, the strongest growth segment
for Indian IT.
A comprehensive IT services company with a wide
portfolio of services including R&D, Enterprise, BPO,
Infrastructure
Management
and
Enterprise
Application services.
We expect USD revenues to grow at a CAGR of 15%
over FY14-16 and EPS CAGR to be 14%.
The stock trades at 14.3x FY15E and 12.8x FY16E EPS.
Maintain
Buy,
with a target price of INR1,700, which
discounts our FY16E EPS by 15x.
Sector view
Key investment risks
Risk-pricing in FPP contracts could go wrong.
Slower than anticipated ramp-up in large deals
leading to moderation in revenue growth.
Appreciation of the rupee and cross currency
movements could hamper profitability.
With strengthening demand in the US and large deals
traction in traditional services in Europe, industry
growth in FY15 should be better than FY14.
We see better risk-reward in Tier-I v/s Tier-II, and do
not expect further bridging of the valuation gap on
the following counts: [1] tier-II growth continues to at
best, match tier-I, [2] Current tier-II discount to top-
tier is lower to historical P/E discount, and [3] Cash
conversion capability at tier-II is inferior.
Currency is a key risk to valuations, and Tier-II has a
higher sensitivity to the same v/s Tier-I.
Comparative valuations
HCLT
P/E (x)
P/BV (x)
EV/Sales (x)
EV/EBITDA (x)
FY15E
FY16E
FY15E
FY16E
FY15E
FY16E
FY15E
FY16E
EPS: MOSL forecast v/s consensus (INR)
TCS
19.7
17.3
6.6
5.4
5.0
4.3
14.2
12.3
INFO
15.8
13.9
3.5
3.0
2.8
2.4
10.3
8.7
14.3
12.8
3.9
3.2
2.8
2.3
9.5
9.8
MOSL
Forecast
FY14
FY15
86.4
99.7
Consensus
Forecast
85.5
97.5
Variation
(%)
1.0%
2.3%
Target price and recommendation
Current
Price (INR)
1,424
Target
Price (INR)
1,700
Upside
(%)
19.4
Reco
Buy
Stock performance (1-year)
Shareholding pattern (%)
Mar-14
Promoter
Domestic Inst
Foreign
Others
61.7
3.7
29.6
5.0
Dec-13
61.8
4.2
29.2
4.8
Mar-13
62.0
6.6
26.0
5.5
17 April 2014
8

HCL Technologies
Financials and valuation
17 April 2014
9

Disclosures
This report is for personal information of the authorized recipient and does not construe to be any investment, legal or taxation advice to you. This research report does not constitute an offer, invitation or
inducement to invest in securities or other investments and Motilal Oswal Securities Limited (hereinafter referred as MOSt) is not soliciting any action based upon it. This report is not for public distribution
and has been furnished to you solely for your information and should not be reproduced or redistributed to any other person in any form.
Unauthorized disclosure, use, dissemination or copying (either whole or partial) of this information, is prohibited. The person accessing this information specifically agrees to exempt MOSt or any of its
affiliates or employees from, any and all responsibility/liability arising from such misuse and agrees not to hold MOSt or any of its affiliates or employees responsible for any such misuse and further agrees
to hold MOSt or any of its affiliates or employees free and harmless from all losses, costs, damages, expenses that may be suffered by the person accessing this information due to any errors and delays.
The information contained herein is based on publicly available data or other sources believed to be reliable. While we would endeavour to update the information herein on reasonable basis, MOSt and/or
its affiliates are under no obligation to update the information. Also there may be regulatory, compliance, or other reasons that may prevent MOSt and/or its affiliates from doing so. MOSt or any of its
affiliates or employees shall not be in any way responsible and liable for any loss or damage that may arise to any person from any inadvertent error in the information contained in this report. MOSt or any
of its affiliates or employees do not provide, at any time, any express or implied warranty of any kind, regarding any matter pertaining to this report, including without limitation the implied warranties of
merchantability, fitness for a particular purpose, and non-infringement. The recipients of this report should rely on their own investigations.
This report is intended for distribution to institutional investors. Recipients who are not institutional investors should seek advice of their independent financial advisor prior to taking any investment decision
based on this report or for any necessary explanation of its contents.
MOSt and/or its affiliates and/or employees may have interests/positions, financial or otherwise in the securities mentioned in this report. To enhance transparency, MOSt has incorporated a Disclosure of
Interest Statement in this document. This should, however, not be treated as endorsement of the views expressed in the report.
Disclosure of Interest Statement
1. Analyst ownership of the stock
2. Group/Directors ownership of the stock
3. Broking relationship with company covered
4. Investment Banking relationship with company covered
HCL TECHNOLOGIES LTD
No
No
No
No
HCL Technologies
Analyst Certification
The views expressed in this research report accurately reflect the personal views of the analyst(s) about the subject securities or issues, and no part of the compensation of the research analyst(s) was, is,
or will be directly or indirectly related to the specific recommendations and views expressed by research analyst(s) in this report. The research analysts, strategists, or research associates principally
responsible for preparation of MOSt research receive compensation based upon various factors, including quality of research, investor client feedback, stock picking, competitive factors and firm revenues.
This report is not directed or intended for distribution to or use by any person or entity resident in a state, country or any jurisdiction, where such distribution, publication, availability or use would be contrary
to law, regulation or which would subject MOSt & its group companies to registration or licensing requirements within such jurisdictions.
Regional Disclosures (outside India)
This report is intended for distribution only to persons having professional experience in matters relating to investments as described in Article 19 of the Financial Services and Markets Act 2000 (Financial
Promotion) Order 2005 (referred to as "investment professionals"). This document must not be acted on or relied on by persons who are not investment professionals. Any investment or investment activity
to which this document relates is only available to investment professionals and will be engaged in only with such persons.
For U.K.
Motilal Oswal Securities Limited (MOSL) is not a registered broker - dealer under the U.S. Securities Exchange Act of 1934, as amended (the"1934 act") and under applicable state laws in the United
States. In addition MOSL is not a registered investment adviser under the U.S. Investment Advisers Act of 1940, as amended (the "Advisers Act" and together with the 1934 Act, the "Acts), and under
applicable state laws in the United States. Accordingly, in the absence of specific exemption under the Acts, any brokerage and investment services provided by MOSL, including the products and services
described herein are not available to or intended for U.S. persons.
This report is intended for distribution only to "Major Institutional Investors" as defined by Rule 15a-6(b)(4) of the Exchange Act and interpretations thereof by SEC (henceforth referred to as "major
institutional investors"). This document must not be acted on or relied on by persons who are not major institutional investors. Any investment or investment activity to which this document relates is only
available to major institutional investors and will be engaged in only with major institutional investors. In reliance on the exemption from registration provided by Rule 15a-6 of the U.S. Securities Exchange
Act of 1934, as amended (the "Exchange Act") and interpretations thereof by the U.S. Securities and Exchange Commission ("SEC") in order to conduct business with Institutional Investors based in the
U.S., MOSL has entered into a chaperoning agreement with a U.S. registered broker-dealer, Motilal Oswal Securities International Private Limited. ("MOSIPL"). Any business interaction pursuant to this
report will have to be executed within the provisions of this chaperoning agreement.
The Research Analysts contributing to the report may not be registered /qualified as research analyst with FINRA. Such research analyst may not be associated persons of the U.S. registered broker-
dealer, MOSIPL, and therefore, may not be subject to NASD rule 2711 and NYSE Rule 472 restrictions on communication with a subject company, public appearances and trading securities held by a
research analyst account.
For U.S.
Motilal Oswal Capital Markets Singapore Pte Limited is acting as an exempt financial advisor under section 23(1)(f) of the Financial Advisers Act(FAA) read with regulation 17(1)(d) of the Financial
Advisors Regulations and is a subsidiary of Motilal Oswal Securities Limited in India. This research is distributed in Singapore by Motilal Oswal Capital Markets Singapore Pte Limited and it is only directed
in Singapore to accredited investors, as defined in the Financial Advisers Regulations and the Securities and Futures Act (Chapter 289), as amended from time to time.
In respect of any matter arising from or in connection with the research you could contact the following representatives of Motilal Oswal Capital Markets Singapore Pte Limited:
Anosh Koppikar
Kadambari Balachandran
Email:anosh.Koppikar@motilaloswal.com
Email : kadambari.balachandran@motilaloswal.com
Contact(+65)68189232
Contact: (+65) 68189233 / 65249115
Office Address:21 (Suite 31),16 Collyer Quay,Singapore 04931
For Singapore
Motilal Oswal Securities Ltd
17 April 2014
Motilal Oswal Tower, Level 9, Sayani Road, Prabhadevi, Mumbai 400 025
Phone: +91 22 3982 5500 E-mail: reports@motilaloswal.com
10