21 April 2014
4QFY14 Results Update | Sector:
Metals
Hindustan Zinc
BSE SENSEX
22,765
Bloomberg
Equity Shares (m)
52-Week Range (INR)
1, 6, 12 Rel. Per (%)
S&P CNX
6,818
HZ IN
4,225.3
142/94
4/-10/0
CMP: INR132
TP: INR161
Buy
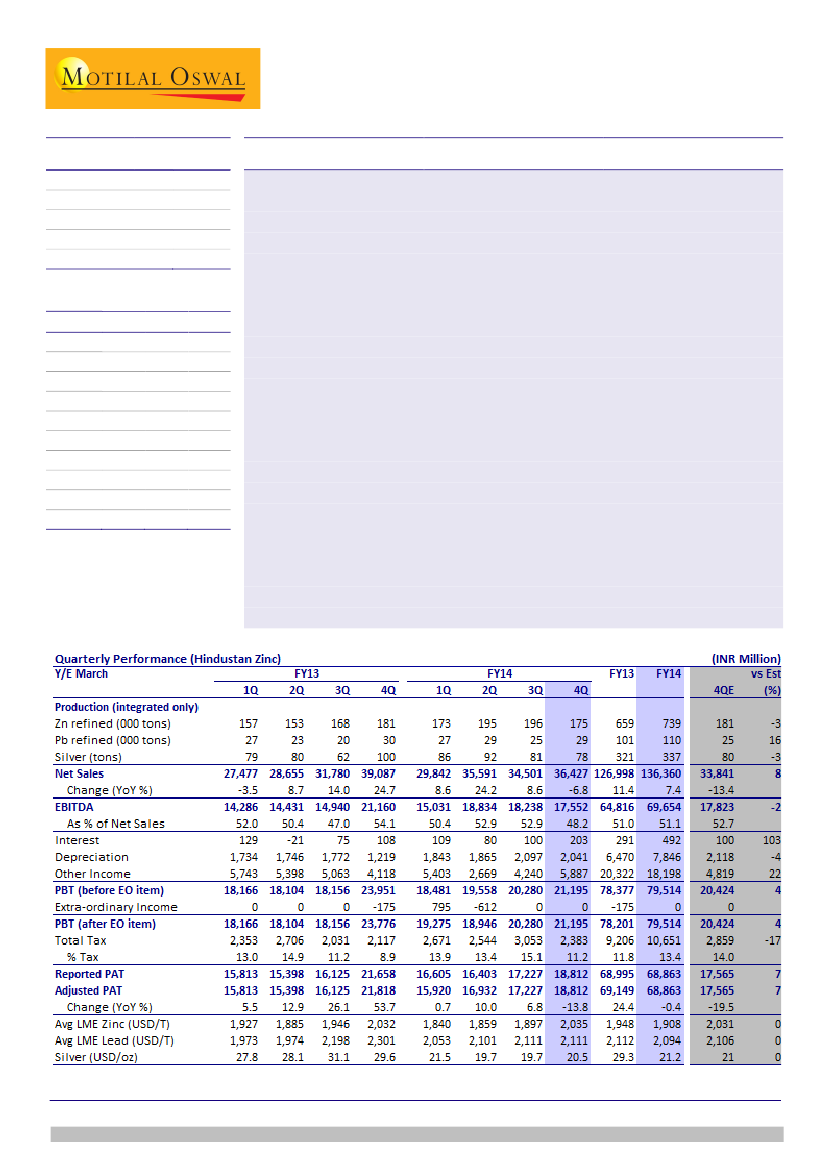
EBITDA in line; negative operating leverage affected costs
Hindustan Zinc (HZ) 4QFY14 adjusted PAT increased 9% QoQ to INR18.8b, above
estimates, due to higher other income. EBITDA declined 4% QoQ on lower volumes
and negative impact of operating leverage on costs.
Net sales increased 6% QoQ driven by realization. The premiums over LME were
stronger than estimate. Although integrated lead production increased 16% QoQ,
zinc and silver integrated production declined 3% and 22% respectively.
EBITDA declined 4% QoQ to INR17.5b due to 7% jump in cost of production (CoP)
to INR55,467/t. Inflation in mining costs due to diesel prices, mine development
and lower production are key reasons behind the increase in costs. Higher-than-
expected costs were mostly offset by higher-than-expected revenue premiums.
Other income was boosted by MTM gains. Total dividend is up 13% YoY to
INR3.5/share for FY14. Cash and equivalent increased by INR40b YoY to
INR255.4b.
HZ has issued FY15 guidance of USD250m capex on expected lines but volumes are
expected to increase only marginally. We are expecting mine production to
increase by 2.5% YoY to 899kt in FY15, which remains unchanged.
Although mine production did not ramp up as per initial plan during FY14, the
production will ramp up during FY15 and full benefit will be seen in FY16.
Earnings are expected to grow 7% to INR17.5/share helped by better prices and
higher volumes. Stock trades at FY15E EV/EBITDA of 3.4x and P/BV of 1.3x. In view
of positive price outlook, valuations are attractive. Maintain
Buy.
M.Cap. (INR b) / (USD b) 558.6/9.2
Financials & Valuation (INR Billion)
Y/E MAR
Net Sales
EBITDA
Adj PAT
EPS (INR)
Gr. (%)
RoE (%)
RoCE (%)
P/E (x)
P/BV (x)
EV/EBITDA
( )
2014 2015E 2016E
136.4
69.7
68.9
16.3
-0.4
19.7
22.0
8.1
1.5
4.3
140.8
73.8
73.8
17.5
7.2
18.2
20.6
7.6
1.3
3.4
147.8
75.9
72.3
17.1
-2.1
15.7
19.0
7.7
1.1
2.6
Sanjay Jain
(SanjayJain@MotilalOswal.com); +91 22 3982 5412
Investors are advised to refer through disclosures made at the end of the Research Report.

Hindustan Zinc
Lead production improved
QoQ, but zinc and silver
production declined
Refined metal production (integrated basis only)
240
210
180
150
120
Refined Zinc
Refined Lead
Silver (RHS)
120
95
70
45
20
Source: MOSL, Company
Zinc, lead realization
improved QoQ on better
premiums and LME
Realization
160,000
120,000
80,000
40,000
0
Refined Zinc
Refined Lead
Silver (RHS)
60,000
50,000
40,000
30,000
20,000
Source: Company, MOSL
Mine production (kt) has been sliding
Cost of production (000 INR/t)* is on rise during FY14
Source: company
*excluding royalty
Source: company
21 April 2014
2

Hindustan Zinc
Hindustan Zinc: an investment profile
Company description
Hindustan Zinc (Bloomberg: HZ) is a fully integrated zinc
producer, with one of the best mining assets in the
world. It has steadily increased its reserves and
production through regular investment in exploration
activities and addition of smelting capacity. HZ's captive
mines of zinc and lead ore are located in the state of
Rajasthan, with total R&R of 365.1mt as at March 2014,
containing ~35.2mt zinc-lead metal & 28,804tonne
silver. Its captive mines and thermal power plants give
the company significant cost advantage, making it one
of the lowest cost producers of zinc in the world. SSLT
has 64.9% stake in HZ, while 29.5% is owned by the
Government of India.
Key investment risks
Unexpected fall in LME zinc prices would adversely
impact earnings.
Recent developments
Final dividend of INR1.9/share i.e. total dividend of
INR3.5 or 175% announced on 21
st
April, 2014.
R&R increased by Gross 26.1mt, prior to depletion
of 9.3mt.
Valuation and view
Stock trades at attractive FY15E of 3.1x EV/EBITDA.
Key investment arguments
Sector view
Zinc is our preferred base metal because of favorable
demand outlook and constraints in supply growth due
to shortage of large scale low cost mines in the world.
As per industry estimates, about 1.2mtpa of capacity
will be closed by 2016. According to IZLSG, global
supply of zinc and lead will lag behind demand in 2014.
The global metal deficit will widen. The prices are likely
to remain buoyant.
HZ is the world's largest integrated zinc-lead
producer, with a total smelting capacity of 1.064m
tons.
HZ is spending USD1.5b over the next six years to
increase annual mining output to 1.2m tons. This
will further boost volume growth, going forward.
HZ's cost of production (CoP) is among the lowest in
the world due to its fully-integrated operations and
large resource base. It has a huge R&R base with 25
years of mine life.
Comparative valuations
P/E (x)
FY15E
FY16E
P/BV (x)
FY15E
FY16E
EV/Sales (x) FY15E
FY16E
EV/EBITDA (x) FY15E
FY16E
HZL
7.6
7.7
1.3
1.1
1.8
1.3
3.4
2.6
Nalco
12.5
13.7
0.8
0.8
0.5
0.5
3.6
3.7
Hindalco
11.2
12.3
1.3
1.2
0.8
0.7
7.3
6.4
EPS: MOSL forecast v/s consensus (INR)
MOSL
Forecast
FY15
FY16
17.5
17.1
Consensus
Forecast
17.5
18.2
Variation
(%)
0.1
-5.8
Target price and recommendation
Current
Price (INR)
130
Target
Price (INR)
161
Upside
(%)
22.0
Reco.
Buy
Shareholding pattern (%)
Promoter
Domestic Inst
Foreign
Others
Mar-14
94.5
1.8
2.1
1.7
Dec-13
94.5
1.9
2.1
1.6
Mar-13
94.5
2.0
1.5
2.0
Stock performance (1-year)
21 April 2014
3

Hindustan Zinc
Financials and valuation
Income statement
Y/E March
Net Sales
Change (%)
EBITDA
EBITDA Margin (%)
Depreciation
EBIT
Interest
Other Income
Extraordinary items
PBT
Tax
Tax Rate (%)
Reported PAT
Adjusted PAT
Change (%)
Min. Int. & Assoc. Share
Adj Cons PAT
2013
127.0
11.4
64.8
51.0
6.5
58.3
0.3
20.3
-0.2
78.2
9.2
11.8
69.0
69.1
24.4
0.0
69.1
2014
136.4
7.4
69.7
51.1
7.8
61.8
0.5
18.2
0.0
79.5
10.7
13.4
68.9
68.9
-0.4
0.0
68.9
(INR Billion)
2015E
140.8
3.3
73.8
52.4
7.4
66.4
0.8
20.2
0.0
85.8
12.0
14.0
73.8
73.8
7.2
0.0
73.8
2016E
147.8
4.9
75.9
51.4
7.8
68.1
0.8
22.5
0.0
89.8
17.5
19.5
72.3
72.3
-2.1
0.0
72.3
Ratios
Y/E March
Basic (INR)
EPS
Cash EPS
Book Value
DPS
Payout (incl. Div. Tax.)
Valuation(x)
P/E
Cash P/E
Price / Book Value
EV/Sales
EV/EBITDA
Dividend Yield (%)
Profitability Ratios (%)
RoE
RoCE
Turnover Ratios (%)
Asset Turnover (x)
Debtors (No. of Days)
Inventory (No. of Days)
Leverage Ratios (%)
Net Debt/Equity (x)
2013
16.4
17.9
76.4
3.1
22.2
8.1
7.4
1.7
2.7
5.3
2.3
23.4
25.6
0.4
11.6
31.9
-0.7
2014
16.3
18.2
89.1
3.1
22.3
8.1
7.3
1.5
2.2
4.3
2.3
19.7
22.0
0.3
10.8
29.7
-0.7
2015E
17.5
19.2
102.4
3.5
23.4
7.6
6.9
1.3
1.8
3.4
2.6
18.2
20.6
0.3
10.8
29.7
-0.7
2016E
17.1
19.0
115.4
3.5
23.9
7.7
7.0
1.1
1.4
2.6
2.6
15.7
19.0
0.3
10.8
29.7
-0.7
Balance sheet
Y/E March
Share Capital
Reserves
Net Worth
Debt
Deferred Tax
Total Capital Employed
Gross Fixed Assets
Less: Acc Depreciation
Net Fixed Assets
Capital WIP
Investments
Current Assets
Inventory
Debtors
Cash & Bank
Loans & Adv, Others
Curr Liabs & Provns
Curr. Liabilities
Provisions
Net Current Assets
Total Assets
2013
8.5
314.3
322.8
0.0
12.8
335.6
122.6
37.8
84.8
10.8
145.4
113.6
11.1
4.0
69.4
29.0
19.1
4.8
14.3
94.5
335.6
2014
8.5
367.8
376.3
0.0
14.3
390.6
138.6
44.8
93.9
10.8
191.4
113.6
11.1
4.0
69.4
29.0
19.1
4.8
14.3
94.5
390.6
(INR Billion)
2015E
2016E
8.5
8.5
424.3
479.3
432.8
487.8
0.0
0.0
16.0
18.5
448.8
506.3
154.6
170.6
52.2
60.0
102.5
110.7
10.8
10.8
240.7
289.5
114.1
114.8
11.5
12.0
4.2
4.4
69.4
69.4
29.0
29.0
19.2
19.5
5.0
5.2
14.3
14.3
94.8
95.4
448.8
506.3
E: MOSL Estimates
Cash flow statement
Y/E March
OP/(Loss) before Tax
Depreciation
Others
Interest
Direct Taxes Paid
(Inc)/Dec in Wkg Cap
CF from Op. Activity
(Inc)/Dec in FA & CWIP
(Pur)/Sale of Invt
Others
CF from Inv. Activity
Inc / (Dec) in Debt
Interest Paid
Divd Paid (incl Tax)
Other income
CF from Fin. Activity
Inc/(Dec) in Cash
Add: Opening Balance
Closing Balance
2013
78.2
6.5
-20.3
0.3
-7.6
-14.3
43.1
-12.4
-18.5
0.0
-30.9
0.0
-0.3
-15.3
20.3
4.7
16.9
52.6
69.4
2014
79.5
7.8
-18.2
0.5
-9.1
0.0
59.6
-16.0
-46.0
0.0
-62.0
0.0
-0.5
-15.3
18.2
2.4
-0.1
69.4
69.3
(INR Billion)
2015E
85.8
7.4
-20.2
0.8
-10.3
-0.3
63.2
-16.0
-49.3
0.0
-65.3
0.0
-0.8
-17.3
20.2
2.1
0.0
69.4
69.4
2016E
89.8
7.8
-22.5
0.8
-15.0
-0.5
60.4
-16.0
-48.8
0.0
-64.8
0.0
-0.8
-17.3
22.5
4.4
0.0
69.4
69.4
21 April 2014
4

Hindustan Zinc
N O T E S
21 April 2014
5

Hindustan Zinc
This report is for personal information of the authorized recipient and does not construe to be any investment, legal or taxation advice to you. This research report does not constitute an offer, invitation or
inducement to invest in securities or other investments and Motilal Oswal Securities Limited (hereinafter referred as MOSt) is not soliciting any action based upon it. This report is not for public distribution
and has been furnished to you solely for your information and should not be reproduced or redistributed to any other person in any form.
Unauthorized disclosure, use, dissemination or copying (either whole or partial) of this information, is prohibited. The person accessing this information specifically agrees to exempt MOSt or any of its
affiliates or employees from, any and all responsibility/liability arising from such misuse and agrees not to hold MOSt or any of its affiliates or employees responsible for any such misuse and further agrees
to hold MOSt or any of its affiliates or employees free and harmless from all losses, costs, damages, expenses that may be suffered by the person accessing this information due to any errors and delays.
The information contained herein is based on publicly available data or other sources believed to be reliable. While we would endeavour to update the information herein on reasonable basis, MOSt and/or
its affiliates are under no obligation to update the information. Also there may be regulatory, compliance, or other reasons that may prevent MOSt and/or its affiliates from doing so. MOSt or any of its
affiliates or employees shall not be in any way responsible and liable for any loss or damage that may arise to any person from any inadvertent error in the information contained in this report. MOSt or any
of its affiliates or employees do not provide, at any time, any express or implied warranty of any kind, regarding any matter pertaining to this report, including without limitation the implied warranties of
merchantability, fitness for a particular purpose, and non-infringement. The recipients of this report should rely on their own investigations.
This report is intended for distribution to institutional investors. Recipients who are not institutional investors should seek advice of their independent financial advisor prior to taking any investment decision
based on this report or for any necessary explanation of its contents.
MOSt and/or its affiliates and/or employees may have interests/positions, financial or otherwise in the securities mentioned in this report. To enhance transparency, MOSt has incorporated a Disclosure of
Interest Statement in this document. This should, however, not be treated as endorsement of the views expressed in the report.
Disclosure of Interest Statement
1. Analyst ownership of the stock
2. Group/Directors ownership of the stock
3. Broking relationship with company covered
4. Investment Banking relationship with company covered
HINDUSTAN ZINC LTD
No
No
No
No
Disclosures
Analyst Certification
The views expressed in this research report accurately reflect the personal views of the analyst(s) about the subject securities or issues, and no part of the compensation of the research analyst(s) was, is,
or will be directly or indirectly related to the specific recommendations and views expressed by research analyst(s) in this report. The research analysts, strategists, or research associates principally
responsible for preparation of MOSt research receive compensation based upon various factors, including quality of research, investor client feedback, stock picking, competitive factors and firm revenues.
This report is not directed or intended for distribution to or use by any person or entity resident in a state, country or any jurisdiction, where such distribution, publication, availability or use would be contrary
to law, regulation or which would subject MOSt & its group companies to registration or licensing requirements within such jurisdictions.
Regional Disclosures (outside India)
This report is intended for distribution only to persons having professional experience in matters relating to investments as described in Article 19 of the Financial Services and Markets Act 2000 (Financial
Promotion) Order 2005 (referred to as "investment professionals"). This document must not be acted on or relied on by persons who are not investment professionals. Any investment or investment activity
to which this document relates is only available to investment professionals and will be engaged in only with such persons.
For U.K.
Motilal Oswal Securities Limited (MOSL) is not a registered broker - dealer under the U.S. Securities Exchange Act of 1934, as amended (the"1934 act") and under applicable state laws in the United
States. In addition MOSL is not a registered investment adviser under the U.S. Investment Advisers Act of 1940, as amended (the "Advisers Act" and together with the 1934 Act, the "Acts), and under
applicable state laws in the United States. Accordingly, in the absence of specific exemption under the Acts, any brokerage and investment services provided by MOSL, including the products and services
described herein are not available to or intended for U.S. persons.
This report is intended for distribution only to "Major Institutional Investors" as defined by Rule 15a-6(b)(4) of the Exchange Act and interpretations thereof by SEC (henceforth referred to as "major
institutional investors"). This document must not be acted on or relied on by persons who are not major institutional investors. Any investment or investment activity to which this document relates is only
available to major institutional investors and will be engaged in only with major institutional investors. In reliance on the exemption from registration provided by Rule 15a-6 of the U.S. Securities Exchange
Act of 1934, as amended (the "Exchange Act") and interpretations thereof by the U.S. Securities and Exchange Commission ("SEC") in order to conduct business with Institutional Investors based in the
U.S., MOSL has entered into a chaperoning agreement with a U.S. registered broker-dealer, Motilal Oswal Securities International Private Limited. ("MOSIPL"). Any business interaction pursuant to this
report will have to be executed within the provisions of this chaperoning agreement.
The Research Analysts contributing to the report may not be registered /qualified as research analyst with FINRA. Such research analyst may not be associated persons of the U.S. registered broker-
dealer, MOSIPL, and therefore, may not be subject to NASD rule 2711 and NYSE Rule 472 restrictions on communication with a subject company, public appearances and trading securities held by a
research analyst account.
For U.S.
Motilal Oswal Capital Markets Singapore Pte Limited is acting as an exempt financial advisor under section 23(1)(f) of the Financial Advisers Act(FAA) read with regulation 17(1)(d) of the Financial
Advisors Regulations and is a subsidiary of Motilal Oswal Securities Limited in India. This research is distributed in Singapore by Motilal Oswal Capital Markets Singapore Pte Limited and it is only directed
in Singapore to accredited investors, as defined in the Financial Advisers Regulations and the Securities and Futures Act (Chapter 289), as amended from time to time.
In respect of any matter arising from or in connection with the research you could contact the following representatives of Motilal Oswal Capital Markets Singapore Pte Limited:
Anosh Koppikar
Kadambari Balachandran
Email : anosh.koppikar@motilaloswal.com
Email : kadambari.balachandran@motilaloswal.com
Contact: (+65) 68189232
Contact: (+65) 68189233 / 65249115
Office address: 21 (Suite 31), 16 Collyer Quay, Singapore 04931
For Singapore
21 April 2014
Motilal Oswal Securities Ltd
Motilal Oswal Tower, Level 9, Sayani Road, Prabhadevi, Mumbai 400 025
Phone: +91 22 3982 5500 E-mail: reports@motilaloswal.com
6