22 April 2014
4QFY14 Results Update | Sector:
Financials
HDFC Bank
BSE SENSEX
22,758
Bloomberg
Equity Shares (m)
M.Cap.(INR b)/(USD b)
52-Week Range (INR)
1, 6, 12 Rel. Per (%)
S&P CNX
6,815
HDFCB IN
2,399.1
1,743/28.6
761/528
-5/0/-15
CMP: INR726
TP: INR825
Buy
Financials & Valuation (INR Billion)
Y/E March
NII
OP
NP
EPS (INR)
EPS Gr. (%)
BV/Sh.(INR)
P/E (x)
P/BV (x)
RoE (%)
RoA (%)
2014 2015E 2016E
184.8
143.6
84.8
35.3
25.0
181.1
20.6
4.0
21.3
1.9
221.6
183.9
106.0
44.2
25.1
215.0
16.4
3.4
22.3
2.0
272.2
229.7
132.4
55.2
24.9
257.4
13.2
2.8
23.4
2.0
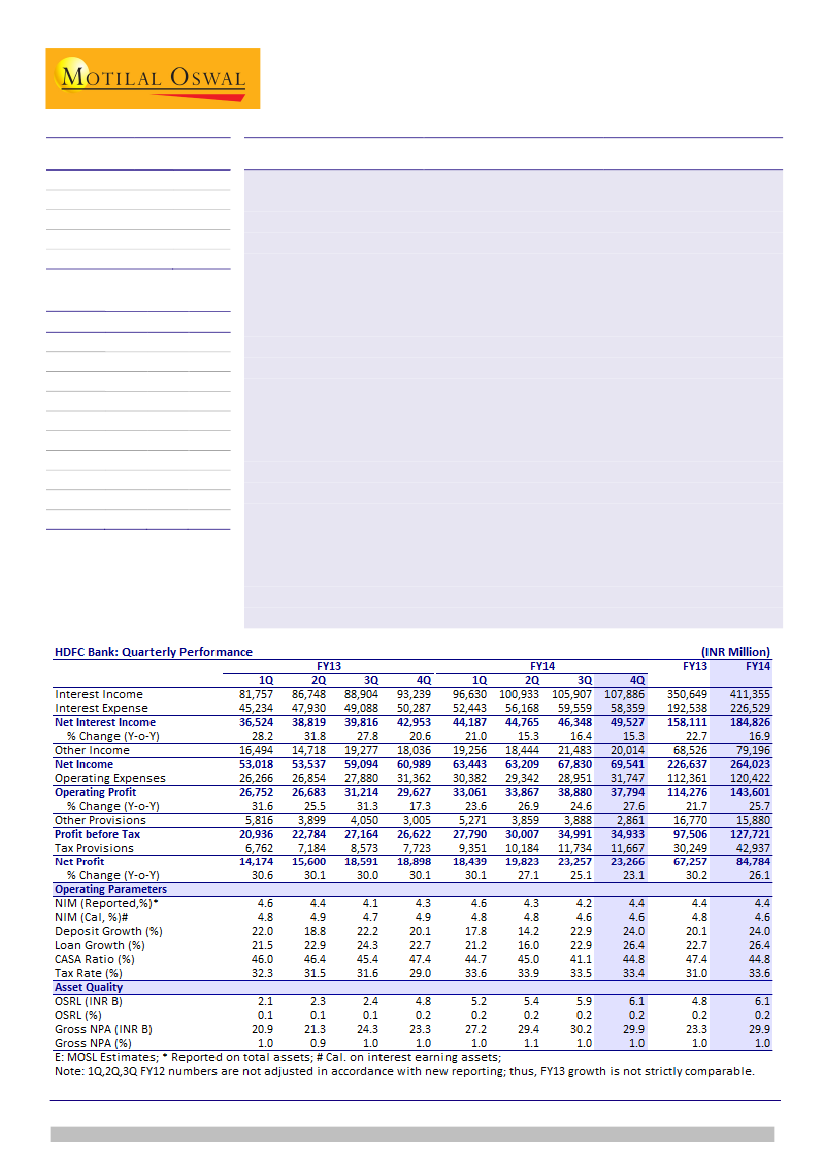
HDFC Bank's (HDFCB) 4QFY14 PAT grew 23% YoY to INR23.3b (in-line). NII was in
line with estimate at INR49.5b (+15% YoY and 7% QoQ) led by 15bp+ QoQ
improvement in NIM to 4.4% and in-line loan growth (26% YoY).
Lower non-core income (including forex) of INR4.8b (estimate of INR7.8b)
impacted revenue. Fees were marginally (4%) below estimate. Continued
operating leverage (opex flat YoY, 4% below estimate) and lower-than-expected
provisions (INR2.9b v/s INR5b) led by strong asset quality helped earnings.
PBT growth remains healthy at 30% YoY though high tax rate YoY (34% v/s 29% a
year ago) led to 23% YoY growth in PAT. Even for FY14, PBT growth remained at
30%+ YoY; however, high tax rate at 34% (31% in FY13) led to PAT growth of 26%.
Other highlights:
1) Strong SA deposits growth of 9% QoQ (+17% YoY) and CA
float (+26% QoQ, 17.6% YoY) led to an increase in CASA ratio to 44.8% v/s 41%
(43.7% ex-FCNR (B) deposits) in 3QFY14, 2) net stress loans were at 50bp (40bp in
FY13), 3) loan mix shifted in favor of non-retail loans driven by strong growth in
overseas loans (23% of incremental loans in FY14) and corporate loans (+38% YoY)
and 4) RWA to total assets declined to 70% v/s 76% in FY13.
Maintain Buy:
HDFCB is best-placed in the current environment, with a CASA ratio of
~45%, growth outlook of at least 1.3x of industry, least asset quality risk and healthy
CET1 of 11.8%. While FIPB approval and reduction in weights in MSCI index can impact
stock’s performance in the near term, we believe valuations are at an attractive level,
with one-year forward P/BV of 3.4x (near its LPA). Comfort on earnings (25%+ CAGR)
remains high and RoE is expected to be at decadal best of 22%+.
Alpesh Mehta
(Alpesh.Mehta@MotilalOswal.com); +91 22 3982 5415
Sohail Halai
(Sohail.Halai@MotilalOswal.com); +91 22 39825430
Investors are advised to refer through disclosures made at the end of the Research Report.

HDFC Bank
Quarterly Performance: In-line with estimate
Y/E March
Net Interest Income
% Change (Y-o-Y)
Other Income
Net Income
Operating Expenses
Operating Profit
% Change (Y-o-Y)
Other Provisions
Profit before Tax
Tax Provisions
Net Profit
% Change (Y-o-Y)
4QFY14A
49,527
15
20,014
69,541
31,747
37,794
28
2,861
34,933
11,667
23,266
23
4QFY14E
49,881
16
23,537
73,418
33,204
40,214
36
4,957
35,257
11,625
23,632
25
V/S our Est
-1
-15
-5
-4
-6
-42
-1
0
-2
Comments
NIMs and loan growth largely in-line with expectation
Lower than expected forex income and trading gains
Operating leverage helped boost profitability
Asset quality stable QoQ
In-line with estimates
Source: MOSL, Company
Non-core income below est.; Opex a key drive of profit yet again
Significantly lower than
expected non-core income,
but control over opex helps
profitability
NIM for the quarter improved by 15bp+ QoQ to 4.4% v/s expectation of 5bp
improvement. (FY14 NIMs at 4.4% v/s 4.5% in FY13).
While NII was in-line with estimate, core fees were marginally below estimate
and grew just 10% YoY.
Forex income moderated sharply to INR2.5b (v/s INR3.3b in 3QFY14 and
expectation of INR4b). Profit on sale of investment was lower as well at
INR333m as compared to expectation of INR1.8b. Lower non-core income led to
total revenues being 5% below expectations.
HDFCB demonstrated strong control over opex (flat YoY) yet again and as a
result cost to core income was contained at 47% as compared to 53% in 4QFY13
(44% in 3QFY14).
Strong growth in overseas portfolio helps overall loan growth
Reported loans grew 26%
YoY driven by strong growth
in overseas loans portfolio
(contribution to
incremental loans in FY14
was at 23%).
Reported loans grew 26% YoY driven by strong growth in overseas loans
portfolio (contribution to incremental loans in FY14 was at 23%) partially driven
by levered FCNR (B) product (USD 1.8b deployed in 3QFY14).
Domestic corporate loans grew 38% YoY (adjusted for sell-down in 4Q growth
would have been lower) and formed ~47% of the domestic loans as compared to
41% in FY13.
Retail loan growth for the quarter was ~1.4% QoQ and 10% YoY. Decline in CV
loans (down 10% YoY and 14% QoQ), gold loans (down 19% YoY), moderation in
auto loans (+7% YoY and down 2% QoQ) and business banking (+2% YoY and
down 6% QoQ) led to moderation in retail loans. There is also element of
reclassification in some retail loan segment which led to lower reported growth.
Home loans (20% QoQ and 15% YoY), credit cards (5% QoQ and 21% YoY) and
personal loans (+2% QoQ and 17% YoY) helped overall retail loan growth.
Net stress loans one of the
lowest in the industry at
50bp vs 40bp in FY13
Asset quality stable QoQ; lowest net stress loans
Net slippages for the year remained contained at 0.9%, marginally higher than
average of 0.8% in FY11/13. In absolute terms, GNPAs was flat QoQ and in
percentage terms, it stood at 1%. NNPAs remained at a low level of 0.3%.
22 April 2014
2

HDFC Bank
Other highlights
CASA ratio improved QoQ:
1) strong SA deposits growth of 9% QoQ (+17% YoY)
and CA float (+26% QoQ; 17.6% YoY) helped improve overall CASA growth (+17%
QoQ and 15% YoY). CASA ratio improved to 44.8% v/s 41% (43.7% ex-FCNR (B)
deposits) in 3QFY14.
Tier I ratio improved 30bp QoQ and stood at healthy 11.8%.
Branch expansion slowed down with new addition of 67 in 4QFY14 (286 in
4QFY13) and 341 (230 opened in unbanked locations) in FY14 as compared to
518 in FY13.
Conference Call highlights
Cost of deposits declined from 6.1% to 6% and cost of funds also declined from
5.2% to 5.1%. While yield on loans declined by 30bp for the year, yield on
investment improved maintain NIMs.
Fee income growth moderated partially on account of slowdown in third party
products which declined 19% YoY (formed 11% of overall fees as compared to
15% in FY14). Some of the other retail products were also impacted due to
change in regulatory environment (debit card fees, sale of gold coins). Retail fee
forms 80% of overall fee.
Large part of the fees is transactional in nature rather than linked to lending,
hence consumption of capital is lower.
Opex control in FY14 was driven by moderation in most of the major lines of
opex with advertising and publicity and printing and stationery reporting a 10%+
YoY decline.
Slippages for FY14 stood at INR46.2b as compared to INR18.6b in FY13. However
during the year bank changed its accounting policy wherein it reports a gross
number as compared to net numbers till FY13.
Delinquency in CV segment seems to have peaked and incremental trend is
better than earlier quarters.
As bank have opened large part of its branches in unbanked area which could be
utilized to open new branches in desired regions. Bank expects to add 200+
branches a year going forward.
Provisions Break-up:
(1) loan loss provisions - INR16.3b, (2) standard asset
provisions INR2.2b and (3) other provisions write-back of INR2.3b.
LAP forms ~6/7% of retail loans (is included in business banking).
22 April 2014
3

HDFC Bank
Valuation and view
Buy with a target price of
INR825 (3.2x FY16 BV)
Operating leverage playing out:
As the core revenues are under pressure,
HDFCB is constantly striving to get operating leverage by improving productivity
from the expansion happened in the last three years and cutting flab from the
system. Efforts are demonstrated by 25% CAGR+ in core PPP despite
moderation in core revenues. Strong control over opex (up just 7% YoY for FY14)
is commendable as HDFCB has opened 860 branches over last two years (314 in
FY14). With the ageing of branches, operating leverage to play out further and
will be key to earnings growth in the moderate growth environment.
HDFCB seem best placed in the current environment
with (1) CASA ratio of
~45%, (2) growth outlook of at-least 1.3x the industry growth, (3) improving
operating efficiency, (4) expected traction in income due to strong expansion in
branch network, and (5) best in the class asset quality. Biggest risk to earnings
for private financials is the implementation of dynamic provisioning by RBI
wherein, HDFCB is best placed due to floating provisions created during the last
three years. HDFCB carries floating provisions of INR18.7b created to smooth
out the earnings growth led by better-than-factored credit cost on retail loans.
Earnings CAGR of 25% - best among large private banks:
HDFCB earnings
growth is expected to be strong at 25% as core income growth picks up led by
healthy loan growth, stable NIMs and improvement in fee income. Further, opex
growth is expected to be lower at 15% CAGR over FY14/16 resulting into core
PPP growth of 25%+. Asset quality is at its best and credit cost is expected to
increase going forward which will take away the benefit of better trading profits.
Attractive valuations for strong liability franchise:
Over the last 12 years,
HDFCB’s market share has increased significantly in (1) retail loans, (2) low cost
deposits and (3) higher share in profitability; indicating the strength of its
franchisee. Strong fundamentals and near nil stress loans would enable the bank
to gain further market share. While FIPB approval and reduction in weights in
MSCI index can impact stock performance we believe valuations are at an
attractive level, with one-year forward P/BV of 3.4x (near its LPA). Comfort on
earnings (+25% CAGR) remains high and RoE expected to be at decadal best of
22%+.
Old Estimates
FY15
FY16
223.0
273.7
99.3
119.0
322.3
392.8
140.2
165.4
182.2
227.4
24.3
30.1
157.9
197.3
51.3
64.1
106.6
133.1
4.7
4.7
0.7
0.7
2.0
2.1
22.8
23.8
New Estimates
FY15
FY16
221.6
272.2
96.8
115.5
318.4
387.7
134.6
158.0
183.9
229.7
24.4
30.6
159.5
199.1
53.4
66.7
106.0
132.4
4.6
4.6
0.7
0.7
2.0
2.0
22.3
23.4
% Change
FY15
FY16
-0.7
-0.5
-2.5
-3.0
-1.2
-1.3
-4.0
-4.5
0.9
1.0
0.4
1.6
1.0
0.9
4.1
4.0
-0.5
-0.6
We largely maintain our earnings estimate
INR b
Net Interest Income
Other Income
Total Income
Operating Expenses
Operating Profits
Provisions
PBT
Tax
PAT
Margins (%)
Credit Cost (%)
RoA (%)
RoE (%)
22 April 2014
4

HDFC Bank
DuPont Analysis: Strong improvement in risk adjusted NIMs and operating leverage; RoAs are at a decadal high (%)
Y/E March
Net Interest Income
Core Fee Income
Fee to core Income
Core Income
Operating Expenses
Cost to Core Income
Employee cost
Others
Core operating Profits
Trading and others
Operating Profits
Provisions
NPA
PBT
Tax
Tax Rate
RoA
Leverage (x)
RoE
FY05
3.85
1.37
26.18
5.22
2.92
56.02
0.59
2.33
2.29
0.17
2.46
0.37
0.37
2.09
0.67
32.01
1.42
12.99
18.45
FY06
4.19
1.58
27.38
5.77
3.39
58.72
0.78
2.61
2.38
0.40
2.78
0.78
0.78
2.01
0.61
30.53
1.39
12.72
17.74
FY07
4.71
1.69
26.46
6.40
3.61
56.45
0.94
2.67
2.79
0.35
3.13
1.14
1.06
1.99
0.60
30.35
1.39
14.04
19.46
FY08
5.03
1.57
23.75
6.60
3.84
58.25
1.16
2.68
2.75
0.66
3.41
1.38
1.14
2.03
0.62
30.27
1.42
12.52
17.74
FY09
4.85
1.46
23.14
6.31
3.76
59.61
1.41
2.35
2.55
0.88
3.43
1.34
1.25
2.09
0.67
31.96
1.42
11.92
16.91
FY10
4.28
1.49
25.86
5.77
3.19
55.30
1.13
2.06
2.58
0.76
3.34
1.23
1.13
2.11
0.66
31.25
1.45
11.09
16.12
FY11
4.40
1.39
23.97
5.79
3.11
53.79
1.13
1.98
2.67
0.59
3.27
0.94
0.48
2.33
0.76
32.52
1.57
10.66
16.74
FY12
4.19
1.37
24.63
5.56
3.02
54.27
1.11
1.91
2.54
0.51
3.05
0.61
0.35
2.44
0.76
31.23
1.68
11.13
18.69
FY13
4.28
1.34
23.89
5.63
3.04
54.09
1.07
1.97
2.58
0.51
3.10
0.45
0.33
2.64
0.82
31.02
1.82
11.16
20.34
FY14
FY15E
FY16E
4.14
4.10
4.16
1.25
1.26
1.23
23.11
23.48
22.75
5.39
5.36
5.39
2.70
2.49
2.42
50.10
46.47
44.84
0.94
0.89
0.88
1.76
1.60
1.53
2.69
2.87
2.97
0.53
0.53
0.54
3.22
3.40
3.51
0.36
0.45
0.47
0.37
0.44
0.46
2.86
2.95
3.04
0.96
0.99
1.02
33.62
33.50
33.50
1.90
1.96
2.02
11.19
11.36
11.54
21.28
22.30
23.36
Source: Company, MOSL
DuPont Analysis: Lower contribution of non-core income has led to sequential decline in RoA (%)
1QFY12 2QFY12 3QFY12 4QFY12 1QFY13 2QFY13 3QFY13 4QFY13 1QFY14 2QFY14 3QFY14 4QFY14
NII
4.04
3.91
3.83
4.23
4.19
4.21
4.19
4.38
4.33
4.23
4.12
4.13
Fee Inc. (ex-forex)
1.32
1.32
1.40
1.48
1.32
1.32
1.49
1.41
1.26
1.28
1.40
1.27
Core Income
5.37
5.24
5.22
5.71
5.51
5.54
5.67
5.79
5.59
5.50
5.52
5.40
Opex
2.75
2.70
2.65
3.16
3.01
2.91
2.93
3.20
2.98
2.77
2.58
2.65
Cost to Core Inc
51.19
51.54
50.75
55.40
54.69
52.63
51.68
55.24
53.27
50.32
46.62
49.04
Employee Exp
1.11
1.09
1.07
1.10
1.14
1.04
1.06
1.03
1.09
0.98
0.87
0.88
Other Exp
1.64
1.61
1.59
2.06
1.87
1.87
1.88
2.17
1.89
1.79
1.71
1.76
Core PPP
2.62
2.54
2.57
2.55
2.49
2.62
2.74
2.59
2.61
2.73
2.95
2.75
Trading and others
0.27
0.29
0.35
0.45
0.57
0.27
0.54
0.43
0.63
0.46
0.51
0.40
Operating Profit
2.89
2.83
2.92
3.00
3.07
2.89
3.28
3.02
3.24
3.20
3.46
3.15
Provisions
0.63
0.49
0.40
0.49
0.67
0.42
0.43
0.31
0.52
0.36
0.35
0.24
PBT
2.26
2.34
2.52
2.51
2.40
2.47
2.86
2.72
2.72
2.83
3.11
2.91
Tax
0.72
0.75
0.76
0.79
0.78
0.78
0.90
0.79
0.92
0.96
1.04
0.97
Tax Rate
31.75
31.85
30.22
31.29
32.30
31.53
31.56
29.01
33.65
33.94
33.53
33.40
ROA
1.54
1.59
1.76
1.73
1.62
1.69
1.95
1.93
1.81
1.87
2.07
1.94
Leverage (x)
10.83
11.01
11.33
11.33
11.34
11.35
11.07
10.94
10.94
10.74
10.79
11.11
ROE
16.68
17.56
19.90
19.57
18.43
19.21
21.62
21.10
19.77
20.10
22.32
21.55
Source: Company, MOSL
22 April 2014
5

HDFC Bank
Story in Charts
Strong loan growth driven by international loans
Loans (INR b)
20
20
22
22
22
23
24
YoY Growth (%)
23
21
16
23
26
Deposit growth among the best in the industry
Deposits (INR b)
YoY Gr (%)
22.9 24.0
21.0 18.3 22.0 18.8 22.2 20.1 17.8
15.4 18.1
14.2
Source: Company, MOSL
CASA ratio improves QoQ (%)
CASA Deposits (INR b)
CASA Ratio (%)
QoQ accretion in savings deposits was strong
Quarterly Accretion of SA Deposits (INR b)
Source: Company, MOSL
Growth in PL and CC is moderating on high base
PL and CC (INR b)
33
36
38
37
37
37
32
YoY Growth (%)
30
Share of vehicle loans coming down led by CV and CE
Vehicle Loans (INR b)
25
19
18
29
30
24
30
26
YoY Growth (%)
28
23
21
19
17
9
9
508
2
164 179 196 209 225 245 268 276 292 302 318 327
343 381 408 420 446 482 494 501 522 526 536
Source: Company, MOSL
22 April 2014
6

HDFC Bank
NIMs improves 15bp+ QoQ (%)
4.4
4.2
4.1 4.1
4.6
4.4
4.6 4.6
4.3
4.3
4.2
4.4
Asset quality remains impeccable
Net NPAs (%)
1.1
1.0 1.0 1.0 1.0 1.0
1.0 1.0
1.0 1.0 1.0
0.9
Gross NPAs (%)
0.2 0.2 0.2 0.2 0.2 0.2 0.2 0.2
0.3 0.3
0.2
0.3
Source: Company, MOSL
Fee income growth remains moderate
Fee Inc.(INR b)
Fee Inc. as % of Avg. Assets
Opex gr. moderation leading to strong core PPP gr. (YoY %)
Opex Growth
40
30
20
10
0
Core PPP Growth
1.5 1.4
1.5
1.4
1.3 1.3 1.4
1.3 1.3
1.3
1.3 1.3
Source: Company, MOSL
Branch expansion continues; ATM declines QoQ
Branches
ATM
Retail loan growth moderates driven by vehicle loans
Source: Company, MOSL
22 April 2014
7

HDFC Bank
Quarterly Snapshot
Source: Company, MOSL
22 April 2014
8

HDFC Bank
Quarterly Snapshot continued
(INR b)
1Q
Balance Sheet
ESC
5
Reserves and Surplus 262
Net Worth
267
Deposits
2,112
Borrowings
220
Other Liabilities
262
Total Liabilities
2,859
Cash
Money at call
Investments
Advances
Total earning assets
Fixed Assets
Other Assets
Total Assets
Loan Break Up (%)
Retail
Auto Loans
Personal Loans
LAS
Two wheeler
CV & CE
Credit Cards
Business Banking
Home loans
Gold loans
Kissan Gold Cards
Other Retail loans
Corp. & Intl
Franchise
Branches
ATM
2.2
52.2
2,111
5,998
2.4
50.7
2,150
6,520
3.0
48.4
2,201
7,110
3.7
45.2
2,544
8,913
3.4
47.6
3.7
46.8
177
35
729
1,755
2,520
22
141
2,859
47.8
13.2
6.3
0.6
1.2
5.2
3.1
8.8
6.3
1.0
2Q
5
275
280
2,307
223
348
3,157
216
20
788
1,885
2,693
22
227
3,157
49.3
13.1
6.4
0.5
1.2
6.0
3.1
8.9
6.5
1.1
FY12
3Q
5
290
295
2,325
244
491
3,355
190
35
802
1,943
2,780
22
363
3,355
51.6
13.3
6.7
0.5
1.2
6.5
3.3
8.9
6.8
1.3
4Q
5
295
299
2,467
238
374
3,379
150
59
975
1,954
2,988
23
217
3,379
54.8
13.5
7.1
0.5
1.3
6.7
3.6
9.5
7.3
1.5
1Q
5
311
316
2,575
261
448
3,600
183
57
902
2,133
3,092
24
301
3,600
52.4
12.9
6.9
0.5
1.2
6.8
3.6
9.2
6.4
1.6
FY13
2Q
3Q
5
329
333
2,741
310
389
3,774
217
50
917
2,316
3,284
25
248
3,774
53.2
12.5
6.8
0.4
1.2
7.1
3.7
9.3
6.7
1.7
5
350
354
2,841
316
326
3,837
200
47
960
2,415
3,422
26
190
3,837
53.8
12.4
7.0
0.4
1.2
6.8
4.1
9.6
6.6
1.9
2.1
1.7
46.2
2.2
43.1
4.8
45.7
FY14
4Q
5
357
362
2,962
330
349
4,003
146
127
1,116
2,397
3,640
27
190
4,003
56.9
12.9
7.3
0.5
1.3
6.7
4.2
10.2
7.0
2.1
1Q
5
379
384
3,033
391
355
4,163
190
64
1,048
2,586
3,699
29
246
4,163
54.3
12.5
7.2
0.4
1.2
6.5
4.1
9.2
6.6
1.8
2Q
5
400
405
3,130
393
383
4,312
199
81
1,019
2,686
3,786
29
297
4,312
53.6
12.1
7.2
0.4
1.2
6.3
4.0
9.6
6.1
1.6
2.9
2.2
46.4
3Q
5
424
429
3,492
438
322
4,681
213
139
1,106
2,967
4,213
29
226
4,681
49.7
11.3
6.8
0.3
1.1
5.6
3.9
9.0
5.4
1.4
2.9
1.9
50.3
4Q
5
430
435
3,673
394
413
4,916
253
142
1,210
3,030
4,382
29
251
4,916
49.4
10.9
6.7
0.4
1.1
4.8
4.0
8.3
6.4
1.3
3.5
2.0
50.6
Variation (%)
QoQ
YoY
0
1
1
5
-10
28
5
19
2
9
2
4
0
11
5
-35
-41
-3
3
0
-88
10
-71
94
-5
59
8
35
2
-2
1
20
20
24
19
19
23
73
13
8
26
20
9
32
23
-750
-200
-56
-13
-15
-196
-17
-196
-63
-74
349
-18
750
11
5
2,564 2,620 2,776 3,062 3,119 3,251 3,336 3,403
9,709 10,316 10,490 10,743 11,088 11,177 11,473 11,256
Source: Company, MOSL
22 April 2014
9

HDFC Bank
EPS: MOSL forecast v/s consensus (INR)
MOSL
Forecast
FY15
FY16
44.2
55.2
Consensus
Forecast
43.6
54.3
Variation
(%)
1.3
1.7
Stock performance (1-year)
Shareholding pattern (%)
Mar-14
Promoter
Domestic Inst
Foreign
Others
22.7
9.8
51.4
16.1
Dec-13
22.7
9.3
52.3
15.8
Mar-13
22.9
8.6
51.7
16.9
22 April 2014
10

HDFC Bank
Financials and valuations
Income Statements
Y/E March
Interest Income
Interest Expense
Net Interest Income
Change (%)
Non Interest Income
Net Income
Change (%)
Operating Expenses
Pre Provision Profits
Change (%)
Provisions (excl tax)
PBT
Tax
Tax Rate (%)
Profits for Equity SH
Change (%)
Equity Dividend (Incl tax)
Core PPP*
Change (%)
2013
350.6
192.5
158.1
22.7
68.5
226.6
21.4
112.4
114.3
21.7
16.8
97.5
30.2
31.0
67.3
30.2
15.4
97.6
22.9
2014
411.4
226.5
184.8
16.9
79.2
264.0
16.5
120.4
143.6
25.7
15.9
127.7
42.9
33.6
84.8
26.1
19.1
121.8
24.7
(INR Billion)
2015E
491.7
270.1
221.6
19.9
96.8
318.4
20.6
134.6
183.9
28.0
24.4
159.5
53.4
33.5
106.0
25.1
24.7
155.0
27.3
2016E
594.3
322.0
272.2
22.9
115.5
387.7
21.8
158.0
229.7
24.9
30.6
199.1
66.7
33.5
132.4
24.9
30.8
194.4
25.4
Ratios
Y/E March
Spreads Analysis (%)
Avg. Yield-Earning Assets
Avg. Yield on loans
Avg. Yield on Investments
Avg. Cost-Int. Bear. Liab.
Avg. Cost of Deposits
Interest Spread
Net Interest Margin
Profitability Ratios (%)
RoE
RoA
Int. Expense/Int.Income
Fee Income/Net Income
Non Int. Inc./Net Income
Efficiency Ratios (%)
Cost/Income*
Empl. Cost/Op. Exps.
Busi. per Empl. (Rs m)
NP per Empl. (Rs lac)
Asset-Liabilty Profile (%)
Loans/Deposit Ratio
CASA Ratio
Investment/Deposit Ratio
G-Sec/Investment Ratio
CAR
Tier 1
2013
10.6
12.3
7.5
6.4
6.0
4.2
4.8
20.3
1.8
54.9
27.3
30.2
49.9
35.3
72.4
1.0
80.9
47.4
37.7
76.1
16.8
11.1
2014
10.3
11.7
7.8
6.2
5.7
4.1
4.6
21.3
1.9
55.1
27.0
30.0
45.8
34.7
87.9
1.2
82.5
44.8
32.9
79.0
16.1
11.8
2015E
10.1
11.4
7.6
6.1
5.7
4.0
4.6
22.3
2.0
54.9
27.6
30.4
45.5
35.7
106.9
1.5
85.9
44.1
31.6
82.4
15.2
11.6
2016E
10.0
11.1
7.6
6.0
5.6
4.0
4.6
23.4
2.0
54.2
26.8
29.8
43.9
36.5
126.3
1.8
87.3
43.0
29.5
88.1
14.2
11.2
Balance Sheet
Y/E March
Equity Share Capital
Reserves & Surplus
Net Worth
Deposits
Change (%)
of which CASA Dep
Change (%)
Borrowings
Other Liabilities & Prov.
Total Liabilities
Current Assets
Investments
Change (%)
Loans
Change (%)
Fixed Assets
Other Assets
Total Assets
2013
4.8
357.4
362.1
2,962.5
20.1
1,405.2
17.7
330.1
348.6
4,003.3
272.8
1,116.1
14.5
2,397.2
22.7
27.0
190.1
4,003.3
2014
4.8
430.0
434.8
3,673.4
24.0
1,646.2
17.2
394.4
413.4
4,916.0
395.8
1,209.5
8.4
3,030.0
26.4
29.4
251.2
4,916.0
(INR Billion)
2015E
4.8
511.3
516.1
4,408.0
20.0
1,944.7
18.1
445.5
516.7
5,886.4
374.8
1,390.9
15.0
3,787.5
25.0
31.7
301.5
5,886.4
2016E
4.8
612.9
617.7
5,421.9
23.0
2,333.6
20.0
508.5
645.8
7,193.8
465.3
1,599.6
15.0
4,734.4
25.0
32.8
361.8
7,193.8
Valuation
Y/E March
Book Value (INR)
Change (%)
Price-BV (x)
Adjusted BV (INR)
Price-ABV (x)
EPS (INR)
Change (%)
Price-Earnings (x)
Dividend Per Share (INR)
Dividend Yield (%)
2013
152.1
19.4
4.8
150.7
4.8
28.3
28.4
25.7
5.5
0.8
2014
181.1
19.1
4.0
178.7
4.1
35.3
25.0
20.6
6.8
0.9
2015E
215.0
18.7
3.4
211.1
3.4
44.2
25.1
16.4
8.8
1.2
2016E
257.4
19.7
2.8
250.8
2.9
55.2
24.9
13.2
11.0
1.5
Asset Quality
Y/E March
GNPA
NNPA
GNPA Ratio
NNPA Ratio
PCR (Excl Tech. write off)
PCR (Incl Tech. Write off)
2013
23.3
4.7
1.0
0.2
79.9
79.9
2014
29.9
8.2
1.0
0.3
72.6
72.6
(INR Billion)
2015E
46.6
13.6
1.2
0.4
70.9
70.9
2016E
71.2
22.3
1.5
0.5
68.6
68.6
22 April 2014
11

Disclosures
This report is for personal information of the authorized recipient and does not construe to be any investment, legal or taxation advice to you. This research report does not constitute an offer, invitation or
inducement to invest in securities or other investments and Motilal Oswal Securities Limited (hereinafter referred as MOSt) is not soliciting any action based upon it. This report is not for public distribution
and has been furnished to you solely for your information and should not be reproduced or redistributed to any other person in any form.
Unauthorized disclosure, use, dissemination or copying (either whole or partial) of this information, is prohibited. The person accessing this information specifically agrees to exempt MOSt or any of its
affiliates or employees from, any and all responsibility/liability arising from such misuse and agrees not to hold MOSt or any of its affiliates or employees responsible for any such misuse and further agrees
to hold MOSt or any of its affiliates or employees free and harmless from all losses, costs, damages, expenses that may be suffered by the person accessing this information due to any errors and delays.
HDFC Bank
The information contained herein is based on publicly available data or other sources believed to be reliable. While we would endeavour to update the information herein on reasonable basis, MOSt and/or
its affiliates are under no obligation to update the information. Also there may be regulatory, compliance, or other reasons that may prevent MOSt and/or its affiliates from doing so. MOSt or any of its
affiliates or employees shall not be in any way responsible and liable for any loss or damage that may arise to any person from any inadvertent error in the information contained in this report. MOSt or any
of its affiliates or employees do not provide, at any time, any express or implied warranty of any kind, regarding any matter pertaining to this report, including without limitation the implied warranties of
merchantability, fitness for a particular purpose, and non-infringement. The recipients of this report should rely on their own investigations.
This report is intended for distribution to institutional investors. Recipients who are not institutional investors should seek advice of their independent financial advisor prior to taking any investment decision
based on this report or for any necessary explanation of its contents.
MOSt and/or its affiliates and/or employees may have interests/positions, financial or otherwise in the securities mentioned in this report. To enhance transparency, MOSt has incorporated a Disclosure of
Interest Statement in this document. This should, however, not be treated as endorsement of the views expressed in the report.
Disclosure of Interest Statement
1. Analyst ownership of the stock
2. Group/Directors ownership of the stock
3. Broking relationship with company covered
4. Investment Banking relationship with company covered
HDFC BANK LIMITED
No
No
No
No
Analyst Certification
The views expressed in this research report accurately reflect the personal views of the analyst(s) about the subject securities or issues, and no part of the compensation of the research analyst(s) was, is,
or will be directly or indirectly related to the specific recommendations and views expressed by research analyst(s) in this report. The research analysts, strategists, or research associates principally
responsible for preparation of MOSt research receive compensation based upon various factors, including quality of research, investor client feedback, stock picking, competitive factors and firm revenues.
This report is not directed or intended for distribution to or use by any person or entity resident in a state, country or any jurisdiction, where such distribution, publication, availability or use would be contrary
to law, regulation or which would subject MOSt & its group companies to registration or licensing requirements within such jurisdictions.
Regional Disclosures (outside India)
This report is intended for distribution only to persons having professional experience in matters relating to investments as described in Article 19 of the Financial Services and Markets Act 2000 (Financial
Promotion) Order 2005 (referred to as "investment professionals"). This document must not be acted on or relied on by persons who are not investment professionals. Any investment or investment activity
to which this document relates is only available to investment professionals and will be engaged in only with such persons.
For U.K.
Motilal Oswal Securities Limited (MOSL) is not a registered broker - dealer under the U.S. Securities Exchange Act of 1934, as amended (the"1934 act") and under applicable state laws in the United
States. In addition MOSL is not a registered investment adviser under the U.S. Investment Advisers Act of 1940, as amended (the "Advisers Act" and together with the 1934 Act, the "Acts), and under
applicable state laws in the United States. Accordingly, in the absence of specific exemption under the Acts, any brokerage and investment services provided by MOSL, including the products and services
described herein are not available to or intended for U.S. persons.
This report is intended for distribution only to "Major Institutional Investors" as defined by Rule 15a-6(b)(4) of the Exchange Act and interpretations thereof by SEC (henceforth referred to as "major
institutional investors"). This document must not be acted on or relied on by persons who are not major institutional investors. Any investment or investment activity to which this document relates is only
available to major institutional investors and will be engaged in only with major institutional investors. In reliance on the exemption from registration provided by Rule 15a-6 of the U.S. Securities Exchange
Act of 1934, as amended (the "Exchange Act") and interpretations thereof by the U.S. Securities and Exchange Commission ("SEC") in order to conduct business with Institutional Investors based in the
U.S., MOSL has entered into a chaperoning agreement with a U.S. registered broker-dealer, Motilal Oswal Securities International Private Limited. ("MOSIPL"). Any business interaction pursuant to this
report will have to be executed within the provisions of this chaperoning agreement.
The Research Analysts contributing to the report may not be registered /qualified as research analyst with FINRA. Such research analyst may not be associated persons of the U.S. registered broker-
dealer, MOSIPL, and therefore, may not be subject to NASD rule 2711 and NYSE Rule 472 restrictions on communication with a subject company, public appearances and trading securities held by a
research analyst account.
For U.S.
Motilal Oswal Capital Markets Singapore Pte Limited is acting as an exempt financial advisor under section 23(1)(f) of the Financial Advisers Act(FAA) read with regulation 17(1)(d) of the Financial
Advisors Regulations and is a subsidiary of Motilal Oswal Securities Limited in India. This research is distributed in Singapore by Motilal Oswal Capital Markets Singapore Pte Limited and it is only directed
in Singapore to accredited investors, as defined in the Financial Advisers Regulations and the Securities and Futures Act (Chapter 289), as amended from time to time.
In respect of any matter arising from or in connection with the research you could contact the following representatives of Motilal Oswal Capital Markets Singapore Pte Limited:
Anosh Koppikar
Kadambari Balachandran
Email:anosh.Koppikar@motilaloswal.com
Email : kadambari.balachandran@motilaloswal.com
Contact(+65)68189232
Contact: (+65) 68189233 / 65249115
Office Address:21 (Suite 31),16 Collyer Quay,Singapore 04931
For Singapore
Motilal Oswal Securities Ltd
22 April 2014
Motilal Oswal Tower, Level 9, Sayani Road, Prabhadevi, Mumbai 400 025
Phone: +91 22 3982 5500 E-mail: reports@motilaloswal.com
12