28 April 2014
4QFY14 Results Update | Sector:
Technology
KPIT Technologies
BSE SENSEX
22,632
Bloomberg
Equity Shares (m)
M.Cap. (INR b) / (USD b)
52-Week Range (INR)
1, 6, 12 Rel. Per (%)
S&P CNX
6,761
KPIT IN
194.1
33.3/0.5
189/95
3/9/64
Financials & Valuation (INR Million)
Y/E Mar
Sales
EBITDA
PAT
EPS (INR)
EPS Gr. (%)
BV/Sh.
RoE (%)
RoCE (%)
P/E (x)
EV/EBITDA
2014E 2015E 2016E
26.9
4.2
2.4
12.6
19.0
64.1
20.5
27.7
13.7
7.4
30.9
5.0
3.1
15.4
22.4
79.5
21.4
27.9
11.2
5.9
35.8
6.0
3.8
19.2
24.9
98.7
21.5
28.0
8.9
4.3
CMP: INR172
TP: INR210
Buy
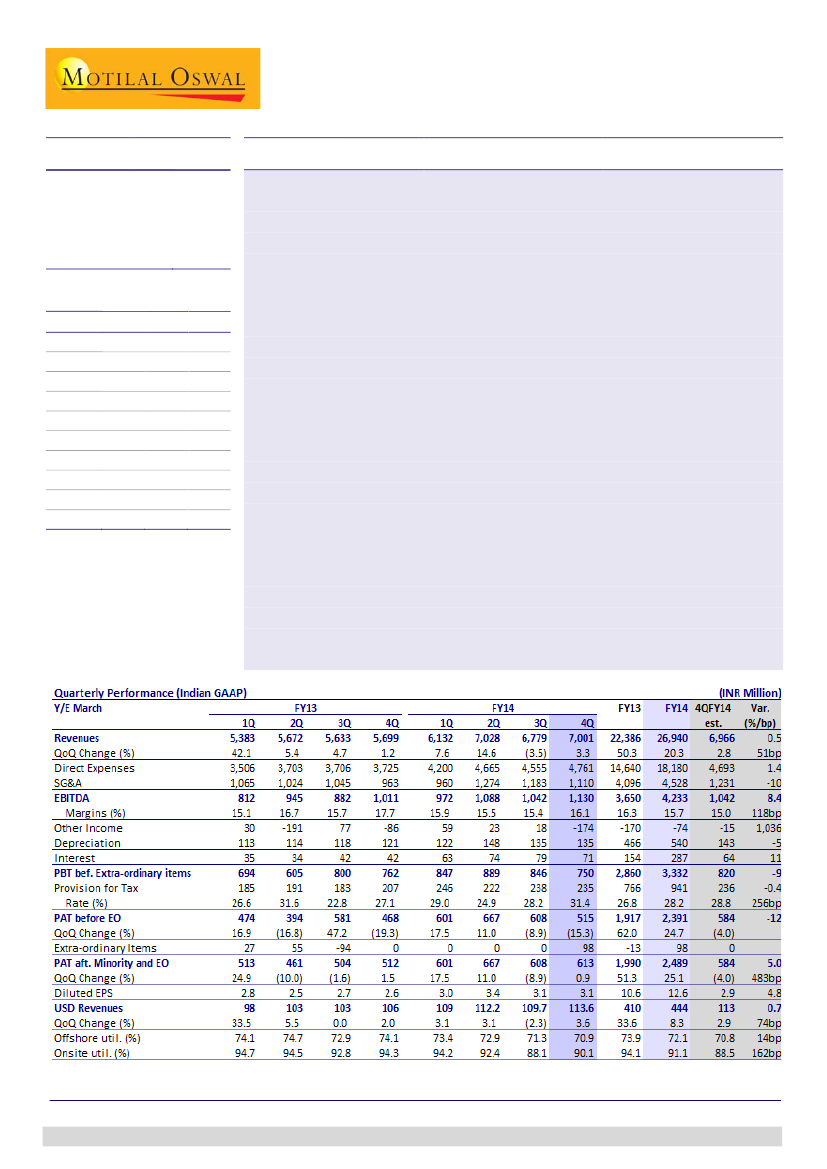
4QFY14 margin above estimate:
KPIT’s 4QFY14 revenues grew 3.6% QoQ to
USD113.6m, marginally ahead of our estimate of USD112.8m. EBITDA margin for
the quarter was 16.1%, +70bp QoQ, above our estimate of 15% (-40bp QoQ). PAT
(excluding exceptional item) was INR515m, below our estimate of INR583m, on
the back of higher forex loss (INR239m loss v/s est. of INR40m loss).
USD revenue guidance implies sustained 4Q traction:
For FY15, KPIT guided for
revenues between USD498-506m, implying growth of 12.1-13.9% YoY (v/s our
organic growth estimate was 13.7%). Guidance is for organic growth and excludes
revenues from purchase agreement with I-Cubed, which is yet to close, and adds
~USD10m in annual revenues. I-Cubed is a US based PLM focused company with
70+ employees and 13% EBITDA margin.
PAT guidance implies margin expansion:
PAT guidance for FY15 is INR2.94-3.00b,
implying growth of 18-21%. This compares with our organic PAT estimate of
INR3.01b. Guidance implies EBITDA margin of ~17%, compared to 15.7% in FY14.
Change in estimates:
Our USD revenue estimates for FY15/16 are up by 2%/2.2%,
as we factor numbers from I-Cubed acquisition from 2QFY15. Our margin
estimates are unchanged, and EPS estimates are changed by 1.3%/-0.9%, after
factoring lower other income owing to purchase consideration
Valuation View:
KPIT remains focused on select verticals, evidenced as the
company added strong ERP capabilities to its Engineering prowess by acquisitions.
We expect the company to grow its USD revenues at a CAGR of 16% over FY14-
16E and EPS at a CAGR of 24% during this period. Also, given limited likelihood of
any big ticket acquisition going forward, we expect Free cash flow generation to
improve going forward. Maintain
Buy.
Ashish Chopra
(Ashish.Chopra@MotilalOswal.com); +91 22 3982 5424
Siddharth Vora
(Siddharth.Vora@MotilalOswal.com); +91 22 3982 5585
Investors are advised to refer through disclosures made at the end of the Research Report.

KPIT Technologies
4QFY14: Margin above estimate and PAT before EOI dragged by higher
forex losses
KPIT’s 4QFY14 revenues grew 3.6% QoQ to USD113.6m, marginally ahead of our
estimate of USD112.8m (+2.9% QoQ). In rupee terms, revenue was INR7.00b,
+3.3% QoQ (estimate of INR6.97b). Realized currency rate for the quarter was
INR61.6/USD (v/s assumed rate of INR61.8/USD).
USD Revenue was marginally ahead of our estimate
Source: MOSL, Company
EBITDA margin for the quarter was 16.1%, +70bp QoQ, above our estimate of
15% (-40bp QoQ). SGA was 15.9% (-150bp QoQ), well below our estimate of
17.7%, but gross margin was 32%, -80bp QoQ, v/s our estimate of 32.6% (-
20bp). The divergent trends in SGA and Gross margin was due to reclassification
of some Subject Matter Experts to gross costs, from S&M.
EBITDA margins expanded 70bps due to growth
Source: MOSL, Company
Other income for the quarter was loss of INR173.8m, v/s our estimate of loss of
INR15m. Lower other income was led by higher forex loss of INR239.2m, (v/s
estimate of INR40m loss).
PAT (excluding exceptional item) was INR515m, below our estimate of INR583m,
on the back of higher forex loss. After including exceptional item of INR98m,
reported PAT at INR613m was marginally ahead of our estimate.
28 April 2014
2

KPIT Technologies
Segment-wise performance: Large deal ramp-up in APAC, across SBUs, in
Energy & Utilities vertical drive growth
Energy & Utilities was the fastest growing vertical during the quarter by 23.8%
QoQ, while Manufacturing grew by 4.4% QoQ. Automotive and Transportation
declined during the quarter.
Energy & Utilities vertical continues its healthy growth momentum
Verticals
Automotive & Transportation
Manufacturing
Energy & Utilities
Others
Contr. To
Rev. (%)
33.1
39.2
18.0
9.7
Growth –
QoQ (%)
(5.6)
4.4
23.8
3.5
Contr to
incr. rev (%)
4 Qtr
CQGR (%)
(56.7)
(1.9)
47.4
4.5
99.9
9.5
9.4
(4.9)
Source: Company, MOSL
Among SBUs, growth was broad-based with Auto & Engg growing by 5.7% QoQ,
SAP by 4.4% QoQ and IES by 3.2% QoQ. Growth in SAP SBU was the highest in
last six quarters.
Turnaround in SAP revenues a positive during the quarter
Lines of Business
IES
Auto & Engg
SAP
BTU
Contr. To
Rev. (%)
40.3
25.8
23.9
10.1
Growth –
QoQ (%)
3.2
5.7
4.4
(1.6)
Contr to
incr. rev (%)
4 Qtr
CQGR (%)
35.8
4.3
39.9
2.7
28.8
(1.4)
(4.6)
(0.6)
Source: Company, MOSL
KPIT is ramping up three large deals in APAC region which is driving the revenue
growth during the quarter. RoW grew 36.1% QoQ while America (-0.5% QoQ)
and Europe (-2.5% QoQ) declined.
Large deals won in APAC driving growth
Geographies
America
Europe
RoW
Contr. To
Rev. (%)
69.8
14.5
15.8
Growth –
QoQ (%)
(0.5)
(2.5)
36.1
Contr to
incr. rev (%)
4 Qtr
CQGR (%)
(10.5)
0.0
(10.6)
5.1
121.2
8.8
Source: Company, MOSL
Revenue growth during the quarter was dragged by decline in Cummins
revenues (-10.2% QoQ) while Top 2-5 and 6-10 clients continue its healthy
growth momentum seen in its four quarter CQGR of 4% and 5.4% respectively.
Cummins declined QoQ but flattish YoY
Top Clients
Top Client - Cummins
Top 2-5 Clients
Top 6-10 Clients
Contr. to Rev.
(%)
15.5
20.2
10.1
Growth -
QoQ (%)
(10.2)
3.3
10.6
Contr to incr.
rev (%)
4 Qtr CQGR
(%)
(50.5)
0.2
18.8
4.0
27.8
5.4
Source: Company, MOSL
28 April 2014
3

KPIT Technologies
Cummins revenue flattish YoY
Top Client (USD m)
4.9
9.8
10.5
10.9
3.6
1.0
4.2
-3.0
-11.5
1.6
QoQ Gr (%)
6.1
2.2
-10.2
5.4
SAP finally saw growth during the quarter
SAP (USD m)
23.4
13.7
7.9
-1.8
-5.8 -4.8
-1.4 0.5
-8.7
QoQ Gr (%)
4.4
14.5 15.9 17.6 18.2 20.2 20.4 19.8 17.5 18.2 18.5 19.6 17.6
20.4 21.5 24.5 30.2 32.6 32.0 30.2 28.7 28.3 28.4 26.0 27.1
Source: MOSL, Company
Guidance for FY15: 12-14% USD revenue growth outlook
The company guided for FY15 revenues between USD498-506m, which implies
Yoy growth of 12-14%. The implied CQGR based on the 4Q exit is 3.7%-4.3%. We
were modeling 13.7% YoY growth in USD revenues in FY15, closer to the higher
end of the guided band.
The guidance is purely organic growth and does not embed any number from
acquisition of I-Cubed, as the closure of the same is still pending.
PAT guidance for FY15 is INR2.94-3.00b, which implies growth of 18-21%. Our
estimate PAT estimate for FY15 was INR3,01b, again, at the higher end of the
guided band.
Also, the PAT guidance embeds EBITDA margin of ~17%, v/s our estimate of
16.3%. However, our EBITDA margin estimate is unlikely to change much as we
are factoring acquisition revenues from 2Q.
Announced purchase agreement with I-Cubed
In the April 2014 Board Meeting, KPIT Board has given its approval, subject to
fulfillment of the Conditions Precedent to Closing, for purchase of 100%
ownership stake in a North Carolina, US based PLM focused company I-Cubed. I-
Cubed is a specialist PLM player having strong partnerships with PTC, Autodesk,
Oracle and Siemens. I-Cubed has 70+ employees and had CY13 revenues of
USD10m with an EBITDA of 13%+.
KPIT currently shares 3-4 clients in common with I-Cubed. There are a couple of
I-Cubed customers, where the company sees scope to expand its other
offerings. Also, the revenues from I-cubed are entirely from onsite, and there is
an opportunity to expand margins going forward through offshoring.
The total purchase consideration will be up to USD24.15m, split as guaranteed
payment of USD14.15m (upfront payment of USD12m and the rest after 6
months) and performance-based additional consideration of USD10m, spread
over 3 years.
28 April 2014
4

KPIT Technologies
Turning to Verticalized organization
For the past three years, KPIT was structured by offerings - Engineering (A&E
SBU), Oracle (IES SBU), SAP (SAP SBU) & Consulting (BTU SBU). This resulted in
having an offerings-based emphasis rather than customer-based, within its
focus verticals. With a view to ensure that each customer gets a consolidated
benefit of all offerings, the company has now organized itself by Industry
Verticals (IBUs).
Under the new structure the Sales and Account Management functions have
been organized by verticals and they are backed by the offerings provided by
SBUs. Currently the company is in the process of implementing the new
organization structure across KPIT and the full implementation is planned to be
completed by end of 1QFY15.
Estimates unchanged excluding the impact from acquisition
Our estimates for KPIT are relatively unchanged post the results – on an organic
basis. However, FY15E/16E USD revenue upgrades of 2%/2.2% are an outcome
of factoring revenues from I-Cubed acquisition. While the management has not
embedded the same in its guidance, we assume revenue accrual from the
acquisition from 2QFY15.
Our margin estimates are unchanged, as headwinds to margins from the
acquisition are minimal. However, the impact on EPS is lower than that on USD
revenues due to other income foregone on purchase consideration.
Change in Estimates
Revised
FY15E
FY16E
60.0
60.0
514.3
597.4
15.7
16.2
16.3
16.9
15.4
19.2
22.4
24.9
Earlier
FY15E
FY16E
60.0
60.0
504.1
584.4
13.7
15.9
16.3
17.2
15.2
19.4
22.3
27.7
Change (%)
FY15E
FY16E
0.0
0.0
2.0
2.2
210bp
20bp
0bp
-30bp
1.3
-0.9
Source: MOSL, Company
INR/USD
USD Revenue (m)
USD revenue growth (%)
EBITDA Margin (%)
EPS (INR)
EPS Growth (%)
Valuation and View
KPIT remains focused on select verticals, evidenced as the company added
strong ERP capabilities to its Engineering prowess by acquisitions of CPG, Sparta
and Systime. Going forward, it is looking to expand to new-age services like
Analytics, PLM and even IMS. Its focus on Auto engineering services should also
serve it well in its quest to expand to USD1b in revenues in a few years time.
While growth in FY15 should revert to close to industry levels, outperformance
to the same is unlikely given the expectation of flattish performance in top
account Cummins and likelihood of high single digits or low double digit revenue
growth in SAP.
KPIT trades at 11x FY15E and 9x FY16E EPS. We expect the company to grow its
USD revenues at a CAGR of 15.9% over FY14-16E and EPS at a CAGR of 23.7%
during this period. Also, given limited likelihood of any big ticket acquisition
going forward, we expect free cash flow generation to improve going forward.
Maintain
Buy,
with a price target of INR210, which discounts FY16E EPS by 11x.
5
28 April 2014

KPIT Technologies
Other result highlights
Total development team at the end of the quarter increased by 153 to 8,583.
Offshore utilization during the quarter was 70.9%, down 40bp QoQ.
KPIT added 3 new clients during the quarter taking total active client count to
198.
Total amount of USD hedges at the end of the quarter stand at USD42.3m.
These hedges are maturing in FY15 and average rate for these hedges is INR63.5
The Cash Balance as at the end of the quarter stood at INR 3.73b as compared
to INR4.45b in the previous quarter.
Total debt decreased to INR4.94b from INR5.11b at the end of previous quarter.
Debtor days at the end of the quarter increased by 11 days to 87 (from 76 in the
previous quarter). The credit period for largest customer Cummins was
increased to 60 days from the earlier 40 days. This change had an impact of
around 4-5 days on the overall DSO.
Revenue proportion from Fixed Price contracts increased 270bps QoQ to 27.1%
28 April 2014
6

KPIT Technologies
Story in Charts
Offerings focused on select verticals, with mix of IT and Engg
Auto Engg to be the key growth driver
Source: Company, MOSL
SAP drag FY14 performance, to return to growth in FY15
SAP turnaround drives positive revenue outlook…
Source: Company, MOSL
…and outlook of healthy profit growth
Unlikelihood of large acquisitions to help improve FCF
FCF (INR m)
1,969
-400
-2,068
FY11
FY12
-611
-1,463
FY13
FY14
FY15E
Source: Company, MOSL
28 April 2014
7

KPIT Technologies
Operating Metrics
1QFY13
Geography Analysis (%)
USA
Europe
ROW
LOB Analysis (%)
Integrated Enterprise Solutions
Auto & Engg
SAP
Business Transformation Unit
Customer Details
No. of Customers Added
No. of Active Customers
Customers with a runrate of > $1m
Top Customer - Cummins
Top 5 Customers (%)
Top 10 Customer (%)
Revenue Split (%)
Onsite Revenues
Offshore Revenues
Contract Type (%)
T&M
FP
Debtor Days
HR - Details
Development Team:
Onsite (Avg)
Offshore (Avg)
Onsite FTE
Offshore FTE
Total FTE
Development
Support
Marketing
Total
Utilization (%)
Onsite
Offshore (Incl. Trainees)
76.2
13.7
10.1
2QFY13
76.6
12.6
10.9
3QFY13
75.1
13.6
11.3
4QFY13
75.1
12.8
12.1
1QFY14
75.0
13.1
11.9
2QFY14
71.9
13.8
14.5
3QFY14
72.7
15.4
12.0
4QFY14
69.8
14.5
15.8
32.9
23.7
33.3
10.1
34.3
24.4
31.0
10.3
35.6
23.4
29.2
11.9
36.7
25.0
27.2
11.1
39.5
23.6
26.0
10.8
39.5
24.2
25.3
11.0
40.5
25.3
23.7
10.6
40.3
25.8
23.9
10.1
3
172
65
20.6%
36.3%
44.0%
4
176
69
19.7%
35.2%
43.7%
2
178
72
19.1%
36.8%
45.2%
5
183
78
16.6%
35.2%
44.0%
6
189
78
16.8%
38.6%
47.3%
3
192
78
16.5%
38.0%
46.3%
3
195
78
17.9%
38.2%
47.6%
3
198
80
15.5%
35.7%
45.8%
52.7
47.3
53.8
46.2
54.7
45.3
53.8
46.2
54.2
45.8
54.6
45.4
52.8
47.2
54.3
45.7
72.0
28.1
75
72.7
27.3
75
70.1
29.9
70
72.7
27.3
75
76.9
23.2
77
76.4
23.6
75
75.6
24.4
76
72.9
27.1
87
1,031
6,074
977
4,501
5,478
7,218
530
125
7,873
94.7%
74.1%
1,126
6,207
1,064
4,638
5,702
7,447
536
128
8,111
94.5%
74.7%
1,148
6,364
1,066
4,637
5,703
7,616
538
132
8,286
92.8%
72.9%
1,139
6,486
1,074
4,805
5,879
7,648
538
135
8,321
94.3%
74.1%
1,176
6,553
1,107
4,809
5,916
7,771
545
140
8,456
94.2%
73.4%
1,243
6,708
1,148
4,888
6,036
8,122
548
146
8,816
92.4%
72.9%
1,274
6,987
1,123
4,985
6,108
8,430
554
152
9,136
1,366
7,139
1,231
5,064
6,295
8,583
558
155
9,296
88.1%
90.1%
71.3%
70.9%
Source: Company, MOSL
28 April 2014
8

KPIT Technologies
KPIT Technologies: an investment profile
Company description
KPIT Cummins is a leading technology solutions partner
for global manufacturing corporations, with special
focus on automotive, energy & utilities, industrial
equipments and semiconductor industries. With over
USD444m revenue (LTM) and 9,296 employees,
company continues to focus on its chosen areas to
grow, with equal thrust on organic and inorganic
approaches.
Recent developments
KPIT Board has given approval to purchase 100%
ownership stake in I-Cubed, a North Carolina US based
PLM focused company for USD24.15m
KPIT added 3 new customers during the quarter.
Valuation and view
Key investment arguments
A rare example in Indian IT of successfully
integrating multiple acquisitions.
Impressive organic growth despite inorganic thrust -
39.5% in FY11, 37% in FY12 and 22% in FY13.
Potential option value from success of its hybrid
engine venture Revolo.
We expect KPIT to post revenue at a CAGR of 15.9%
and EPS CAGR of 23.7% over FY14-16.
The stock trades at 11.2x FY15E and 8.9x FY16E EPS.
Maintain
Buy
with a target price of INR210, which
discounts our FY16E EPS by 11x.
Sector view
Key investment risks
Continued pressure on profit margins due to lower
margin profile of acquisitions.
Limited free cash flow generation due to thrust on
inorganic growth route.
With strengthening demand in the US and large deals
traction in traditional services in Europe, industry
growth in FY15 should be better than FY14.
We see better risk-reward in Tier-I v/s Tier-II, and do
not expect further bridging of the valuation gap on the
following counts: [1] tier-II growth continues to at
best, match tier-I, [2] Current tier-II discount to top-
tier is lower to historical P/E discount, and [3] Cash
conversion capability at tier-II is inferior.
Currency is a key risk to valuations, and Tier-II has a
higher sensitivity to the same v/s Tier-I
Comparative valuations
KPIT
P/E (x)
P/BV (x)
EV/Sales (x)
EV/EBITDA (x)
FY15E
FY16E
FY15E
FY16E
FY15E
FY16E
FY15E
FY16E
11.2
8.9
2.2
1.7
1.0
0.8
6.4
4.3
MTCL
11.7
10.1
2.9
2.3
1.5
1.2
7.2
5.9
HEXW
11.2
10.0
3.2
2.7
1.3
1.1
6.2
5.5
EPS: MOSL forecast v/s consensus (INR)
MOSL
Forecast
15.4
19.2
Consensus
Forecast
16.7
21.5
Variation
(%)
-7.8
-10.7
FY15
FY16
Target price and recommendation
Current
Price (INR)
172
Target
Price (INR)
210
Upside
(%)
22.4
Reco
Buy
Shareholding pattern (%)
Mar-14
Promoter
Domestic Inst
Foreign
Others
22.3
6.9
52.3
18.6
Dec-13
22.5
7.0
51.6
18.9
Mar-13
24.3
11.8
44.1
19.8
Stock performance (1-year)
28 April 2014
9

KPIT Technologies
Financials and valuation
28 April 2014
10

KPIT Technologies
NOTES
28 April 2014
11

Disclosures
This report is for personal information of the authorized recipient and does not construe to be any investment, legal or taxation advice to you. This research report does not constitute an offer, invitation or
inducement to invest in securities or other investments and Motilal Oswal Securities Limited (hereinafter referred as MOSt) is not soliciting any action based upon it. This report is not for public distribution
and has been furnished to you solely for your information and should not be reproduced or redistributed to any other person in any form.
Unauthorized disclosure, use, dissemination or copying (either whole or partial) of this information, is prohibited. The person accessing this information specifically agrees to exempt MOSt or any of its
affiliates or employees from, any and all responsibility/liability arising from such misuse and agrees not to hold MOSt or any of its affiliates or employees responsible for any such misuse and further agrees
to hold MOSt or any of its affiliates or employees free and harmless from all losses, costs, damages, expenses that may be suffered by the person accessing this information due to any errors and delays.
The information contained herein is based on publicly available data or other sources believed to be reliable. While we would endeavour to update the information herein on reasonable basis, MOSt and/or
its affiliates are under no obligation to update the information. Also there may be regulatory, compliance, or other reasons that may prevent MOSt and/or its affiliates from doing so. MOSt or any of its
affiliates or employees shall not be in any way responsible and liable for any loss or damage that may arise to any person from any inadvertent error in the information contained in this report. MOSt or any
of its affiliates or employees do not provide, at any time, any express or implied warranty of any kind, regarding any matter pertaining to this report, including without limitation the implied warranties of
merchantability, fitness for a particular purpose, and non-infringement. The recipients of this report should rely on their own investigations.
KPIT Technologies
This report is intended for distribution to institutional investors. Recipients who are not institutional investors should seek advice of their independent financial advisor prior to taking any investment decision
based on this report or for any necessary explanation of its contents.
MOSt and/or its affiliates and/or employees may have interests/positions, financial or otherwise in the securities mentioned in this report. To enhance transparency, MOSt has incorporated a Disclosure of
Interest Statement in this document. This should, however, not be treated as endorsement of the views expressed in the report.
Disclosure of Interest Statement
1. Analyst ownership of the stock
2. Group/Directors ownership of the stock
3. Broking relationship with company covered
4. Investment Banking relationship with company covered
KPIT TECHNOLOGIES LTD
No
No
No
No
Analyst Certification
The views expressed in this research report accurately reflect the personal views of the analyst(s) about the subject securities or issues, and no part of the compensation of the research analyst(s) was, is,
or will be directly or indirectly related to the specific recommendations and views expressed by research analyst(s) in this report. The research analysts, strategists, or research associates principally
responsible for preparation of MOSt research receive compensation based upon various factors, including quality of research, investor client feedback, stock picking, competitive factors and firm revenues.
This report is not directed or intended for distribution to or use by any person or entity resident in a state, country or any jurisdiction, where such distribution, publication, availability or use would be contrary
to law, regulation or which would subject MOSt & its group companies to registration or licensing requirements within such jurisdictions.
Regional Disclosures (outside India)
This report is intended for distribution only to persons having professional experience in matters relating to investments as described in Article 19 of the Financial Services and Markets Act 2000 (Financial
Promotion) Order 2005 (referred to as "investment professionals"). This document must not be acted on or relied on by persons who are not investment professionals. Any investment or investment activity
to which this document relates is only available to investment professionals and will be engaged in only with such persons.
For U.K.
Motilal Oswal Securities Limited (MOSL) is not a registered broker - dealer under the U.S. Securities Exchange Act of 1934, as amended (the"1934 act") and under applicable state laws in the United
States. In addition MOSL is not a registered investment adviser under the U.S. Investment Advisers Act of 1940, as amended (the "Advisers Act" and together with the 1934 Act, the "Acts), and under
applicable state laws in the United States. Accordingly, in the absence of specific exemption under the Acts, any brokerage and investment services provided by MOSL, including the products and services
described herein are not available to or intended for U.S. persons.
This report is intended for distribution only to "Major Institutional Investors" as defined by Rule 15a-6(b)(4) of the Exchange Act and interpretations thereof by SEC (henceforth referred to as "major
institutional investors"). This document must not be acted on or relied on by persons who are not major institutional investors. Any investment or investment activity to which this document relates is only
available to major institutional investors and will be engaged in only with major institutional investors. In reliance on the exemption from registration provided by Rule 15a-6 of the U.S. Securities Exchange
Act of 1934, as amended (the "Exchange Act") and interpretations thereof by the U.S. Securities and Exchange Commission ("SEC") in order to conduct business with Institutional Investors based in the
U.S., MOSL has entered into a chaperoning agreement with a U.S. registered broker-dealer, Motilal Oswal Securities International Private Limited. ("MOSIPL"). Any business interaction pursuant to this
report will have to be executed within the provisions of this chaperoning agreement.
The Research Analysts contributing to the report may not be registered /qualified as research analyst with FINRA. Such research analyst may not be associated persons of the U.S. registered broker-
dealer, MOSIPL, and therefore, may not be subject to NASD rule 2711 and NYSE Rule 472 restrictions on communication with a subject company, public appearances and trading securities held by a
research analyst account.
For U.S.
Motilal Oswal Capital Markets Singapore Pte Limited is acting as an exempt financial advisor under section 23(1)(f) of the Financial Advisers Act(FAA) read with regulation 17(1)(d) of the Financial
Advisors Regulations and is a subsidiary of Motilal Oswal Securities Limited in India. This research is distributed in Singapore by Motilal Oswal Capital Markets Singapore Pte Limited and it is only directed
in Singapore to accredited investors, as defined in the Financial Advisers Regulations and the Securities and Futures Act (Chapter 289), as amended from time to time.
In respect of any matter arising from or in connection with the research you could contact the following representatives of Motilal Oswal Capital Markets Singapore Pte Limited:
Anosh Koppikar
Kadambari Balachandran
Email:anosh.Koppikar@motilaloswal.com
Email : kadambari.balachandran@motilaloswal.com
Contact(+65)68189232
Contact: (+65) 68189233 / 65249115
Office Address:21 (Suite 31),16 Collyer Quay,Singapore 04931
For Singapore
Motilal Oswal Securities Ltd
28 April 2014
Motilal Oswal Tower, Level 9, Sayani Road, Prabhadevi, Mumbai 400 025
Phone: +91 22 3982 5500 E-mail: reports@motilaloswal.com
12