14 May 2014
4QFY14 Results Update | Sector:
Consumer
Asian Paints
BSE SENSEX
23,815
Bloomberg
Equity Shares (m)
M.Cap. (INR b) / (USD b)
52-Week Range (INR)
1, 6, 12 Rel. Per (%)
S&P CNX
7,109
APNT IN
959.2
534.2/9.0
560/376
-2/-8/-3
Financials & Valuations (INR b)
Y/E MAR
Net Sales
EBITDA
Adj PAT
Adj.EPS(INR)
Gr. (%)
BV/Sh (INR)
RoE (%)
RoCE (%)
P/E (x)
P/BV (x)
2014 2015E 2016E
125.8
18.6
12.3
12.8
10.3
40.6
35.1
39.1
43.5
13.7
146.5
22.3
14.9
15.5
21.1
48.0
36.0
40.2
35.9
11.6
172.3
26.6
17.9
18.7
20.3
56.7
36.7
41.2
29.8
9.8
CMP: INR557
TP: INR520
Neutral
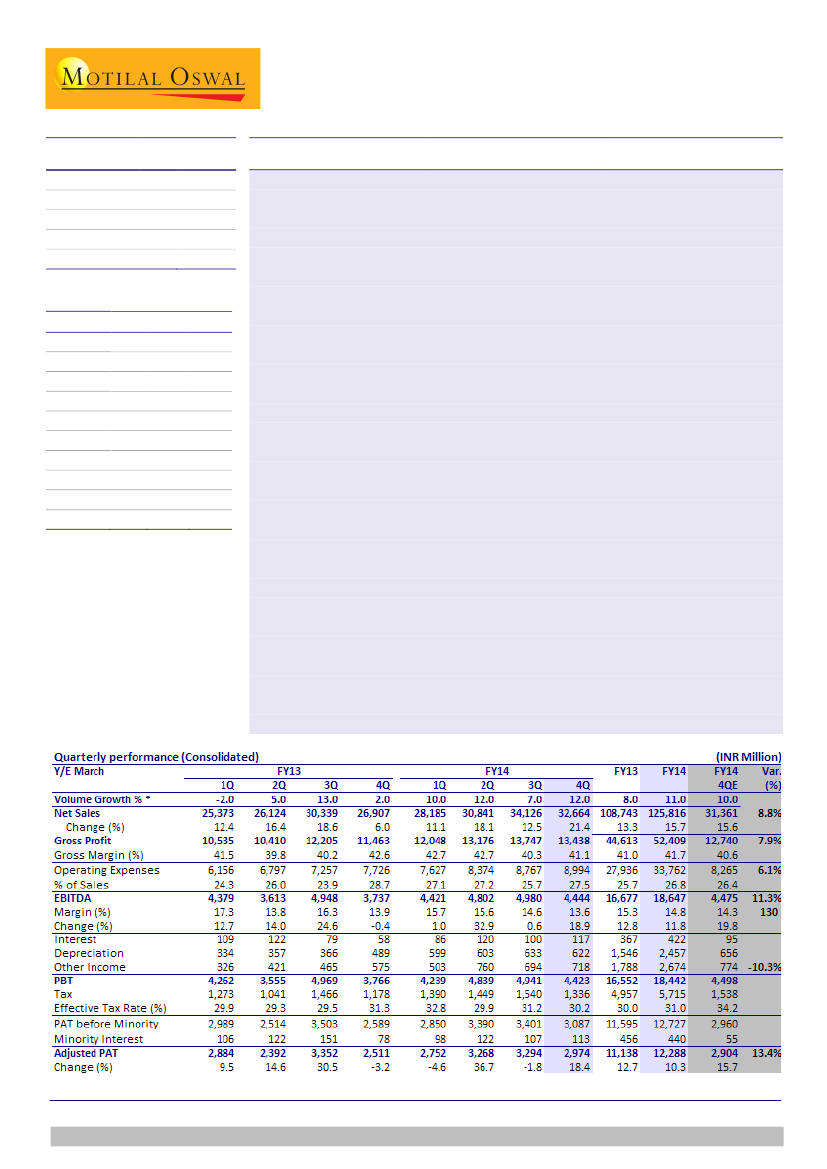
Asian Paints’ (APNT) 4QFY14 results beat our expectations, with consolidated Adj.
PAT at INR3b, up 18.4% YoY (est. INR2.9b). Consolidated net sales grew 21.4%,
9% above estimate, at INR32.6b (est. INR31.3b) led by an estimated 12-13%
domestic paints volume growth (est. 10%). EBITDA margin contracted 30bp at
13.6% (est. 14.3%).
Gross margin declined 150bp YoY but expanded 80bp sequentially. APNT has
announced price hikes of 1% and 1.2% effective May 1 and June 1, 2014
respectively to offset the pressure on gross margin.
EBITDA margin was down 30bp YoY and stood at 13.6%, primarily led by RM
inflation (+150bp YoY), which was partially offset by savings in other expenditure
(-60bp YoY) and employee costs (-60bp YoY).
Commissioning of Khandala plant resulted in higher depreciation costs which
went up 27% YoY. Other income, which grew 24.7% to INR267m, and lower tax
rate (lower by 110bp YoY to 30.2%) aided the 19.2% YoY adjusted PAT growth.
Reported PAT stood at INR2.89b, up 14.5%, impacted by one-off expenses
pertaining to shutdown of Bhandup plant of INR100m.
Net cash nearly doubled to INR11.8b v/s INR6.1b in FY13. FY14 sales, EBITDA and
PAT growth stood at 15.7%, 11.8% and 10.3%, respectively.
APNT has entered into a binding agreement to acquire the front-end sales
business, including brands, network and sales infrastructure of Ess Ess Bathroom
Product Private Ltd, subject to statutory approvals. Deal value is not disclosed.
Valuation and view:
Consistent double digit decorative paints volume growth in
subdued macro environment is a key positive. This was driven by superior
performance of Tier II and III towns, as per management. Acquisition of Ess Ess
indicates management’s intention to diversify the business into allied home décor
categories. At 35.9x FY15E EPS, valuations are expensive given historical
comparison, in our view. We maintain a
Neutral
with a revised target price of
INR520, valuing APNT at 28x FY16E. Spike in RM costs, currency depreciation
constitute key downside risks.
Gautam Duggad
(Gautam.Duggad@MotilalOswal.com); +91 22 3982 5404
Manish Poddar
(Manish.Poddar@MotilalOswal.com); +91 22 3027 8029
Investors are advised to refer through disclosures made at the end of the Research Report.

Asian Paints
Consolidated sales up 21.4%; domestic paints volume growth estimated at
~12-13%
Consol net sales grew 21.4% to INR 34.1b (est. INR 31.3b). We estimate
domestic decorative paints volume growth at ~12-13%. Net sales, though aided
by favorable came in 9% ahead of our expectations.
Despite weak discretionary consumption, volume growth came in above
estimates (est. 10%) which in turn was largely driven by good performance in
tier II and tier III towns as per management. Industrial paints continued to
remain lackluster owing to weak macros.
Gross margin declined 150bp YoY but expanded 80bp sequentially to 41.1%.
APNT has announced weighted average price hikes of 1% and 1.2% effective 1
st
May and 1
st
June respectively, to offset the pressure on gross margins. For FY14,
price hike stood at 6.1%.
EBITDA margins were down 30bp YoY and came in at 13.6%, primarily led by RM
inflation (+150bp YoY). Other expenses and employee costs were down 60bps
YoY each. As a result, EBITDA grew 18.9% to INR 4.4b.
Higher depreciation costs (+27% YoY) are owing to commissioning of Khandala
plant. Other income went up by 24.7% to INR267mn. Lower tax rate (down
110bp yoy to 30.2%) drove 19.2% YoY PAT growth to INR 2.9b (est. INR 2.9b).
Reported PAT was impacted by exceptional expenses of INR99.9 pertaining to
provision for impairment of certain fixed assets at its Bhandup Plant. It has
discontinued manufacturing at the plant and offered Voluntary
Retirement/Separation scheme to plant workers. Estimate liability of INR 280mn
on account of this scheme will be charged in 1Q15 P&L.
For FY14 consol. Sales, Ebitda and adj. PAT were up by 15.7%, 11.8% and 10.3%
respectively.
APNT has entered into a binding agreement to acquire the front end sales
business, including brands, network and sales infrastructure of Ess Ess Bathroom
Product private ltd., subject to statutory approvals.
Sales growth of 21.4% on low base
Sales (INR b)
29
24 24
22
16
19
6
18
11
Growth (%)
21
Gross margins down 150bp YoY but up 80bp sequentially
EBITDA Margin (%)
42.8 Source: MOSL, Company
42.7 42.7 40.3 41.1
40.1 40 39.4 40.1 41.5 39.9 40.3
17.3
12
17.3
14.3 15.5 14.8
13.8 16.3 15.3 15.7 15.6 14.6 13.6
Gross Margin (%)
5
12
Source: Company, MOSL
14 May 2014
2

Asian Paints
Stand-alone business: mirrors the consolidated performance
Standalone sales grew at 21.3% at INR 26.8b. Domestic decorative Paints
volume growth came in at 12-13% (in our view) driven by tier II and III towns.
Gross margin declined 200bps YoY to 41.5% but expanded 80bp sequentially.
EBITDA margins contracted 90bps YoY to 14.4% primarily led by gross margin
decline (+200bp YoY) partially offset by savings in staff cost (90 bp YoY) and
other expenditure (20 bp YoY)
Other income grew 29% YoY. Higher depreciation (up 34.2% to INR538m) and
tax rate savings (90bp YoY to 30.8%) resulted in 15.6% YoY PAT growth.
Quarterly Performance (Standalone)
Y/E March
Net Sales
Change (%)
Raw Material/PM
Gross Profit
Gross Margin (%)
Operating Expenses
% of Sales
EBITDA
Margin (%)
Change (%)
Interest
Depreciation
Other Income
PBT
Tax
Effective Tax Rate (%)
Adjusted PAT
Change (%)
1Q
19,222
28.9
11,496
7,726
40.2
4,158
21.6
3,568
18.6
18.7
43
241
312
3,595
1,091
30.3
2,504
24.6
FY12
2Q
3Q
18,369 21,031
25.5
19.9
10,912 12,533
7,457
8,498
40.6
40.4
4,701
4,938
25.6
23.5
2,756
3,561
15.0
16.9
-2.1
18.1
66
62
250
249
560
319
3,000
3,569
871
1,064
29.0
29.8
2,129
2,505
8.5
21.2
4Q
20,673
29.0
12,340
8,332
40.3
5,044
24.4
3,288
15.9
32.5
137
255
572
3,468
1,022
29.5
2,446
42.7
1Q
20,440
6.3
11,621
8,819
43.1
4,871
23.8
3,947
19.3
10.6
78
274
352
3,948
1,202
30.4
2,746
9.7
FY13
2Q
3Q
21,309 25,206
16.0
19.9
12,688 14,824
8,621 10,382
40.5
41.2
5,366
5,999
25.2
23.8
3,255
4,383
15.3
17.4
18.1
23.1
100
60
294
301
349
470
3,210
4,493
972
1,373
30.3
30.6
2,238
3,120
5.1
24.6
4Q
22,144
7.1
12,501
9,644
43.5
6,258
28.3
3,386
15.3
3.0
69
401
591
3,508
1,112
31.7
2,396
-2.1
1Q
23,008
12.6
12,948
10,060
43.7
6,056
26.3
4,003
17.4
1.4
48
530
710
4,136
1,297
31.3
2,839
3.4
FY14
2Q
3Q
25,049 28,077
17.6
11.4
14,077 16,661
10,972 11,415
43.8
40.7
6,680
6,992
26.7
24.9
4,293
4,424
17.1
15.8
31.9
0.9
62
64
515
540
750
701
4,466
4,521
1,360
1,446
30.4
32.0
3,106
3,075
38.8
-1.5
4Q
26,866
21.3
15,713
11,153
41.5
7,288
27.1
3,865
14.4
14.1
88
538
765
4,004
1,233
30.8
2,770
15.6
Source: Company, MOSL
.
Price hikes announced to offset gross margin pressures
Price Increase/Decrease(%)
4.15
2.6
1.2
2.9
1.0
4.36
2.45
1.33
0.4
3.2
2.2
1.2
2.0
1.15 1.0
1.8 2.1
1.0 1.2
25.5
19.9
15.6
6.3
7.1
12.6
Standalone sales up 21.3% YoY
Sales (INR b)
28.6
19.9
17.6
11.4
21.3
Growth (%)
-0.25
Source: Company, MOSL
14 May 2014
3

Asian Paints
Decorative volumes grew 12%-13%, in our view
Decorative Paints Volume gr (%)
27
16 15 15
0
18
12
5
-2
13
3
10 12
12
7
Gross and operating margins declined 200bps and 90bps
Gross Margin (%)
EBITDA Margin (%)
43.1 40.5 41.2 43.5 43.7 43.8 40.7 41.5
40.8 40.4 40.3
19.3
15.3 16.9 15.9
15.3 17.4 15.3 17.4 17.1 15.8 14.4
Source: Company, MOSL
Imputed subsidiary performance: robust margin improvement
Subsidiary sales grew 21.7% while gross margins expanded 120bp and operating
margins expanded 300bps to 10.4%.
Currency depreciation led gains in international business has aided the
subsidiary performance, in our view.
Subsidiary PAT jumped 76.2% YoY to INR204m.
Valuation and view
Consistent double digit decorative paints volume growth in subdued macro
environment is a key positive.
This was driven by superior performance of tier II and III towns, as per
management.
Acquisition of Ess Ess indicates management’s intention to diversify the business
into allied home décor categories.
At 35.9x FY15E EPS and 29.8x FY16E EPS, valuations are expensive given
historical comps. We maintain
Neutral
with a revised TP of INR520, valuing at
28x FY16E. Spike in RM costs, currency depreciation constitute key downside
risks.
14 May 2014
4

Asian Paints
Story in charts
Revenues went up 15.7% in FY14
Sales (INR in mn)
21.5 20.1
24.0
22.3
15.6
24.7
17.7
15.7 16.4
10.0
9.6
5.0
6.1
Sales gr (%)
Weighted average price increase of 6.1% in FY14
Price gr (%)
11.9
12.9
FY07 FY08 FY09 FY10 FY11 FY12 FY13 FY14 FY15E FY16E
Source: Company, MOSL
FY10
FY11
FY12
FY13
FY14
Source: Company, MOSL
Gross margin improved 70bp YoY in FY14
Gross margin (%)
43.8
41.5
40.1
38.3
42.1
40.0
41.7 41.6 41.5
41.0
EBITDA margins declined for 4 successive years
EBITDA margin (%)
18.4
13.0
15.0
12.3
17.2
15.7 15.3 14.8 15.3 15.5
FY07 FY08 FY09 FY10 FY11 FY12 FY13 FY14 FY15E FY16E
Source: Company, MOSL
FY07 FY08 FY09 FY10 FY11 FY12 FY13 FY14 FY15E FY16E
Source: Company, MOSL
Expect PAT CAGR of 20.7% in FY14-FY16E
PAT
PAT gr (%)
Stable return ratios
RoE
48.8
42.5
36.8
20.3
38.5
33.4
36.0
33.3
31.5 32.4 32.9
29.5
45.7
107.9
-3.9
1.0
17.3
12.7 10.3
21.1
FY07 FY08 FY09 FY10 FY11 FY12 FY13 FY14 FY15E FY16E
Source: Company, MOSL
FY07 FY08 FY09 FY10 FY11 FY12 FY13 FY14 FY15E FY16E
Source: Company, MOSL
14 May 2014
5

Asian Paints
Asian Paints: an investment profile
Company description
Asian Paints is India's largest
paint manufacturer and
marketer, with a dominant share in the decorative
segment. For the industrials and automotive segment, it
has a JV with PPG of the US. Asian Paints acquired
Berger International of Singapore to expand its
operations in other markets in Asia, the Middle East and
the Caribbean.
Recent developments
Key investment arguments
Expansion in housing and construction will drive
demand for decorative paints over the next 3-5
years. APNT with ~55% market share is at the
forefront to capitalize the emerging opportunity.
Benign oligopoly in the sector ensures sufficient
pricing power.
APNT has entered into a binding agreement to
acquire the front end sales business, including
brands, network and sales infrastructure of Ess Ess
Bathroom Product private ltd. subject to statutory
approvals.
APNT (International) acquired additional 46.7%
stake in BIL during 4Q14. As on 31st March, Asian
Paints (International) Ltd held 96.8% stake in BIL.
Announced 1.0% and 1.2% price hike w.e.f. 1
st
May
and 1
st
June respectively.
Valuation and view
The stock trades at rich valuations of 35.9x FY15E
and 29.8x FY16E EPS, we maintain
Neutral
with a
TP of INR520 (28x FY16E EPS).
Key investment risks
Sector view
Rising competitive intensity and volatility in RM
prices.
We are positive on the long term demand
potential in the sector. Near term concerns
notwithstanding, Asian Paints has displayed strong
resilience in volume growth.
Longer term prospects bright, given rising incomes
and low penetration.
Comparative valuations
P/E (x)
P/BV (x)
EV/Sales (x)
EV/EBITDA (x)
FY15E
FY16E
FY15E
FY16E
FY15E
FY16E
FY15E
FY16E
APNT
35.9
29.8
11.6
9.8
3.6
3.1
23.6
19.8
ITC
26.6
23.1
17.6
15.3
6.6
5.7
10.8
9.9
HUVR
32.3
28.5
23.1
19.9
3.8
3.3
18.5
15.9
EPS: MOSL forecast v/s consensus (INR)
MOSL
Forecast
FY15
FY16
15.5
18.7
Consensus
Forecast
15.4
18.5
Variation
(%)
0.6
1.1
Target price and recommendation
Current
Price (INR)
557
Target
Price (INR)
520
Upside
(%)
-6.6
Reco.
Neutral
Shareholding pattern (%)
Promoter
Domestic Inst
Foreign
Others
Mar-14
52.8
9.4
19.4
18.5
Dec-13
52.8
7.9
20.9
18.4
Mar-13
52.8
7.9
20.9
18.4
Stock performance (1-year)
14 May 2014
6

Asian Paints
Financials and valuations
Income statement
Y/E March
Net Sales
Change (%)
EBITDA
EBITDA Margin (%)
Depreciation
EBIT
Interest
Other Income
PBT
Tax
Tax Rate (%)
Reported PAT
Adjusted PAT
Change (%)
Min. Int. & Assoc. Share
Adj Cons PAT
2013
108.7
12.9
16.7
15.3
1.5
15.1
0.4
1.8
16.6
5.0
30.0
11.6
11.1
12.7
-0.5
10.7
2014
125.8
15.7
18.6
14.8
2.5
16.2
0.4
2.7
18.4
5.7
31.0
12.7
12.3
10.3
-0.4
11.8
(INR Billion)
2015E
146.5
16.4
22.3
15.3
2.8
19.6
0.5
3.1
22.2
6.9
31.0
15.3
14.9
21.1
-0.4
14.5
2016E
172.3
17.7
26.6
15.5
3.0
23.6
0.6
3.6
26.7
8.3
31.0
18.4
17.9
20.3
-0.5
17.4
Ratios
Y/E March
Basic (INR)
EPS
Cash EPS
Book Value
Valuation(x)
P/E
Cash P/E
Price / Book Value
EV/Sales
EV/EBITDA
Profitability Ratios (%)
RoE
RoCE
Turnover Ratios (%)
Asset Turnover (x)
Debtors (No. of Days)
Inventory (No. of Days)
Creditors (No. of Days)
2013
11.6
12.7
34.9
48.0
43.7
16.0
4.9
31.7
38.0
43.5
3.1
30.7
56.3
50.1
2014
12.8
14.9
40.6
43.5
37.3
13.7
4.2
28.4
35.1
39.1
3.0
29.7
54.4
47.6
2015E
15.5
18.0
48.0
35.9
31.0
11.6
3.6
23.6
36.0
40.2
3.0
30.0
56.0
48.2
2016E
18.7
21.3
56.7
29.8
26.2
9.8
3.1
19.8
36.7
41.2
3.0
30.0
56.0
47.0
Balance sheet
Y/E March
Share Capital
Reserves
Net Worth
Debt
Deferred Tax
Total Capital Employed
Gross Fixed Assets
Less: Acc Depreciation
Net Fixed Assets
Capital WIP
Investments
Current Assets
Inventory
Debtors
Cash & Bank
Loans & Adv, Others
Curr Liabs & Provns
Curr. Liabilities
Provisions
Net Current Assets
Total Assets
2013
1.0
32.5
33.5
0.7
2.2
38.2
33.3
10.0
23.3
5.1
1.9
38.2
16.8
9.1
5.6
6.8
30.3
22.2
8.1
8.0
38.2
2014
1.0
38.0
39.0
0.8
2.6
44.7
38.9
12.5
26.4
4.1
2.4
46.3
18.8
10.2
6.2
11.1
34.5
24.8
9.7
11.8
44.7
(INR Billion)
2015E
2016E
1.0
1.0
45.0
53.4
46.0
54.4
0.9
0.9
3.1
3.7
52.7
62.1
40.6
45.1
15.3
18.3
25.3
26.8
6.4
6.4
5.2
11.5
55.9
63.9
22.5
26.4
12.0
14.2
7.3
8.6
14.1
14.7
40.2
46.6
28.8
32.8
11.4
13.8
15.8
17.4
52.7
62.1
E: MOSL Estimates
Cash flow statement
Y/E March
OP/(Loss) before Tax
Interest
Direct Taxes Paid
(Inc)/Dec in Wkg Cap
CF from Op. Activity
(Inc)/Dec in FA & CWIP
(Pur)/Sale of Invt
CF from Inv. Activity
Inc / (Dec) in Debt
Divd Paid (incl Tax)
CF from Fin. Activity
Inc/(Dec) in Cash
Add: Opening Balance
Closing Balance
2013
16.7
1.4
-4.6
-0.1
13.4
-10.8
1.7
-9.1
0.1
-5.6
-4.9
-0.7
6.2
5.6
2014
18.6
2.3
-5.3
-3.1
12.4
-4.5
-0.6
-5.1
0.1
-6.7
-6.7
0.7
5.6
6.2
(INR Billion)
2015E
22.3
2.6
-6.4
-2.9
15.6
-4.0
-2.8
-6.8
0.1
-7.9
-7.7
1.1
6.2
7.3
2016E
26.6
3.0
-7.7
-0.3
21.6
-4.5
-6.3
-10.8
0.0
-9.5
-9.5
1.3
7.3
8.6
14 May 2014
7

Disclosures
This report is for personal information of the authorized recipient and does not construe to be any investment, legal or taxation advice to you. This research report does not constitute an offer, invitation or
inducement to invest in securities or other investments and Motilal Oswal Securities Limited (hereinafter referred as MOSt) is not soliciting any action based upon it. This report is not for public distribution
and has been furnished to you solely for your information and should not be reproduced or redistributed to any other person in any form.
Unauthorized disclosure, use, dissemination or copying (either whole or partial) of this information, is prohibited. The person accessing this information specifically agrees to exempt MOSt or any of its
affiliates or employees from, any and all responsibility/liability arising from such misuse and agrees not to hold MOSt or any of its affiliates or employees responsible for any such misuse and further agrees
to hold MOSt or any of its affiliates or employees free and harmless from all losses, costs, damages, expenses that may be suffered by the person accessing this information due to any errors and delays.
The information contained herein is based on publicly available data or other sources believed to be reliable. While we would endeavour to update the information herein on reasonable basis, MOSt and/or
its affiliates are under no obligation to update the information. Also there may be regulatory, compliance, or other reasons that may prevent MOSt and/or its affiliates from doing so. MOSt or any of its
affiliates or employees shall not be in any way responsible and liable for any loss or damage that may arise to any person from any inadvertent error in the information contained in this report. MOSt or any
of its affiliates or employees do not provide, at any time, any express or implied warranty of any kind, regarding any matter pertaining to this report, including without limitation the implied warranties of
merchantability, fitness for a particular purpose, and non-infringement. The recipients of this report should rely on their own investigations.
Asian Paints
This report is intended for distribution to institutional investors. Recipients who are not institutional investors should seek advice of their independent financial advisor prior to taking any investment decision
based on this report or for any necessary explanation of its contents.
MOSt and/or its affiliates and/or employees may have interests/positions, financial or otherwise in the securities mentioned in this report. To enhance transparency, MOSt has incorporated a Disclosure of
Interest Statement in this document. This should, however, not be treated as endorsement of the views expressed in the report.
Disclosure of Interest Statement
1. Analyst ownership of the stock
2. Group/Directors ownership of the stock
3. Broking relationship with company covered
4. Investment Banking relationship with company covered
ASIAN PAINTS LTD
No
No
No
No
Analyst Certification
The views expressed in this research report accurately reflect the personal views of the analyst(s) about the subject securities or issues, and no part of the compensation of the research analyst(s) was, is,
or will be directly or indirectly related to the specific recommendations and views expressed by research analyst(s) in this report. The research analysts, strategists, or research associates principally
responsible for preparation of MOSt research receive compensation based upon various factors, including quality of research, investor client feedback, stock picking, competitive factors and firm revenues.
This report is not directed or intended for distribution to or use by any person or entity resident in a state, country or any jurisdiction, where such distribution, publication, availability or use would be contrary
to law, regulation or which would subject MOSt & its group companies to registration or licensing requirements within such jurisdictions.
Regional Disclosures (outside India)
This report is intended for distribution only to persons having professional experience in matters relating to investments as described in Article 19 of the Financial Services and Markets Act 2000 (Financial
Promotion) Order 2005 (referred to as "investment professionals"). This document must not be acted on or relied on by persons who are not investment professionals. Any investment or investment activity
to which this document relates is only available to investment professionals and will be engaged in only with such persons.
For U.K.
Motilal Oswal Securities Limited (MOSL) is not a registered broker - dealer under the U.S. Securities Exchange Act of 1934, as amended (the"1934 act") and under applicable state laws in the United
States. In addition MOSL is not a registered investment adviser under the U.S. Investment Advisers Act of 1940, as amended (the "Advisers Act" and together with the 1934 Act, the "Acts), and under
applicable state laws in the United States. Accordingly, in the absence of specific exemption under the Acts, any brokerage and investment services provided by MOSL, including the products and services
described herein are not available to or intended for U.S. persons.
This report is intended for distribution only to "Major Institutional Investors" as defined by Rule 15a-6(b)(4) of the Exchange Act and interpretations thereof by SEC (henceforth referred to as "major
institutional investors"). This document must not be acted on or relied on by persons who are not major institutional investors. Any investment or investment activity to which this document relates is only
available to major institutional investors and will be engaged in only with major institutional investors. In reliance on the exemption from registration provided by Rule 15a-6 of the U.S. Securities Exchange
Act of 1934, as amended (the "Exchange Act") and interpretations thereof by the U.S. Securities and Exchange Commission ("SEC") in order to conduct business with Institutional Investors based in the
U.S., MOSL has entered into a chaperoning agreement with a U.S. registered broker-dealer, Motilal Oswal Securities International Private Limited. ("MOSIPL"). Any business interaction pursuant to this
report will have to be executed within the provisions of this chaperoning agreement.
The Research Analysts contributing to the report may not be registered /qualified as research analyst with FINRA. Such research analyst may not be associated persons of the U.S. registered broker-
dealer, MOSIPL, and therefore, may not be subject to NASD rule 2711 and NYSE Rule 472 restrictions on communication with a subject company, public appearances and trading securities held by a
research analyst account.
For U.S.
Motilal Oswal Capital Markets Singapore Pte Limited is acting as an exempt financial advisor under section 23(1)(f) of the Financial Advisers Act(FAA) read with regulation 17(1)(d) of the Financial
Advisors Regulations and is a subsidiary of Motilal Oswal Securities Limited in India. This research is distributed in Singapore by Motilal Oswal Capital Markets Singapore Pte Limited and it is only directed
in Singapore to accredited investors, as defined in the Financial Advisers Regulations and the Securities and Futures Act (Chapter 289), as amended from time to time.
In respect of any matter arising from or in connection with the research you could contact the following representatives of Motilal Oswal Capital Markets Singapore Pte Limited:
Anosh Koppikar
Kadambari Balachandran
Email:anosh.Koppikar@motilaloswal.com
Email : kadambari.balachandran@motilaloswal.com
Contact(+65)68189232
Contact: (+65) 68189233 / 65249115
Office Address:21 (Suite 31),16 Collyer Quay,Singapore 04931
For Singapore
Motilal Oswal Securities Ltd
14 May 2014
Motilal Oswal Tower, Level 9, Sayani Road, Prabhadevi, Mumbai 400 025
Phone: +91 22 3982 5500 E-mail: reports@motilaloswal.com
8