22 May 2014
4QFY14 Results Update | Sector:
Automobiles
Ashok Leyland
BSE SENSEX
24,374
Bloomberg
Equity Shares (m)
M.Cap. (INR b) / (USD b)
52-Week Range (INR)
1, 6, 12 Rel. Per (%)
S&P CNX
7,276
AL IN
2,660.7
76.9/1.3
30/12
15/67/4
Financials & Valuation (INR Billion)
Y/E Mar
Net Sales
EBITDA
Adj PAT
EPS (INR)
Gr. (%)
BV/Sh.(INR)
RoE (%)
RoCE (%)
P/E (x)
P/BV (x)
2014 2015E 2016E
99.4 116.5 147.3
1.7
-4.8
-1.8
NA
16.7
-10.7
-1.6
1.7
6.5
-0.5
-0.2
NA
16.3
-1.1
3.9
1.8
10.4
2.5
1.0
NA
16.7
5.8
8.2
30.3
1.7
CMP: INR29
TP: INR34
Buy
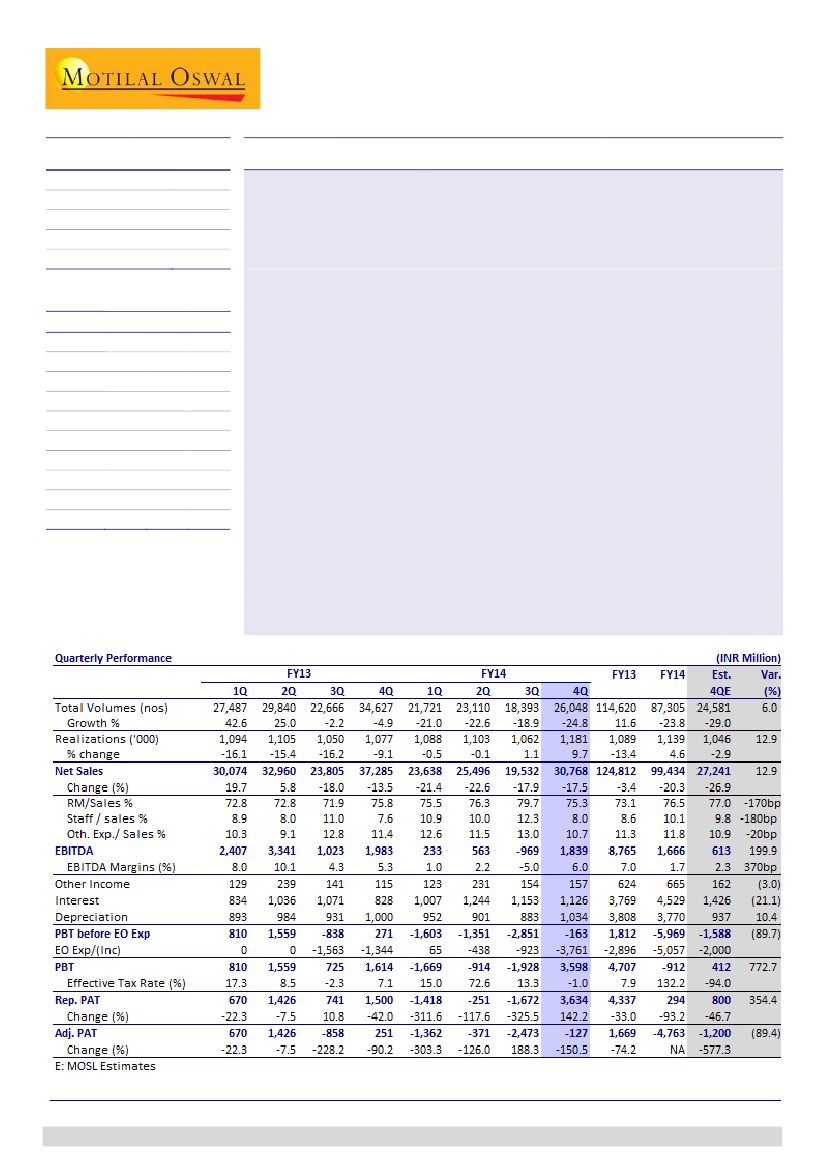
Margins rebound strongly, guides market revival 2Q onwards
Ashok Leyland’s (AL’s) net sales declined 17.5% YoY to INR30.8b (est. INR27.2b),
led by volume decline of 24.8%, while realizations rose 9.7% YoY (up 11.2% QoQ).
EBITDA margin improved from -5% in 3QFY14 to 6% in 4QFY14 (est. 2.3%). Loss
before extraordinary item and tax stood at INR163m (est. INR1.6b).
AL booked a profit of INR3.8b on sale of non-core long term investments/assets.
Considering the weak financial performance, company refrained from declaring
dividend for FY14 (first time in 15 years, INR0.6/share in FY13).
AL, for the first time, reported consolidated financial performance. Consolidated
net sales stood at INR115b, with EBITDA margin of 3.7%. Loss before extraordinary
item and tax stood at INR8.2b (v/s INR6b for standalone).
Management commentary on results
Management believes the worst is over. Recovery is likely 2QFY15 onwards.
AL largely retained its MHCVs share in FY14, despite higher competition.
Company aggressively worked on cost reduction measures and working capital
reduction.
Continue to focus on various restructuring initiatives to improve operational
efficiency and leaner balance sheet.
Valuation and view:
Our industry interactions indicate that MHCVs cycle is
bottoming out. Typically, MHCVs demand rebounds sharply with an economic
recovery. AL is best placed among CV OEMs to play the CV upcycle. We will review our
estimates post the con-call scheduled tomorrow at 11am (# 91 22 3915 5460).
Maintain
Buy.
-16.1 -158.2
Jinesh Gandhi
(Jinesh@MotilalOswal.com); +91 22 3982 5416
Chirag Jain
(Chirag.Jain@MotilalOswal.com); +91 22 3982 5418
Investors are advised to refer through disclosures made at the end of the Research Report.

Ashok Leyland
Strong turnaround in operational performance with margins of 6%
AL’s volume declined 24.8% (up 41.6% QoQ), reflecting weak macro-economic
environment. MHCV volumes have dropped by 20% YoY (on 23% drop last year),
while LCV volumes were down by 35% YoY.
Average realizations improved by 9.7% YoY (up 11.2% QoQ) to INR1.18m/unit
(est INR1.05m/unit) driven by mix change in favour of MHCVs.
As a result, net sales declined by 17.5% YoY (up 57.5% QoQ) to INR30.8b (est
INR27.2b)
RM cost declined by 440bp sequentially (50bp YoY) to 75.3%, driven by product
mix change.
Staff cost and other expenditure declined sequentially by 420bp and 230bp
reflecting operating leverage and cost reduction benefits
EBTIDA margins improved from
negative
5% in 3QFY14 to 6% (est 2.3%). Lower
LCV volumes (under Nissan JV), sharp sequential growth coupled with cost
reduction measures would have helped to report strong rebound in margins.
PBT loss (before extraordinary) stood at INR163m (est INR1.6b).
AL booked profit of INR3.8b on sale of non-core long term investments/assets.
Considering weak financial performance, AL has not paid dividend for FY14
(FY13 dividend stood at INR0.6/share).
Drop in MHCV volumes moderating (%)
13.3
4.6
5.0
AL’s MHCV volumes rises QoQ on seasonality (‘000 unit)
-8.8
-3.2
(10.5)
(20.2)
(23.3)
(24.9)
(26.4)
(27.1)
(29.0)
Source: Company, MOSL
Product mix change in favour of MHCVs drives realizations
Realization (INR '000/unit)
Share of LCVs (under Nissan JV) declines sharply QoQ (%)
Volumes (ex Dost)
Dost
58
100 99
89
86
74
71
65
68
69
69
72
-
1
11
14
26
29
35
32
31
31
42
28
1Q
2Q
3Q
4Q
1Q
2Q
3Q
4Q
1Q
2Q
3Q
4Q
FY12
FY13
FY14
Source: Company, MOSL
22 May 2014
2

Ashok Leyland
Strong rebound in margins on higher volumes, mix change
EBITDA (INR m)
9.7 10.6
7.2
10.9
8.0
10.1
4.3 5.3
6.0
1.0
2.2
-5.0
EBITDA Margins (%)
RM cost declines on product mix change
RM (% of net sales)
73.6 74.0 74.4 72.8 72.8
72.1
71.9
75.8 75.5 76.3
75.3
79.7
1Q
2Q
3Q
4Q
1Q
2Q
3Q
4Q
1Q
2Q
3Q
4Q
1Q
2Q
3Q
4Q
1Q
2Q
3Q
4Q
1Q
2Q
3Q
4Q
FY12
FY13
FY14
FY12
FY13
FY14
Source: Company, MOSL
Maintained MHCV market share in FY14, despite competition
Management believes that worst is over. With stable government, management
expects MHCV cycle to revive, starting likely 2QFY15 itself.
Aggressive network expansion over last few years helped AL to retain MHCV
market share in FY14, despite higher competition.
AL has worked aggressively on reducing the break-even level through cost
reduction measures, while continuing to invest in new products.
During FY14, AL booked a profit of INR5b on sale of few investments and non-
core assets and reduced working capital drastically to generate cash.
Continue to focus on various re-structuring initiative to improve operational
efficiency and leaner balance sheet.
AL largely maintains its market share despite competition
Dom. MHCV market share (%)
22.5
27.9
23.3
25.7
23.6
26.1
25.5
4QFY14 registers increase in MHCV market share QoQ
Dom. MHCV market share (%)
26.2
25.4
29.8
22.5
23.1
27.8
1Q
2Q
FY13
3Q
4Q
1Q
2Q
FY14
3Q
4Q
FY10
FY11
FY12
FY13
FY14
Source: Company, SIAM, MOSL
Valuation and view
Our industry interaction indicates that MHCV cycle is bottoming-out.
Typically, MHCV demand rebounds sharply with economic recovery. During the
last two major cycles, MHCV demand posted a CAGR of 23%.
Ashok Leyland (AL) is best placed among CV OEMs to play the CV upcycle.
At our current estimates, AL trades at 30.3x FY16E EPS of INR1, 1.9x FY16E P/B
and 11.3x FY16E EV/EBITDA, assuming FY16 being year of recovery.
We will review our estimates post the con-call scheduled tomorrow at 11am
(# 91 22 3915 5460). Maintain
Buy.
22 May 2014
3

Ashok Leyland
Ashok Leyland| Story in Charts: Best play on CV cycle recovery
Past cycle suggest ~23% volume CAGR from bottom to top of the cycle
M&HCV Volumes ('000 units)
400
300
200
100
0
Volumes went 3.5x
or ~23% CAGR
IIP Growth (%) - RHS
Volumes decline Volumes to grow
~4% CAGR
~20% CAGR
20
15
10
5
0
Source: Company, MOSL
Expect AL’s MHCVs to rebound strongly over FY14-16E
Dom. Ind. MHCV ('000 units)
15.0
7.5
Growth (%)
20.0
Higher volumes, discount reduction to drive margins
EBITDA (INR m)
10.2
7.0
5.6
7.1
EBITDA Margins (%)
(22.7)
FY12
FY13
(25.5)
FY14
FY15E
FY16E
FY12
FY13
FY14
0.5
FY15E
FY16E
Source: Company, MOSL
Capex/investments to moderate significantly (INR m)
Capex
Depreciation
Focused on reducing debt levels (INR m)
54,000
2,530
1,578
38,642
10,000
1,250
Source: Company, MOSL
22 May 2014
4

Ashok Leyland
Ashok Leyland: an investment profile
Company description
Ashok Leyland (AL), the flagship company of Hinduja
Group, is the 2nd largest MHCV with ~26% market share
and the largest Bus manufacturer in India. To expand its
product offerings, AL has entered into 50:50 JV with
Nissan for LCVs and John Deere for construction
equipment.
Recent developments
Management indicated that worst is over with
recovery in volumes likely 2QFY15 onwards
Considering weak financial performance, AL has
refrained from declaring dividend for FY14 (first
time in 15 years, INR0.6/share in FY13).
At our current estimates, AL trades at 30.3x FY16E
EPS of INR1, 1.9x FY16E P/B and 11.3x FY16E
EV/EBITDA, assuming FY16 being year of recovery.
Maintain Buy with a target price of INR34 (2.2x
FY16E P/B).
We believe MHCV cycle is bottoming-out and could
rebound sharply. Typically, MHCV demand
rebounds sharply with economic recovery. During
the last two major cycles, MHCV demand posted a
CAGR of 23%.
Over the longer term, we expect MHCV industry to
grow at a healthy rate of 1.2-1.5x of IIP growth.
While several new entrants have entered the
Industry, the industry is expected to remain largely
duopolistic in nature over the near to medium term.
Valuation and view
Key investment arguments
Our interactions with industry participants indicate
that the worst seems to be over.
Typically, MHCV demand rebounds sharply with
economic recovery. During the last two major
cycles, MHCV demand posted a CAGR of 23%.
AL, best placed to play the CV up-cycle
Levers for stock's performance include sharp
volume-led EBITDA growth, significant FCF
generation through measured capex and
investments, balance sheet de-leveraging and
monetization of non-core assets.
Delay in recovery in the MHCV demand would
continue to impact performance.
Intensifying competition, particularly from Daimler
and Volvo-Eicher could materially alter the duopoly
industry structure.
AL
-158.2
30.3
NA
NA
-1.1
5.8
18.0
11.1
EIM
32.3
21.5
54.9
50.7
26.8
32.0
21.9
14.0
TTMT
9.1
6.5
-7.3
60.5
26.1
27.8
3.8
2.7
Sector view
Key investments risks
Comparative valuations
P/E (x)
EPS Gr (%)
RoE (%)
EV/EBITDA (x)
FY15E
FY16E
FY15E
FY16E
FY15E
FY16E
FY15E
FY16E
EPS: MOSL forecast v/s consensus (INR)
MOSL
Forecast
-0.2
1.0
Consensus
Forecast
0.0
1.4
Variation
(%)
316.7
-27.6
FY15
FY16
Target price and recommendation
Current
Price (INR)
29
Target
Price (INR)
34
Upside
(%)
17.2
Reco
Buy
Shareholding pattern (%)
Mar-14
Promoter
Domestic Inst
Foreign
Others
41.6
13.2
26.6
18.6
Dec-13
41.0
12.2
27.8
19.0
Mar-13
38.7
13.1
31.4
16.9
Stock performance (1-year)
22 May 2014
5

Ashok Leyland
Financials and valuation (Standalone)
22 May 2014
6

Ashok Leyland
NOTES
22 May 2014
7

This report is for personal information of the authorized recipient and does not construe to be any investment, legal or taxation advice to you. This research report does not constitute an offer, invitation or
inducement to invest in securities or other investments and Motilal Oswal Securities Limited (hereinafter referred as MOSt) is not soliciting any action based upon it. This report is not for public distribution
and has been furnished to you solely for your information and should not be reproduced or redistributed to any other person in any form.
Unauthorized disclosure, use, dissemination or copying (either whole or partial) of this information, is prohibited. The person accessing this information specifically agrees to exempt MOSt or any of its
affiliates or employees from, any and all responsibility/liability arising from such misuse and agrees not to hold MOSt or any of its affiliates or employees responsible for any such misuse and further agrees
to hold MOSt or any of its affiliates or employees free and harmless from all losses, costs, damages, expenses that may be suffered by the person accessing this information due to any errors and delays.
The information contained herein is based on publicly available data or other sources believed to be reliable. While we would endeavour to update the information herein on reasonable basis, MOSt and/or
its affiliates are under no obligation to update the information. Also there may be regulatory, compliance, or other reasons that may prevent MOSt and/or its affiliates from doing so. MOSt or any of its
affiliates or employees shall not be in any way responsible and liable for any loss or damage that may arise to any person from any inadvertent error in the information contained in this report. MOSt or any
of its affiliates or employees do not provide, at any time, any express or implied warranty of any kind, regarding any matter pertaining to this report, including without limitation the implied warranties of
merchantability, fitness for a particular purpose, and non-infringement. The recipients of this report should rely on their own investigations.
This report is intended for distribution to institutional investors. Recipients who are not institutional investors should seek advice of their independent financial advisor prior to taking any investment decision
based on this report or for any necessary explanation of its contents.
MOSt and/or its affiliates and/or employees may have interests/positions, financial or otherwise in the securities mentioned in this report. To enhance transparency, MOSt has incorporated a Disclosure of
Interest Statement in this document. This should, however, not be treated as endorsement of the views expressed in the report.
Disclosure of Interest Statement
1. Analyst ownership of the stock
2. Group/Directors ownership of the stock
3. Broking relationship with company covered
4. Investment Banking relationship with company covered
ASHOK LEYLAND LTD
No
No
No
No
Disclosures
Ashok Leyland
The views expressed in this research report accurately reflect the personal views of the analyst(s) about the subject securities or issues, and no part of the compensation of the research analyst(s) was, is,
or will be directly or indirectly related to the specific recommendations and views expressed by research analyst(s) in this report. The research analysts, strategists, or research associates principally
responsible for preparation of MOSt research receive compensation based upon various factors, including quality of research, investor client feedback, stock picking, competitive factors and firm revenues.
Analyst Certification
This report is not directed or intended for distribution to or use by any person or entity resident in a state, country or any jurisdiction, where such distribution, publication, availability or use would be contrary
to law, regulation or which would subject MOSt & its group companies to registration or licensing requirements within such jurisdictions.
Regional Disclosures (outside India)
This report is intended for distribution only to persons having professional experience in matters relating to investments as described in Article 19 of the Financial Services and Markets Act 2000 (Financial
Promotion) Order 2005 (referred to as "investment professionals"). This document must not be acted on or relied on by persons who are not investment professionals. Any investment or investment activity
to which this document relates is only available to investment professionals and will be engaged in only with such persons.
For U.K.
Motilal Oswal Securities Limited (MOSL) is not a registered broker - dealer under the U.S. Securities Exchange Act of 1934, as amended (the"1934 act") and under applicable state laws in the United
States. In addition MOSL is not a registered investment adviser under the U.S. Investment Advisers Act of 1940, as amended (the "Advisers Act" and together with the 1934 Act, the "Acts), and under
applicable state laws in the United States. Accordingly, in the absence of specific exemption under the Acts, any brokerage and investment services provided by MOSL, including the products and services
described herein are not available to or intended for U.S. persons.
This report is intended for distribution only to "Major Institutional Investors" as defined by Rule 15a-6(b)(4) of the Exchange Act and interpretations thereof by SEC (henceforth referred to as "major
institutional investors"). This document must not be acted on or relied on by persons who are not major institutional investors. Any investment or investment activity to which this document relates is only
available to major institutional investors and will be engaged in only with major institutional investors. In reliance on the exemption from registration provided by Rule 15a-6 of the U.S. Securities Exchange
Act of 1934, as amended (the "Exchange Act") and interpretations thereof by the U.S. Securities and Exchange Commission ("SEC") in order to conduct business with Institutional Investors based in the
U.S., MOSL has entered into a chaperoning agreement with a U.S. registered broker-dealer, Motilal Oswal Securities International Private Limited. ("MOSIPL"). Any business interaction pursuant to this
report will have to be executed within the provisions of this chaperoning agreement.
The Research Analysts contributing to the report may not be registered /qualified as research analyst with FINRA. Such research analyst may not be associated persons of the U.S. registered broker-
dealer, MOSIPL, and therefore, may not be subject to NASD rule 2711 and NYSE Rule 472 restrictions on communication with a subject company, public appearances and trading securities held by a
research analyst account.
For U.S.
Motilal Oswal Capital Markets Singapore Pte Limited is acting as an exempt financial advisor under section 23(1)(f) of the Financial Advisers Act(FAA) read with regulation 17(1)(d) of the Financial
Advisors Regulations and is a subsidiary of Motilal Oswal Securities Limited in India. This research is distributed in Singapore by Motilal Oswal Capital Markets Singapore Pte Limited and it is only directed
in Singapore to accredited investors, as defined in the Financial Advisers Regulations and the Securities and Futures Act (Chapter 289), as amended from time to time.
In respect of any matter arising from or in connection with the research you could contact the following representatives of Motilal Oswal Capital Markets Singapore Pte Limited:
Anosh Koppikar
Kadambari Balachandran
Email:anosh.Koppikar@motilaloswal.com
Email : kadambari.balachandran@motilaloswal.com
Contact(+65)68189232
Contact: (+65) 68189233 / 65249115
Office Address:21 (Suite 31),16 Collyer Quay,Singapore 04931
For Singapore
Motilal Oswal Securities Ltd
22 May 2014
Motilal Oswal Tower, Level 9, Sayani Road, Prabhadevi, Mumbai 400 025
Phone: +91 22 3982 5500 E-mail: reports@motilaloswal.com
8