23 May 2014
4QFY14 Results Update | Sector:
Consumer
ITC
BSE SENSEX
24,693
Bloomberg
Equity Shares (m)
52-Week Range (INR)
1, 6, 12 Rel. Per (%)
S&P CNX
7,367
ITC IN
7,953.2
387/285
-11/-11/-23
CMP: INR342
TP: INR400
Buy
M.Cap.(INR b)/(USD b) 2,721.2/46.6
Financials & Valuations (INR b)
Y/E MAR
Net Sales
EBITDA
Adj PAT
AdjEPS(INR)
Gr. (%)
BV/Sh (INR)
RoE (%)
RoCE (%)
P/E (x)
P/BV (x)
2014 2015E 2016E
328.8
123.0
86.5
11.1
16.6
28.9
38.8
53.4
30.9
11.8
377.1
141.3
100.7
12.9
16.4
31.7
40.6
57.0
26.6
10.8
432.5
161.4
115.8
14.8
15.0
34.4
43.0
60.7
23.1
9.9
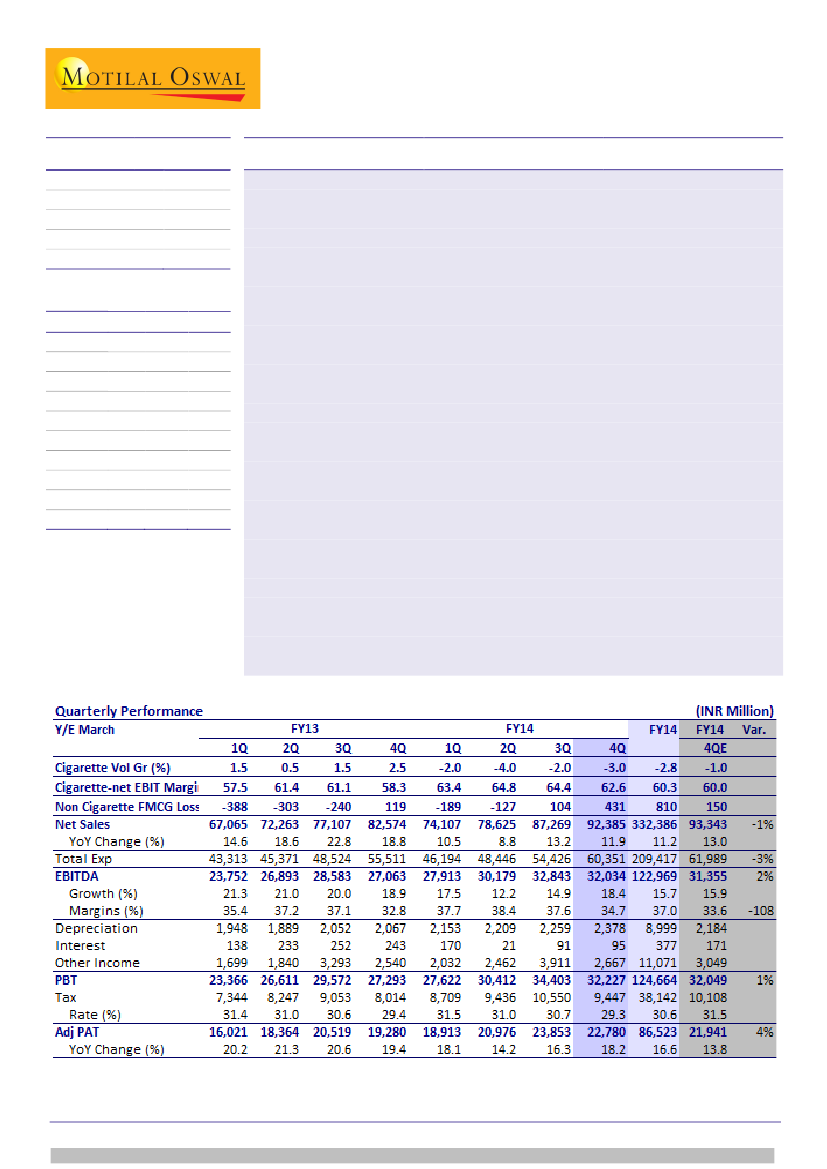
ITC’s 4QFY14 performance was tad ahead of our expectations with 4% beat on
PAT. Revenues grew 11.9% to INR 92.4b (est INR 93.4b); EBITDA grew 18.4% YoY
to INR32.0b (est. INR 31.3b), while Adj. PAT grew 18.2% to INR 22.8b (est.
INR21.9b).
Cig volumes declined ~3% while Cigarette EBIT grew robust 21% and posted
280bps margin expansion to 34.3% (13th consecutive quarter of margin exp).
64mm portfolio continues to perform well and now crossed 10% salience.
EBITDA margins expanded 190bp to 34.7% (est. 33.6%) led by 280bp expansion in
Cigarettes, 130bp in FMCG – Others, 580bp in Hotels, 40bp in Agri.
Non-Cig FMCG posted 13.7% sales growth (lowest since 1Q10) due to high base
(26% growth in base) and overall consumption slowdown. Segment EBIT went up
3.6x YoY and posted higher ever EBIT of INR431m. On a full year basis, ITC
reported EBIT of INR 218m, maiden annual profit.
Agri revenues grew 8.1% driven by leaf tobacco exports while margins expanded
40bp. Hotels continued to suffer from weak macros – 1.6% revenue growth, but
material ebit margin expansion of 580bps led by Chennai property. Paper segment
revenue grew 19.3% while EBIT remained flat (290bps margin decline) due to cost
inflation in Wood pulp.
Continued robust Cig EBIT growth and margin expansion coupled with positive
segment EBIT in non-Cig FMCG are the key highlights of the quarter. Within our
overall cautious stance on the sector, we believe ITC offers best risk reward
profile given the earnings visibility. ITC closed FY14 with profit growth of healthy
16.6%. Recovery in Cig volumes remain key concern. Excise duty changes in the
forthcoming budget will be near term trigger for the stock. Maintain our top
sector pick and reiterate
Buy
with a 12 month forward TP of INR 400 (27x FY16E
EPS), an upside of 17%.
Gautam Duggad
(Gautam.Duggad@MotilalOswal.com); +91 22 3982 5404
Manish Poddar
(Manish.Poddar@MotilalOswal.com); +91 22 3027 8029
Investors are advised to refer through disclosures made at the end of the Research Report.

ITC
Sales above estimates: Cigarette’s volume decline in line
4QFY14 revenues grew 11.9% to INR 92.4b (est. INR 93.3b), led by 13.7% sales
growth in Non-Cig FMCG, 12.6% increase in Cigarettes, 19.3% growth in Paper
business. Hotels and Agri business grew 8.1% and 1.6% respectively.
Cigarette volumes declined ~3% but margins expanded 280bp to 34.3% (on net
sales basis, margins expanded 430bp to 62.6%).
Gross margins improved by 110bp largely led by price hikes in Cigarettes
business.
EBITDA posted 18.4% YoY growth to INR32.0b (est. INR31.3b).
Adj. PAT posted 18.2% growth to INR22.8b (est. INR21.9b).
Segmental Performance
1QFY13 2QFY13 3QFY13 4QFY13 1QFY14 2QFY14 3QFY14 4QFY14
Net Sales (INR m)
Cigarettes
FMCG - Others
Hotels
Agri business
Paper and packaging
Sales growth (YoY, %)
Cigarettes
FMCG - Others
Hotels
Agri business
Paper and packaging
Volume growth (YoY, %)
Cigarettes
EBIT (INR m)
Cigarettes
FMCG - Others
Hotels
Agri business
Paper and packaging
EBIT growth (YoY, %)
Cigarettes
FMCG - Others
Hotels
Agri business
Paper and packaging
EBIT Margin (%)
Cigarettes
FMCG - Others
Hotels
Agri business
Paper and packaging
33,042
14,731
2,324
16,914
10,587
15.0
23.0
0.8
-0.9
10.3
1.5
33,852
16,908
2,170
20,239
10,590
14.0
26.1
2.8
41.1
5.3
0.5
36,574
17,827
3,095
16,310
10,616
13.1
30.1
11.0
43.1
8.5
1.5
22,335
-240
555
1,726
2,286
21.1
-48.8
-45.5
21.9
1.9
61.1
-1.3
17.9
10.6
21.5
36,232
20,362
3,155
18,545
10,575
11.5
26.0
10.4
31.1
7.9
2.5
21,124
119
406
1,275
1,881
20.2
-171.2
-51.0
20.8
-3.9
58.3
0.6
12.9
6.9
17.8
35,374
17,447
2,499
21,890
11,631
7.1
18.4
7.5
29.4
9.9
-2.0
22,417
-189
89
1,993
2,516
18.0
-51.3
-65.9
16.3
-5.0
63.4
-1.1
3.6
9.1
21.6
37,238
19,622
2,470
17,725
11,787
10.0
16.1
13.8
-12.4
11.3
-2.0
24,117
-127
87
2,846
2,208
15.9
-58.1
-43.0
9.6
-21.9
41,161
20,778
3,154
17,864
12,574
12.5
16.6
1.9
9.5
18.5
-2.0
26,526
104
622
2,054
2,317
18.8
-143.2
12.1
19.0
1.4
40,788
23,145
3,205
20,042
12,612
12.6
13.7
1.6
8.1
19.3
-3.0
25,519
431
599
1,455
1,884
20.8
263.0
47.3
14.1
0.1
18,998 20,802
-388
-303
262
153
1,714 2,597
2,647 2,825
20.5
-49.1
-48.9
9.1
16.6
57.5
-2.6
11.3
10.1
25.0
20.3
-45.8
-64.8
8.8
-2.5
61.4
-1.8
7.1
12.8
26.7
64.8
64.4
62.6
-0.6
0.5
1.9
3.5
19.7
18.7
16.1
11.5
7.3
18.7
18.4
14.9
Source: Company, MOSL
23 May 2014
2

ITC
Cigarette volumes decline ~3%; 280bp EBIT margin expansion
4QFY14 cigarette volumes declined 3%:
This is driven by sharp price hikes of
20% plus, post budget. Volume decline would have been higher in our view, if
not for the good traction in 64mm segment which now contributes 10-12% of
portfolio. Cigarettes gross sales were up 10.9% to INR74.3b, while net sales grew
12.6% to INR40.8b. Excise duties grew 9%, underscoring the shift in portfolio mix
towards 64mm segment.
We expect ITC to maneuver 64mm portfolio around 10-15% of total volumes to
optimize the profit mix. While percentage margins are not hurt by rising
contribution of 64mm, absolute profits per stick of 64mm is < RSFT.
EBIT Margin expanded 280bp to 34.3%
on the back of price increases and cost
containment (Segment costs remained flat YoY). On net sales basis, EBIT margins
expanded 430bp YoY to 62.6%. However, we believe price laddering is largely
done and further pricing action will be a function of any potential changes in
excise duty in the forthcoming budget.
Thus, Cigarette EBIT posted robust 20.8% YoY growth for 4Q14. For FY14, CIG
EBIT posted 18.4% growth with 190bps margin expansion to 33.9%
Recent price hikes in Classic, Gold Flake should drive Cig EBIT growth going
forward and boost earnings visibility of ITC.
Highest EBIT growth in 5 quarters
Cig EBIT growth (%)
Cig volumes declined 3% (est. of -1%)
Source: Company, MOSL
13th consecutive quarters of margin expansion in Cig
Cig EBIT margin expansion (Bps)
197
120
247
281
215
142
89 106
124
61
154
181
Consistent Cig EBIT margin expansion
Cig EBIT margins (%)
32.4 32.8
34.0
31.5
32.6
34.6 34.3
31.5 31.7
29.9
30.9 31.3
Source: Company, MOSL
23 May 2014
3

ITC
FMCG: deceleration in sales growth; maiden annual segment profits
FMCG sales grew 13.7% to INR23.1b led by high single digit volume growth
while segment profitability improved with a positive EBIT of INR 431m, up 3.6x
YoY.
Sales growth was lowest since 1Q10, impacted by overall consumption
slowdown and high base (26% growth in base). Relatively, Foods outperformed
within the other FMCG portfolio with good growth in Atta, Biscuits, Noodles
(Noodles grew 3x of industry in FY14).
Incremental EBIT margins stood at 11.2%.
ITC reported maiden annual segment profits with FY14 EBIT of INR 218m.
However, if ITC enters new HPC/Foods categories, as speculated by media (Oral
Care, Dairy, Chocolates, Juices etc) near term EBIT margins will be constrained.
Incremental EBIT margins at 11.2%
Incr EBIT Margin (%)
17.0
13.8
10.0
6.6
3.8
7.4
5.5
6.8 7.3
6.5
11.6
11.2
Incr EBIT Margin (%)
13.7% sales growth, lowest since 1Q10
32.4
Sales Growth (%)
30.1
27.2
26.0
24.122.922.625.7
22.523.8
19.4
18.4
16.8
16.116.6
13.7
Source: Company, MOSL
Non-Cig FMCG post highest ever EBIT
EBIT (INR m)
Source: MOSL, Company
Agri business: Single digit revenue growth
Agri Business sales grew by 8.1% impacted by higher base (31% growth in base).
EBIT margin improved by 40bp to 7.3% led by mix improvement.
For FY14, revenue and EBIT posted 7.7% and 14.2% growth respectively.
23 May 2014
4

ITC
Agri margins up 40bps YoY driven by mix improvement
EBIT Margins (%)
16.6
9.2
12.4
7.5
10.1
12.8
10.6
6.9
9.1
16.1
11.5
7.3
28.7%
24.0%
Agri contribution to revenue
Agri contri to ITC sales
28.3%
25.4%
29.8%
22.8%
21.9%
20.7%
20.6%
18.4%
22.7%
21.4%
Source: Company, MOSL
Hotels: Topline flat; material margin expansion
Hotel revenues grew 1.6% at INR3.2b,impacted by weak macro environment
and adverse demand supply situation.
EBIT grew strong 47% and margins expanded by 580bp to 18.7% as depreciation
expenses of new property in Chennai are now in the base.
For FY14, sales and EBIT posted 5.5% and 1.5% growth, respectively.
Hotel revenues flat
Sales (INR m)
EBIT (INR m)
Hotel margins improve 580bps YoY
50
40
30
20
10
0
EBIT Margins (%)
Source: Company, MOSL
Paper: strong revenue growth; margins contract 290bp
Paper and Paperboard business sales were up 19.3% to INR12.64b driven by
volumes and product mix.
EBIT remained flat. Sharp RM cost inflation in Wood and Coal dragged margins
by 290bp to 14.9%, lowest since 1Q08.
23 May 2014
5

ITC
Strong revenue growth in Paper aided by low base
EBIT Margins (%)
20.9
9.4
11.5
6.9
10.3
5.3
8.5
7.9
9.9
11.3
Sales growth (%)
18.5
19.3
Source: MOSL, Company
Valuation and view: Reiterate Buy with TP of INR400
Consistent Cig EBIT growth and highest ever EBIT in non-Cig FMCG were the key
highlights of the 4Q14 performance.
Within our overall cautious sector stance, we find ITC relatively better placed as
it offers the best earnings predictability and remains insulated from key
headwinds faced by other FMCG peers i.e. moderating volume growth in staples
and rising competitive intensity in HPC space.
Forthcoming budget will be key trigger to watch for any potential changes in
Cigarette excise duties.
Reiterate
Buy
with a TP of INR400 (27x FY16E EPS).
23 May 2014
6

ITC
ITC: an investment profile
Company description
ITC is an associate of BAT (British American Tobacco)
controls more than 2/3rd of the cigarette market in
India. ITC has emerged as a diversified conglomerate
with leading presence in Paperboards, Hotels and
Processed foods. E-Choupal, the agri rural initiative of
the company has been widely appreciated for its
foresight in harnessing the potential in the rural market.
Recent developments
ITC entered into Deodorants category with the
launch of its brand Engage.
It launched 3 offerings in 64mm segment .
Valuation and view
The stock trades at 26.6x FY15 and 23.1x FY16
estimates. Maintain
Buy
with TP of INR400 (27x
FY16 EPS).
Key investment arguments
Strong pricing power due to dominant market share
in the cigarettes.
Offers best earnings visibility in the sector.
FMCG business improving profitability.
Sector view
Key investment risks
Sector stance remains cautious with preference for
companies with high earnings visibility and low
competitive intensity.
Lagged impact of GDP slowdown is reflecting in the
sector with moderation in volume growth.
Taxation related risks though Excise and VAT hikes
for FY14 are announced.
Lower than expected Cig volume growth.
Comparative valuations
P/E (x)
P/BV (x)
EV/Sales (x)
EV/EBITDA (x)
FY15E
FY16E
FY15E
FY16E
FY15E
FY16E
FY15E
FY16E
ITC
26.6
23.1
10.8
9.9
6.6
5.7
17.6
15.3
HLL
32.3
28.5
18.5
15.9
3.8
3.3
23.1
19.9
Nestle
35.5
30.0
17.1
15.7
4.3
3.8
20.5
17.6
EPS: MOSL forecast v/s consensus (INR)
MOSL
Forecast
FY15
FY16
12.9
14.8
Consensus
Forecast
13.0
15.2
Variation
(%)
-1.0
-2.4
Target price and recommendation
Current
Price (INR)
342
Target
Price (INR)
400
Upside
(%)
17.0
Reco.
Buy
Shareholding pattern (%)
Mar-14
Promoter
Domestic Inst
Foreign
Others
0.0
34.7
50.4
14.9
Dec-13
0.0
34.3
50.5
15.2
Mar-13
0.0
33.4
51.1
15.5
Stock performance (1-year)
23 May 2014
7

ITC
Financials and valuations
Income statement
Y/E March
Net Sales
Change (%)
EBITDA
EBITDA Margin (%)
Depreciation
EBIT
Interest
Other Income
Extraordinary items
PBT
Tax
Tax Rate (%)
Reported PAT
Adjusted PAT
Change (%)
2013
296.1
19.4
106.3
35.5
8.0
98.3
0.9
9.4
0.0
106.8
32.7
30.6
74.2
74.2
20.4
2014
328.8
11.1
123.0
37.0
9.0
114.0
0.4
11.1
0.0
124.7
38.1
30.6
87.9
86.5
16.6
(INR Billion)
2015E
377.1
14.7
141.3
37.0
9.6
131.7
0.3
13.9
0.0
145.3
44.6
30.7
100.7
100.7
16.4
2016E
432.5
14.7
161.4
36.9
10.5
150.9
0.2
16.3
0.0
167.0
51.3
30.7
115.8
115.8
15.0
Ratios
Y/E March
Basic (INR)
EPS
Cash EPS
Book Value
DPS
Payout (incl. Div. Tax.)
Valuation(x)
P/E
Cash P/E
Price / Book Value
EV/Sales
EV/EBITDA
Dividend Yield (%)
Profitability Ratios (%)
RoE
RoCE
Turnover Ratios (%)
Asset Turnover (x)
Debtors (No. of Days)
2013
9.5
10.5
26.3
6.2
76.1
36.1
32.6
13.0
8.6
23.8
1.8
36.1
50.2
2014
11.1
12.4
28.9
7.1
76.1
30.9
27.6
11.8
7.7
20.5
2.1
38.8
53.4
2015E
12.9
14.1
31.7
8.6
78.4
26.6
24.3
10.8
6.6
17.6
2.5
40.6
57.0
2016E
14.8
16.1
34.4
10.4
81.9
23.1
21.2
9.9
5.7
15.3
3.0
43.0
60.7
Balance sheet
Y/E March
Share Capital
Reserves
Net Worth
Debt
Deferred Tax
Total Capital Employed
Gross Fixed Assets
Less: Acc Depreciation
Net Fixed Assets
Capital WIP
Investments
Current Assets
Inventory
Debtors
Cash & Bank
Loans & Adv, Others
Curr Liabs & Provns
Curr. Liabilities
Provisions
Net Current Assets
Total Assets
2013
7.8
197.9
205.7
0.9
7.8
214.5
153.0
56.2
96.8
10.0
84.3
136.4
75.1
13.7
30.2
17.4
113.0
64.7
48.3
23.4
214.5
2014
7.8
218.4
226.2
0.9
7.2
234.4
168.0
65.0
103.0
10.0
99.6
149.9
82.4
15.3
33.2
18.9
128.1
72.4
55.7
21.8
234.4
(INR Billion)
2015E
2016E
7.8
7.8
240.2
261.1
248.0
268.9
0.9
0.9
6.5
5.6
255.4
275.5
183.0
200.0
74.6
85.1
108.4
114.9
10.0
10.5
119.1
137.0
168.8
190.5
94.1
106.4
17.6
21.3
36.5
40.2
20.6
22.6
151.0
177.4
83.5
96.3
67.5
81.0
17.9
13.1
255.4
275.5
E: MOSL Estimates
1.4
14.6
1.4
16.1
1.5
15.9
1.6
16.4
Cash flow statement
Y/E March
OP/(Loss) before Tax
Depreciation
Others
Interest
Direct Taxes Paid
(Inc)/Dec in Wkg Cap
CF from Op. Activity
(Inc)/Dec in FA & CWIP
(Pur)/Sale of Invt
CF from Inv. Activity
Inc/(Dec) in Net Worth
Inc / (Dec) in Debt
Interest Paid
Divd Paid (incl Tax)
Others
CF from Fin. Activity
Inc/(Dec) in Cash
Add: Opening Balance
Closing Balance
2013
106.8
7.9
0.0
-8.5
32.7
-20.6
52.9
-2.3
-23.4
-25.7
0.0
0.0
8.5
-35.2
1.5
-25.2
2.0
28.2
30.2
2014
124.7
9.2
0.0
-10.7
38.1
-10.7
74.4
-15.0
-15.3
-30.3
0.0
0.0
10.7
-48.3
-3.4
-41.0
3.0
30.2
33.2
(INR Billion)
2015E
145.3
9.6
0.0
-13.6
44.6
-12.3
84.4
-15.0
-19.5
-34.5
0.0
0.0
13.6
-55.7
-4.4
-46.5
3.3
33.2
36.5
2016E
167.0
10.5
0.0
-16.1
51.3
-9.5
100.7
-17.5
-17.9
-35.4
0.0
0.0
16.1
-67.4
-10.3
-61.6
3.7
36.5
40.2
23 May 2014
8

ITC
NOTES
23 May 2014
9

Disclosures
This report is for personal information of the authorized recipient and does not construe to be any investment, legal or taxation advice to you. This research report does not constitute an offer, invitation or
inducement to invest in securities or other investments and Motilal Oswal Securities Limited (hereinafter referred as MOSt) is not soliciting any action based upon it. This report is not for public distribution
and has been furnished to you solely for your information and should not be reproduced or redistributed to any other person in any form.
Unauthorized disclosure, use, dissemination or copying (either whole or partial) of this information, is prohibited. The person accessing this information specifically agrees to exempt MOSt or any of its
affiliates or employees from, any and all responsibility/liability arising from such misuse and agrees not to hold MOSt or any of its affiliates or employees responsible for any such misuse and further agrees
to hold MOSt or any of its affiliates or employees free and harmless from all losses, costs, damages, expenses that may be suffered by the person accessing this information due to any errors and delays.
The information contained herein is based on publicly available data or other sources believed to be reliable. While we would endeavour to update the information herein on reasonable basis, MOSt and/or
its affiliates are under no obligation to update the information. Also there may be regulatory, compliance, or other reasons that may prevent MOSt and/or its affiliates from doing so. MOSt or any of its
affiliates or employees shall not be in any way responsible and liable for any loss or damage that may arise to any person from any inadvertent error in the information contained in this report. MOSt or any
of its affiliates or employees do not provide, at any time, any express or implied warranty of any kind, regarding any matter pertaining to this report, including without limitation the implied warranties of
merchantability, fitness for a particular purpose, and non-infringement. The recipients of this report should rely on their own investigations.
ITC
This report is intended for distribution to institutional investors. Recipients who are not institutional investors should seek advice of their independent financial advisor prior to taking any investment decision
based on this report or for any necessary explanation of its contents.
MOSt and/or its affiliates and/or employees may have interests/positions, financial or otherwise in the securities mentioned in this report. To enhance transparency, MOSt has incorporated a Disclosure of
Interest Statement in this document. This should, however, not be treated as endorsement of the views expressed in the report.
Disclosure of Interest Statement
1. Analyst ownership of the stock
2. Group/Directors ownership of the stock
3. Broking relationship with company covered
4. Investment Banking relationship with company covered
ITC
No
No
No
No
Analyst Certification
The views expressed in this research report accurately reflect the personal views of the analyst(s) about the subject securities or issues, and no part of the compensation of the research analyst(s) was, is,
or will be directly or indirectly related to the specific recommendations and views expressed by research analyst(s) in this report. The research analysts, strategists, or research associates principally
responsible for preparation of MOSt research receive compensation based upon various factors, including quality of research, investor client feedback, stock picking, competitive factors and firm revenues.
This report is not directed or intended for distribution to or use by any person or entity resident in a state, country or any jurisdiction, where such distribution, publication, availability or use would be contrary
to law, regulation or which would subject MOSt & its group companies to registration or licensing requirements within such jurisdictions.
Regional Disclosures (outside India)
This report is intended for distribution only to persons having professional experience in matters relating to investments as described in Article 19 of the Financial Services and Markets Act 2000 (Financial
Promotion) Order 2005 (referred to as "investment professionals"). This document must not be acted on or relied on by persons who are not investment professionals. Any investment or investment activity
to which this document relates is only available to investment professionals and will be engaged in only with such persons.
For U.K.
Motilal Oswal Securities Limited (MOSL) is not a registered broker - dealer under the U.S. Securities Exchange Act of 1934, as amended (the"1934 act") and under applicable state laws in the United
States. In addition MOSL is not a registered investment adviser under the U.S. Investment Advisers Act of 1940, as amended (the "Advisers Act" and together with the 1934 Act, the "Acts), and under
applicable state laws in the United States. Accordingly, in the absence of specific exemption under the Acts, any brokerage and investment services provided by MOSL, including the products and services
described herein are not available to or intended for U.S. persons.
This report is intended for distribution only to "Major Institutional Investors" as defined by Rule 15a-6(b)(4) of the Exchange Act and interpretations thereof by SEC (henceforth referred to as "major
institutional investors"). This document must not be acted on or relied on by persons who are not major institutional investors. Any investment or investment activity to which this document relates is only
available to major institutional investors and will be engaged in only with major institutional investors. In reliance on the exemption from registration provided by Rule 15a-6 of the U.S. Securities Exchange
Act of 1934, as amended (the "Exchange Act") and interpretations thereof by the U.S. Securities and Exchange Commission ("SEC") in order to conduct business with Institutional Investors based in the
U.S., MOSL has entered into a chaperoning agreement with a U.S. registered broker-dealer, Motilal Oswal Securities International Private Limited. ("MOSIPL"). Any business interaction pursuant to this
report will have to be executed within the provisions of this chaperoning agreement.
The Research Analysts contributing to the report may not be registered /qualified as research analyst with FINRA. Such research analyst may not be associated persons of the U.S. registered broker-
dealer, MOSIPL, and therefore, may not be subject to NASD rule 2711 and NYSE Rule 472 restrictions on communication with a subject company, public appearances and trading securities held by a
research analyst account.
For U.S.
Motilal Oswal Capital Markets Singapore Pte Limited is acting as an exempt financial advisor under section 23(1)(f) of the Financial Advisers Act(FAA) read with regulation 17(1)(d) of the Financial
Advisors Regulations and is a subsidiary of Motilal Oswal Securities Limited in India. This research is distributed in Singapore by Motilal Oswal Capital Markets Singapore Pte Limited and it is only directed
in Singapore to accredited investors, as defined in the Financial Advisers Regulations and the Securities and Futures Act (Chapter 289), as amended from time to time.
In respect of any matter arising from or in connection with the research you could contact the following representatives of Motilal Oswal Capital Markets Singapore Pte Limited:
Anosh Koppikar
Kadambari Balachandran
Email:anosh.Koppikar@motilaloswal.com
Email : kadambari.balachandran@motilaloswal.com
Contact(+65)68189232
Contact: (+65) 68189233 / 65249115
Office Address:21 (Suite 31),16 Collyer Quay,Singapore 04931
For Singapore
Motilal Oswal Securities Ltd
23 May 2014
Motilal Oswal Tower, Level 9, Sayani Road, Prabhadevi, Mumbai 400 025
Phone: +91 22 3982 5500 E-mail: reports@motilaloswal.com
10