29 May 2014
4QFY14 Results Update | Sector:
Consumer
Bajaj Electricals
BSE SENSEX
24,234
Bloomberg
Equity Shares (m)
M.Cap. (INR b) / (USD b)
52-Week Range (INR)
1, 6, 12 Rel. Per (%)
S&P CNX
7,236
BJE IN
100.1
32.0/0.5
385/150
-1/75/75
CMP: INR320
TP: INR370
Buy
Financials & Valuation (INR Million)
Y/E Mar
2014 2015E 2016E
Net Sales
EBITDA
Adj PAT
EPS (INR)
Growth
(%)
BV/Share
( )
RoE (%)
RoCE (%)
P/E (x)
P/BV (X)
40,298 46,256 53,559
818
-53
-0.5
71.1
-0.7
8.3
-601.1
4.5
3,701
1,851
18.6
85.0
23.8
38.4
17.2
3.8
4,445
2,291
23.0
23.8
101.0
24.7
41.6
13.9
3.2
-116.2 -3,584.9
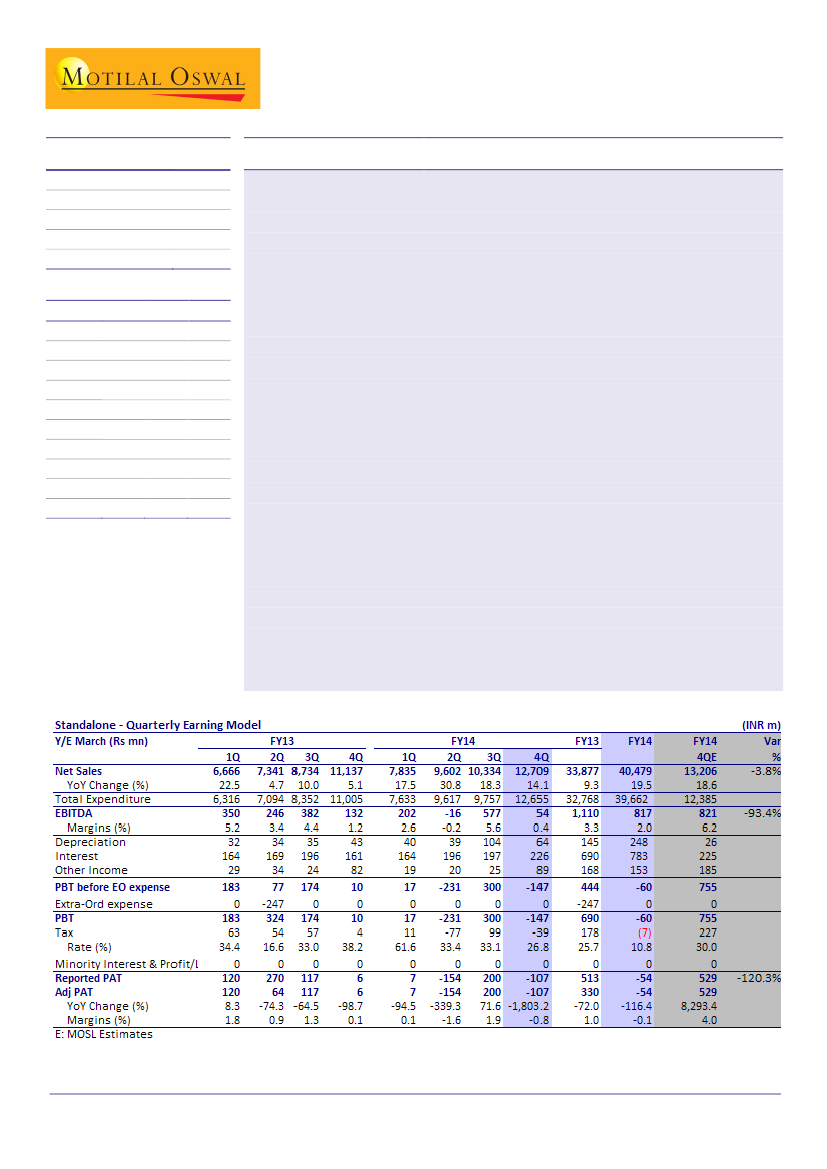
E&P turnaround on track; worst of margins in consumer business is behind:
Bajaj
Electricals (BJE) reported revenue of INR12.7b (est. of INR13.2b), compared to
INR11.1b in 4QFY13, marking a YoY growth of 14.1%. While E&P division reported
robust 54% growth, poor demand environment impacted growth in Lighting (4%
growth YoY) and Consumer Durable (-2% growth YoY) businesses. EBITDA margin
for 4QFY14 stood at 0.4% (est. 6.2%), against 1.2% in 4QFY13. While E&P posted a
strong turnaround with margins for the quarter standing at -4.7%, against -17.8%
in 4QFY13, margins for the Lighting (3% v/s 7.9%) and Consumer Durable (3.6% v/s
8%) were weak due to large discounting during the quarter and unfavorable
operating leverage.
FY15 to witness strong improvement in profitability:
BJE’s management guided
for 15% growth in Lighting and Consumer Durable divisions and 25% growth in
E&P business for FY15. With most legacy contracts for E&P division concluded in
FY14, coupled with strict timeliness in execution of new projects, E&P is set to turn
profitable from 1QFY15. Management is confident on improving E&P division’s
RoCE to 20%, thus improving overall RoCE profile. We believe the worst of decline
in margins in consumer facing businesses is behind and with favorable exchange
rate environment and recovery in demand, margins will bounce back. We expect
earnings to grow from INR-53m in FY14 to INR1.8b in FY15E / INR2.3b in FY16E.
Valuation and view:
Over the last three years, E&P division’s dismal performance
clouded BJE’s robust underlying consumer franchise. With expected turnaround of
E&P business, we believe BJE will continue to get re-rated thus reducing the
valuation gap with peers. We cut the earnings estimate for FY15E and FY16E by
13% and 7% respectively to factor the lower margins. We value BJE at 16x FY16E
EPS of INR23 and arrive at a target price of INR370. Maintain
Buy.
Atul Mehra
(Atul.Mehra@MotilalOswal.com); +91 22 3982 5417
Niket Shah
(Niket.Shah@MotilalOswal.com); +91 22 3982 5426
Investors are advised to refer through disclosures made at the end of the Research Report.

Bajaj Electricals
Revenue growth below estimates
BJE reported revenues of INR12.7b (est of INR13.2b) as compared to INR11.1b in
4QFY13, marking a YoY growth of 14.1%.
Lighting business grew by 4% YoY to INR3b, while consumer durables posted de-
growth to the tune of 2% to INR5.3b. E&P business posted strong growth at 54%
YoY to INR4.4b
EBITDA stood at INR54m (est INR821m) as against INR132m in 4QFY13, marking
a YoY growth of -59%. EBITDA margins for 4QFY14 stood at 0.4% (est 6.2%)
against 1.2% in 4QFY13.
Margins for the lighting division stood at 3% as against 7.9% in 4QFY13, while
consumer durable margins stood at 3.6% as against 8.0% in 4QFY13. E&P posted
a strong turn-around with margins for the quarter standing at -4.7% as against -
17.8% in 4QFY13. Margins have surprised negatively in the consumer and
lighting divisions.
Capital employed as of 4QFY14 stood at INR7.5b as against INR6.8b in 4QFY13
marking a YoY growth of 8%. On a YoY basis, capital employed de-grew by 45%
in lighting division and stood at INR402m, de-grew by 47% in consumer durables
division and stood at INR717m and grew 33% in E&P division and stood at
INR6,309m
PAT for 4QFY14 stood at INR-107m (est INR529m) as compared to INR6m in
4QFY13.
Capex for FY15 expected at INR900m including INR500m for R&D centre.
Revenue growth at 14%
Revenues (INR m)
11,137
7,341
6,666
4.7
8,734
10.0
5.1
7,835
17.5
Growth (YoY) %
30.8
10,334
9,602
18.3
14.1
12,709
22.5
1QFY13
2QFY13
3QFY13
4QFY13
1QFY14
2QFY14
3QFY14
4QFY14
Source: Company, MOSL
EBITDA growth subdued led by lower margins
EBITDA (INR m)
5.2
3.4
1.2
350
246
382
132
202
4.4
2.6
-0.2
-16
577
0.4
54
EBITDA Margin (%)
5.6
PAT negative dragged by E&P losses
PAT (INR m)
3.7
1.9
1.8
120
270
1.3
117
6
7
-154
200
-107
PAT Margin (%)
0.1
0.1
(1.6)
(0.8)
Source: Company, MOSL
29 May 2014
2

Bajaj Electricals
Lighting & Luminaires business witnessed weak growth and margin erosion
Lighting and Luminaires business revenues grew by 4% YoY to INR3b.
While lighting posted 2.8% growth, Luminaires grew by 6.5% YoY
Margins for the lighting division stood at 3.0% as against 7.9% in 4QFY13.
Weak consumer sentiment and high discounting impacted margins.
Management is confident of margins in the lighting division recovering to 5%
levels in 1QFY15 and 7% levels for full year FY15. Higher contribution from CFL
(CFL margins stand at ~10%), to further aid in margin expansion.
Management expects lighting to post 15% growth in FY15.
4QFY14 saw weak revenue growth for lighting division
Revenues (INR m)
Growth (YoY) %
24.4
19.7
14.9
10.7
6.6
1,525
1QFY13
2,018
2QFY13
2,216
3QFY13
2,847
4QFY13
3.2
1,574
1QFY14
2,509
2QFY14
11.6
4.5
2,472
3QFY14
2,975
4QFY14
Source: Company, MOSL
Margins stood at 3.0% as against 7.9%, decline 500bp YoY
EBIT (INR m)
7.0
7.9
4.9
EBIT Margin (%)
7.6
5.2
3.0
74
1QFY13
130
2QFY13
156
3QFY13
224
4QFY13
77
1QFY14
191
2QFY14
129
3QFY14
89
4QFY14
6.5
4.8
Source: Company, MOSL
RoCE remains robust; capital employed declines by 45% YoY
Capital Employed (INR m)
RoCE (%)
159.0
96.7
47.0
627
1QFY13
538
2QFY13
604
3QFY13
732
4QFY13
103.5
122.5
114.6
88.4
33.7
911
1QFY14
668
2QFY14
323
3QFY14
402
4QFY14
Source: Company, MOSL
29 May 2014
3

Bajaj Electricals
Consumer durables growth and margins to bounce back in FY15
Consumer durables (CD) business revenues de-grew by 2% YoY to INR5.3b.
Morphy Richards witnesses 12% growth during the quarter.
Margins for the CD division stood at 3.6% as against 8.0% in 4QFY13.
Revenues in the month of April have grown by 20% led by better growth in
summer-facing products like fans and air-coolers.
Management expects CD to post 15% growth in FY15.
Higher growth, improvement in exchange rate environment will higher drive
margins for CD in FY15.
Further, with discounting being discontinued beginning 1
st
April, 2014 margins
erosion witnessed in 4QFY14 will be fully corrected.
Management is confident of margins in the CD division recovering to 9% levels
in 1QFY15 and for full year FY15.
4QFY14 saw weak revenue growth for consumer durable division
Revenues (INR m)
28.9
17.5
22.0
22.4
11.7
13.8
2.9
3,908
1QFY13
3,988
2QFY13
5,046
3QFY13
5,436
4QFY13
4,366
1QFY14
4,539
2QFY14
5,192
3QFY14
(2.0)
5,330
4QFY14
Growth (YoY) %
Source: Company, MOSL
Margins stood at 3.6% as against 8.0%, decline 440bp YoY
EBIT (INR m)
12.1
8.4
9.3
8.0
9.2
EBIT Margin (%)
8.5
9.6
3.6
328
1QFY13
369
2QFY13
609
3QFY13
438
4QFY13
403
1QFY14
386
2QFY14
500
3QFY14
191
4QFY14
Source: Company, MOSL
29 May 2014
4

Bajaj Electricals
RoCE improves further; capital employed declines by 47% YoY
Capital Employed (INR m)
RoCE (%)
106.2
80.3
56.6
40.9
23.4
804
1QFY13
1,577
2QFY13
759
3QFY13
32.2
1,359
4QFY13
22.8
1,770
1QFY14
29.2
1,321
2QFY14
884
3QFY14
717
4QFY14
Source: Company, MOSL
Bajaj Electricals has a huge mass market product portfolio
Segment
Sub-
Segment
Lighting
Lighting
Luminaries
25,000
Mkt Size
(INR m)
50,000
Organized Mkt Share
Description
Competition
(%)
(%)
GLS lamps, fluorescent tube lights, compact
Philips, Crompton,
65%
8%
fluorescent lamps, domestic luminaries, ballasts &
Surya, Havells, etc
starters, LED torches
Industrial, commercial, decorative, street light,
floodlight, LED, lighting electronics, lighting control, Phillips, Crompton,
65%
5%
HID Lamps: Mercury & sodium vapor lamps,
Wipro, Thorn
halogen lamps, metal halide & fluorescent lamps
Ceiling, table, pedestal & wall mounted fans,
Crompton, Usha,
personal fans, Bajaj-Disney children’s fans,
65%
17%
Orient, Khaitan,
Industrial exhaust fans, commercial air industrial
Polar, Havells
fans, circulators, cooler kits and pumps
Mixers grinders, juicers, food processors, water
heaters, air coolers, iron, ovens toasters grillers
Philips, Kenstar,
(OTG), room heaters, toasters & S/W makers, hand Usha, Maharaja,
70%
20%
blenders, water filters microwave ovens gas stove Preeti, Prestige,
purifiers & filters, ovens, stoves, electric kettles,
Kenwood
coffee/tea makers
Source: Company, MOSL
Fans
Consumer Durables
Appliances
35,000
68,000
Bajaj has a strong retail network
Retail Network
400,000
45,000
86,000
Appliances
Fans
Lighting
Source: Company, MOSL
BJE has the highest reach as
compared to peers like Havells
and TTK Prestige
Bajaj leads the distribution game…
Channel
Retail Network
EBOs
Bajaj Electricals
4,00,000
Havells
> 1,00,000
TTK Prestige
25,000
Source: Company, MOSL
103 'Bajaj World' Stores 210 'Havells Galaxy' Stores 500 'Prestige Smart Kitchen' Stores
29 May 2014
5

Bajaj Electricals
Bajaj World Stores to be expanded aggressively
BJE has aggressively grown Bajaj World Stores from 40 in FY13 to 103 in FY14.
Management is confident of doubling store count to 200 by FY15
Bajaj World Stores to improve brand visibility and loyalty.
Bajaj World Stores to be significantly expanded
Bajaj World Stores
250
200
103
40
FY13
FY14
FY15E
FY16E
Source: Company, MOSL
Engineering and Projects turnaround on track
Revenues for the E&P division grew by 54% to INR4.4b during the quarter.
Margins for the division improved from -17% to -4.7% on a YoY basis.
BJE has an outstanding order book amounting to INR23b in E&P.
Management is confident that growth for FY15 will be more than 25%.
Further, with most legacy contracts concluded and strict focus on execution of
new contracts, E&P division is set to turn profitable from 1QFY15.
Management has provided for INR480m as doubtful receivables in FY14 for
legacy contracts and hence expects no losses from legacy contracts in FY15.
Management expects margins for the division to be atleast 6% in FY15.
Management is targeting to maintain capital employed at current levels of
INR6b, even as business will expand by more than 20% annually over FY14-16.
Consequently, asset turnover is expected to improve to 2.5x and RoCE for the
division is expected to improve to 20%.
E&P division continues to post strong growth
Revenues (INR m)
Growth (YoY) %
91.8
53.6
8.4
1,232
1QFY13
2QFY13
3QFY13
4QFY13
(22.5)
1,327
(18.1)
1,469
(22.4)
2,852
1,893
1QFY14
2,545
2QFY14
2,667
3QFY14
4,403
4QFY14
81.6
54.4
Source: Company, MOSL
29 May 2014
6

Bajaj Electricals
E&P turnaround on track as profitability continues to improve
EBIT (INR m)
1QFY13
-71
-5.7
-13.7
-20.2
-27.1
-17.8
-17.0
2QFY13
-268
3QFY13
-398
4QFY13
-507
EBIT Margin (%)
1QFY14
-259
2QFY14
3QFY14
4QFY14
-205
-5.1
-4.7
-433 -135
Source: Company, MOSL
Legacy contracts resulting in losses and sub-optimal return profile
Capital Employed (INR m)
-1.3
-4.5
-6.9
-10.7
5,625
1QFY13
5,918
2QFY13
5,731
3QFY13
4,752
4QFY13
4,892
1QFY14
5,137
2QFY14
5,950
3QFY14
-13.0
6,309
4QFY14
-5.3
-8.4
RoCE (%)
-2.3
Source: Company, MOSL
Management is targeting 20% RoCE, led by 2.5x asset turn and 8% EBIT margin
Asset Turnover (x)
23%
1.9
19%
15%
1.7
11%
1.6
9%
1.6
5%
3%
-26%
FY09
FY10
FY11
FY12
FY13
1.4
1.4
-13%
13%
-18%
-9%
FY14
FY15
FY16
8%
8%
EBIT Margins (%)
RoCE (%)
2.5
20%
2.5
20%
Source: Company, MOSL
29 May 2014
7

Bajaj Electricals
Story in Charts
Revenue Contribution (%)
Segment Profitability (%)
128%
Engineering
&
Projects, 20
Lighting, 25
Segment RoCE (%)
80%
Consumer
Durables, 50
-26%
Consumer Durables
Lighting
E&P
Source: MOSL, Company
E&P segment a drag on overall profitability
11%
E&P division's contibution to operating profits (%)
21%
20%
Management changes to ensure turnaround
E&P EBIT (INR m)
3.2%
265
(1,032)
(1,243)
-9.0%
Margin
5.0%
690
5.0%
829
-114%
FY12
FY13
-110%
FY14E
FY15E
FY16E
FY12
-18.1%
FY13
FY14E
FY15E
FY16E
Source: MOSL, Company
Earnings to quadruple
PAT
1,854
1,179
512
(53)
FY12
FY13
FY14E
FY15E
FY16E
2,296
Bajaj Electricals reports strong overall capital efficiency
RoCE (%)
39
29
43
13
8
FY12
FY13
FY14E
FY15E
FY16E
Source: MOSL, Company
29 May 2014
8

Bajaj Electricals
Bajaj Electricals: an investment profile
Company description
BJE operates largely in three segments – Lighting &
Luminaires (LL), Consumer Durables (CD) and
Engineering & Projects (E&P). The CD segment
contributes ~55% to revenues, while the LL segment
contributes ~25% to revenues. Together, Consumer-
facing Appliances and Lighting businesses, for which
BJE is known for, contribute ~80% to revenues. The
E&P segment contributes ~20% to revenues.
BJE has a wide distribution reach, with over 4,100
dealers and a 400k strong retail network for Lighting,
86k dealers for Fans and 45k dealers for Appliances
across India. Manufacturing is entirely outsourced to
80 different vendors across India, leaving the
management free to focus on innovation, brand
building and distribution.
We expect the E&P business to witness a sharp
turnaround in FY15 led by key initiatives undertaken
over the last 12 months.
Consolidated earnings are set to quadruple over
FY14-16, driven by the expected turnaround in E&P
and continued robust performance in Consumer-
facing businesses. The stock should see a re-rating,
as overall performance improves.
Key investments risks
Key investments arguments
BJE’s import content (includes 40% of Morphy
Richards, 20% of Appliances, 10% each of Lighting
and Fans) contributes ~15% of its revenues. INR
depreciation could put pressure on near-term
margins.
Contrary to our expectations, if the E&P business
does not recover, the stock price may be adversely
impacted.
Bajaj Electricals (BJE) enjoys enviable consumer
franchise, with market leadership in Small
Appliances. Given its asset-light model, large
product portfolio and wide distribution network,
the performance of its Consumer-facing businesses
remains robust.
BJE’s Engineering & Projects (E&P) business,
however, has been burning cash, impacting
consolidated financials and stock performance.
Valuation and view
With expected turnaround of E&P business, we
believe BJE will continue to get re-rated thus
reducing the valuation gap with peers. We cut the
earnings estimate for FY15E and FY16E by 13%
and 7% respectively to factor the lower margins.
We value BJE at 16x FY16E EPS of INR23 and arrive
at a target price of INR370. Maintain
Buy.
Target price and recommendation
Current
Price (INR)
320
Target
Price (INR)
370
Upside
(%)
15.6
Reco
Buy
EPS: MOSL forecast v/s consensus (INR)
MOSL
Forecast
FY15
FY16
18.6
23.0
Consensus
Forecast
18.6
23.4
Variation
(%)
0%
-1.7%
Shareholding pattern (%)
Promoter
Domestic Inst
Foreign
Others
Mar-14
66.1
3.8
15.4
14.7
Dec-13
66.2
2.9
15.9
15.0
Mar-13
66.1
4.5
12.0
17.5
Stock performance (1-year)
29 May 2014
9

Bajaj Electricals
Financials and valuation
Income statement
Y/E March
Net Sales
Change (%)
EBITDA
EBITDA Margin (%)
Depreciation
EBIT
Interest
Other Income
Extraordinary items
PBT
Tax
Tax Rate (%)
Reported PAT
Adjusted PAT
Change (%)
Min. Int. & Assoc. Share
Adj Cons PAT
2013
33,876
9.3
1,108
3.3
145
963
690
169
-247
690
178
25.8
512
329
-72.1
0
329
(INR Million)
2014
2015E
40,298 46,256
19.0
14.8
818
3,701
2.0
8.0
248
297
571
3,404
783
827
153
185
0
0
-60
2,762
-7
911
10.9
33.0
-53
1,851
-53
1,851
-116.2 -3,584.9
0
0
-53
1,851
2016E
53,559
15.8
4,445
8.3
346
4,099
868
241
0
3,472
1,180
34.0
2,291
2,291
23.8
0
2,291
Ratios
Y/E March
Basic (INR)
EPS
Cash EPS
Book Value
DPS
Payout (incl. Div. Tax.)
Valuation(x)
P/E
Cash P/E
Price / Book Value
EV/Sales
EV/EBITDA
Dividend Yield (%)
Profitability Ratios (%)
RoE
RoCE
Turnover Ratios (%)
Asset Turnover (x)
Debtors (No. of Days)
Inventory (No. of Days)
Creditors (No. of Days)
Leverage Ratios (%)
Net Debt/Equity (x)
2013
3.3
4.7
73.0
2.0
45.6
97.2
67.5
4.4
1.0
29.9
0.6
4.6
12.6
3.8
100.3
45.4
50.2
0.2
2014
-0.5
1.9
71.1
1.2
-269.1
-601.1
164.2
4.5
0.8
39.9
0.4
-0.7
8.3
5.0
111.5
40.5
110.9
0.2
2015E
18.6
21.5
85.0
4.0
25.2
17.2
14.9
3.8
0.7
9.1
1.3
23.8
38.4
4.6
89.2
42.7
49.6
0.2
2016E
23.0
26.4
101.0
6.0
30.6
13.9
12.1
3.2
0.6
7.3
1.9
24.7
41.6
5.2
89.2
42.5
49.6
0.1
Balance sheet
Y/E March
Share Capital
Reserves
Net Worth
Debt
Deferred Tax
Total Capital Employed
Gross Fixed Assets
Less: Acc Depreciation
Net Fixed Assets
Capital WIP
Investments
Current Assets
Inventory
Debtors
Cash & Bank
Loans & Adv, Others
Curr Liabs & Provns
Curr. Liabilities
Provisions
Net Current Assets
Total Assets
2013
200
7,087
7,286
1,659
-79
8,866
3,260
996
2,264
59
298
18,874
4,212
9,379
501
4,781
12,628
11,846
782
6,246
8,866
2014
200
6,896
7,095
1,306
-332
8,069
3,760
1,244
2,517
0
673
23,437
4,467
12,427
544
6,000
18,557
17,629
928
4,880
8,069
(INR Million)
2015E
2016E
200
200
8,279
9,871
8,479 10,070
1,806
506
-332
-332
9,953 10,244
4,660
5,160
1,541
1,887
3,120
3,274
0
0
673
673
23,237 26,238
5,412
6,241
11,406 13,206
115
112
6,305
6,679
17,077 19,940
15,812 18,281
1,265
1,659
6,160
6,298
9,953 10,244
E: MOSL Estimates
Cash flow statement
Y/E March
OP/(Loss) before Tax
Depreciation
Others
Interest
Direct Taxes Paid
(Inc)/Dec in Wkg Cap
CF from Op. Activity
(Inc)/Dec in FA & CWIP
(Pur)/Sale of Invt
Others
CF from Inv. Activity
Inc/(Dec) in Net Worth
Inc / (Dec) in Debt
Interest Paid
Divd Paid (incl Tax)
CF from Fin. Activity
Inc/(Dec) in Cash
Add: Opening Balance
Closing Balance
2013
690
145
0
671
398
171
1,422
-392
-70
461
-2
0
-500
-660
-279
-1,439
-18
519
501
2014
-60
248
0
630
-7
5,344
6,168
-441
0
153
-289
0
-4,911
-783
-143
-5,837
43
501
544
(INR Million)
2015E
2,762
297
0
642
911
-1,710
1,079
-900
0
185
-715
0
500
-827
-467
-794
-429
544
115
2016E
3,472
346
0
627
1,180
-141
3,124
-500
0
241
-259
0
-1,300
-868
-700
-2,869
-3
115
112
29 May 2014
10

Bajaj Electricals
NOTES
29 May 2014
11

Disclosures
Bajaj Electricals
This report is for personal information of the authorized recipient and does not construe to be any investment, legal or taxation advice to you. This research report does not constitute an offer, invitation or
inducement to invest in securities or other investments and Motilal Oswal Securities Limited (hereinafter referred as MOSt) is not soliciting any action based upon it. This report is not for public distribution
and has been furnished to you solely for your information and should not be reproduced or redistributed to any other person in any form.
Unauthorized disclosure, use, dissemination or copying (either whole or partial) of this information, is prohibited. The person accessing this information specifically agrees to exempt MOSt or any of its
affiliates or employees from, any and all responsibility/liability arising from such misuse and agrees not to hold MOSt or any of its affiliates or employees responsible for any such misuse and further agrees
to hold MOSt or any of its affiliates or employees free and harmless from all losses, costs, damages, expenses that may be suffered by the person accessing this information due to any errors and delays.
The information contained herein is based on publicly available data or other sources believed to be reliable. While we would endeavour to update the information herein on reasonable basis, MOSt and/or
its affiliates are under no obligation to update the information. Also there may be regulatory, compliance, or other reasons that may prevent MOSt and/or its affiliates from doing so. MOSt or any of its
affiliates or employees shall not be in any way responsible and liable for any loss or damage that may arise to any person from any inadvertent error in the information contained in this report. MOSt or any
of its affiliates or employees do not provide, at any time, any express or implied warranty of any kind, regarding any matter pertaining to this report, including without limitation the implied warranties of
merchantability, fitness for a particular purpose, and non-infringement. The recipients of this report should rely on their own investigations.
This report is intended for distribution to institutional investors. Recipients who are not institutional investors should seek advice of their independent financial advisor prior to taking any investment decision
based on this report or for any necessary explanation of its contents.
MOSt and/or its affiliates and/or employees may have interests/positions, financial or otherwise in the securities mentioned in this report. To enhance transparency, MOSt has incorporated a Disclosure of
Interest Statement in this document. This should, however, not be treated as endorsement of the views expressed in the report.
Disclosure of Interest Statement
1. Analyst ownership of the stock
2. Group/Directors ownership of the stock
3. Broking relationship with company covered
4. Investment Banking relationship with company covered
BAJAJ ELECTRICALS LTD
No
No
No
No
Analyst Certification
The views expressed in this research report accurately reflect the personal views of the analyst(s) about the subject securities or issues, and no part of the compensation of the research analyst(s) was, is,
or will be directly or indirectly related to the specific recommendations and views expressed by research analyst(s) in this report. The research analysts, strategists, or research associates principally
responsible for preparation of MOSt research receive compensation based upon various factors, including quality of research, investor client feedback, stock picking, competitive factors and firm revenues.
This report is not directed or intended for distribution to or use by any person or entity resident in a state, country or any jurisdiction, where such distribution, publication, availability or use would be contrary
to law, regulation or which would subject MOSt & its group companies to registration or licensing requirements within such jurisdictions.
Regional Disclosures (outside India)
This report is intended for distribution only to persons having professional experience in matters relating to investments as described in Article 19 of the Financial Services and Markets Act 2000 (Financial
Promotion) Order 2005 (referred to as "investment professionals"). This document must not be acted on or relied on by persons who are not investment professionals. Any investment or investment activity
to which this document relates is only available to investment professionals and will be engaged in only with such persons.
For U.K.
Motilal Oswal Securities Limited (MOSL) is not a registered broker - dealer under the U.S. Securities Exchange Act of 1934, as amended (the"1934 act") and under applicable state laws in the United
States. In addition MOSL is not a registered investment adviser under the U.S. Investment Advisers Act of 1940, as amended (the "Advisers Act" and together with the 1934 Act, the "Acts), and under
applicable state laws in the United States. Accordingly, in the absence of specific exemption under the Acts, any brokerage and investment services provided by MOSL, including the products and services
described herein are not available to or intended for U.S. persons.
This report is intended for distribution only to "Major Institutional Investors" as defined by Rule 15a-6(b)(4) of the Exchange Act and interpretations thereof by SEC (henceforth referred to as "major
institutional investors"). This document must not be acted on or relied on by persons who are not major institutional investors. Any investment or investment activity to which this document relates is only
available to major institutional investors and will be engaged in only with major institutional investors. In reliance on the exemption from registration provided by Rule 15a-6 of the U.S. Securities Exchange
Act of 1934, as amended (the "Exchange Act") and interpretations thereof by the U.S. Securities and Exchange Commission ("SEC") in order to conduct business with Institutional Investors based in the
U.S., MOSL has entered into a chaperoning agreement with a U.S. registered broker-dealer, Motilal Oswal Securities International Private Limited. ("MOSIPL"). Any business interaction pursuant to this
report will have to be executed within the provisions of this chaperoning agreement.
The Research Analysts contributing to the report may not be registered /qualified as research analyst with FINRA. Such research analyst may not be associated persons of the U.S. registered broker-
dealer, MOSIPL, and therefore, may not be subject to NASD rule 2711 and NYSE Rule 472 restrictions on communication with a subject company, public appearances and trading securities held by a
research analyst account.
For U.S.
Motilal Oswal Capital Markets Singapore Pte Limited is acting as an exempt financial advisor under section 23(1)(f) of the Financial Advisers Act(FAA) read with regulation 17(1)(d) of the Financial
Advisors Regulations and is a subsidiary of Motilal Oswal Securities Limited in India. This research is distributed in Singapore by Motilal Oswal Capital Markets Singapore Pte Limited and it is only directed
in Singapore to accredited investors, as defined in the Financial Advisers Regulations and the Securities and Futures Act (Chapter 289), as amended from time to time.
In respect of any matter arising from or in connection with the research you could contact the following representatives of Motilal Oswal Capital Markets Singapore Pte Limited:
Anosh Koppikar
Kadambari Balachandran
Email:anosh.Koppikar@motilaloswal.com
Email : kadambari.balachandran@motilaloswal.com
Contact(+65)68189232
Contact: (+65) 68189233 / 65249115
Office Address:21 (Suite 31),16 Collyer Quay,Singapore 04931
For Singapore
Motilal Oswal Securities Ltd
29 May 2014
Motilal Oswal Tower, Level 9, Sayani Road, Prabhadevi, Mumbai 400 025
Phone: +91 22 3982 5500 E-mail: reports@motilaloswal.com
12