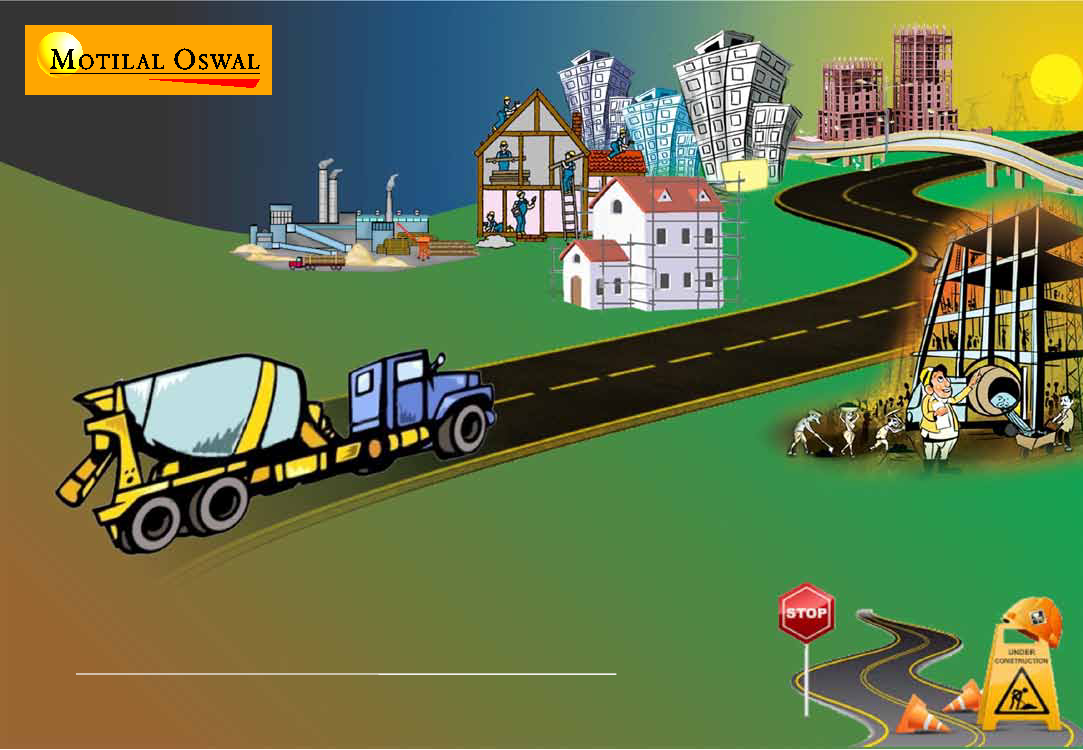
Recovery in ‘site’
Jinesh Gandhi
(Jinesh@MotilalOswal.com); + 9122 3982 5416
Sandipan Pal
(Sandipan.Pal@MotilalOswal.com); + 9122 3982 5436
Investors are advised
| May 2014
Sector Update: Cement
to refer through disclosures made at the end of the Research Report.

Content: Recovery in ‘site’
Executive Summary………….………………………………………………………………………………………………………………………………………………………………3-6
Demand on the cusp of bottoming out………….….……………………………………………..……………………………………………………………………………..7-9
Back tracing demand framework……….…………………………………………………………………..…………………………………………………………………….10-11
Key demand drivers………..…………………………………………………………………………………..……………………………………………………………………….12-20
Dynamics on supply side turning favorable………..……………………………………………………………………..…………………………………………………21-24
Competitive intensity subsiding, as Big got bigger……..……………………………………………………………………..…………………………………………25-28
Regional preferences………………..………………………………………………………………………………………………………………………………………………….29-30
Improving outlook + rising entry barriers = premium valuations
..
……………………..……………………………………….………………………………31-39
ANNEXURES
……………………………………………………………………………………………………………………………………………………………………………..…40-43
Companies (Large-cap)
ACC
……………………...……………………………….………………………………………………….………………….....
45-50
Ambuja Cements
……….…………..……………………………………………………………………………………………………….……………………….....51-55
UltraTech
…………………………..……………………………………….………………………………………………………...........................................56-60
Shree Cement
……………………………………………….……………………………………………………………………………………………….…………….61-66
Companies (Mid-cap)
Birla Corp
……………………………………………………………………………………………………………………………………………….……….….……….67-71
Dalmia Bharat
……..………………………………………………………………………………………………………………………………..………….…….…..72-77
India Cements
………………………………………………………………………………………………………………………………………...………………..….78-82
JK Cement
………………………………………………………………………………………………..……………………………………………..……………….….83-87
JK Lakshmi Cement
……………………………………………………………………………………..………………………………………….…………….…….88-92
Orient Cement
…………………………………………………………………………………………………………………………………………….………….…..93-97
Prism Cement
…………………………………………………………………………………………….…………………………………………………….….…...98-103
The Ramco Cements………………………………………………………………………………………………………………………………………….……..104-108
Sources for Exhibits: CMA, Planning Commission, JLL, Prop Equity, Industry, Company
Sector Update: Cement | May 2014

Recovery in ‘site’
Confluence of demand recovery, slowing capacity add & consolidation
Demand revival could be faster, especially with enabling government
Cement demand in India has seen the worst run in the last two decades (4.2% CAGR over FY10-14), driven by slowdown in
economic activities. We believe the industry is near trough and poised for strong recovery led by promising government,
improvement in economic outlook, investment cycle recovery and creation of new state from Andhra Pradesh (AP) boosting
southern region from prevailing weakness. We estimate demand CAGR of 8% (FY14-17E) in base case, with possible upside
risk of (1) faster than estimated recovery in investment cycle, and (2) cement growth strongly outperforming GDP growth
like previous up-cycles (GDP multiplier of 1.25-1.5x during recovery phase), especially on the back of large pent-up demand.
…while supplies clearly slowing down, making ground for return of pricing power
Rise in entry barriers (higher gestation period, capex/opex cost, land/limestone availability) and non-remunerative pricing
for setting up new plants have created visibility of tapering of the supply pipeline over FY16-18 (~38mt of over FY15E-17E
v/s 72mt over FY12-14). Return of pricing power is gaining optimism also from instances of industry consolidation (share of
top-5 players at ~52% currently v/s ~48% in previous downcycle). Resolution of long-drawn Telengana crisis and creation of
new states from AP should aid new demand driver and pricing levers in otherwise muted south India market (~25% demand
de-growth in AP over FY10-14). We estimate cement price increase of ~INR12.5/12.5/15 per bag for FY15/16/17.
Industry managed down-cycle well, anticipate a stronger up-cycle
Key industry players have managed the downturn very well as: a) downcycle RoEs of 10-14% resembles mid-cycle strength
despite industry utilizations being at multi-decade low and b) have either grown bigger in scale and/or improved cost
structure and balance sheet. As a result, key players are well placed to enjoy greater benefits of volume up-cycle. We
believe industry utilization is understated by 8-10pp due to rising proportion of split grinding expansion. Therefore, pricing
power should return at 75-80% utilization unlike the empirically observed 80-85%. We estimate EBITDA/ton
at~INR815/960/1,145 by FY15/16/17 from ~INR665 as of FY14, translating into ~10pp RoE improvement to ~22% by FY17.
We note that despite good improvement by FY17, profitability and RoE would be ~10pp/18pp below peak levels of FY07-08.
Sector Update: Cement | May 2014
3

Recovery in ‘site’
Confluence of demand recovery, slowing capacity add & consolidation
Improving outlook + rising entry barriers = premium valuations
Earnings growth of MOSL cement universe has been flat-to-negative over FY11-14. We expect FY15 to be the first year of
recovery, which along with stronger pricing and demand should result in EPS CAGR of ~38% over FY14-17E. Recovery is
demand remains the key driver for broad-based momentum in operating performance and stock returns. Companies with
headroom to grow volumes at least in-line with the industry, better market mix and cost saving triggers would see a
stronger uptick. Although earning valuations looks stretched on near bottom of the cycle performance, asset valuations are
still attractive considering rising entry barriers during impending up-cycle. We note cement companies have traded ~2x
premium to replacement cost during FY07-08 upturn. From our coverage universe, we prefer
ACC, UTCEM
(upgraded to
Buy) and
SRCM
among large caps, and
DBEL, JKCE, JKLC
and
PRSC
among midcaps.
Cement: Valuation summary
Reco
ACC
Ambuja
Ul tra tech
Shree Cement
LARGE CAP
Bi rl a Corp
Da l mi a Bha ra t Ent.
Indi a Cements
JK Cement
JK La ks hmi Cement
Ma dra s Cement
Ori ent Cement
Pri s m Cement
MID CAPS
AGGREGATE
* EV a dj for CWIP
Buy
Neutra l
Buy
Buy
Buy
Buy
Neutra l
Buy
Buy
Buy
Neutra l
Buy
Mcap
(USD b)
4.2
5.4
10.5
4.0
0.5
0.5
0.5
0.4
0.3
1.0
0.3
0.5
CMP
INR
1,331
208
2,264
6,822
347
347
93
336
175
260
77
54
EV/EBITDA (x) *
Target price Upside
PE (x)
(FY16)
(%)
FY14E FY15E FY16E FY17E FY14E FY15E FY16E
1,815
36
27.5
22.0
16.8
12.8
15.7
12.5
9.8
246
18
30.8
23.3
20.1
15.7
17.6
14.3
11.5
2,873
27
30.0
23.9
18.9
14.4
16.2
12.8
10.3
8,034
18
24.8
21.0
15.8
12.0
15.9
12.5
9.5
28.6
23.1
18.4
14.1
16.4
13.0
10.5
486
40
20.6
9.6
7.5
5.2
8.9
4.6
3.4
538
55
-335.9 -48.3 17.0
5.4
14.1
11.7
7.0
106
13
-11.8 24.3
11.4
6.7
10.4
7.9
6.0
469
40
31.4
17.8
9.1
5.5
8.5
8.2
5.5
262
50
19.1
15.3
14.2
7.2
7.9
8.1
5.8
326
25
52.9
31.0
19.4
12.4
17.3
12.8
9.8
88
14
15.6
12.2
17.3
8.2
7.5
6.2
8.5
74
37
-16.4 273.3 10.8
6.2
37.5
10.8
5.5
206.5 24.7
12.7
7.0
12.6
9.2
6.5
32.5
23.3
17.3
12.4
15.4
11.9
9.2
EV/Ton (USD) at CMP *
FY17E FY14E FY15E FY16E FY17E
6.9
119
110
105
105
8.7
161
158
153
153
7.4
167
169
163
163
6.8
187
165
156
156
7.6
159
155
150
150
1.9
34
32
31
31
4.6
66
72
68
68
4.5
68
70
66
66
3.6
56
73
69
69
4.0
76
64
57
57
7.2
103
97
93
93
5.4
52
55
65
65
3.8
121
105
71
71
4.5
74
74
70
70
6.6
129
124
119
119
EV/Ton
at TP
150
160
200
190
50
84
70
82
75
110
70
94
Sector Update: Cement | May 2014
4

Confluence of demand recovery, slowing capacity add & consolidation
FY17 EV/EBITDA sensitivity to cement price change (INR/Ton)
Price Chg
(INR/Ton)
0
100
200
300
400
500
600
ACC
10.2
8.9
7.8
6.9
6.2
5.6
5.1
ACEM
12.1
10.7
9.6
8.7
8.0
7.3
6.8
UTCEM
9.6
8.7
8.0
7.4
6.8
6.3
5.9
SRCM
8.9
8.1
7.4
6.8
6.3
5.9
5.5
BCORP
3.5
2.8
2.3
1.9
1.6
1.3
1.2
DBEL
6.9
6.1
5.5
5.0
4.6
4.2
3.8
ICEM
7.2
6.1
5.2
4.6
4.0
3.6
3.2
JKCE
4.7
4.3
4.0
3.6
3.4
3.1
2.9
JKLC
6.0
5.2
4.5
4.0
3.5
3.2
2.9
ORCMNT
8.3
7.1
6.2
5.4
4.9
4.4
4.0
PRSC
5.0
4.5
4.1
3.8
3.5
3.3
3.0
TRCL
10.7
9.2
8.1
7.2
6.4
5.8
5.3
FY17 Target Price sensitivity to cement price change (INR/Sh)
Price Chg
(INR/Ton)
0
100
200
300
400
500
600
ACC
1,503
1,675
1,848
2,020
2,192
2,365
2,537
ACEM
229
242
256
269
283
296
310
UTCEM
2,384
2,598
2,812
3,026
3,240
3,454
3,668
SRCM
6,988
7,555
8,122
8,689
9,256
9,823
10,390
BCORP
371
425
479
533
587
641
695
DBEL
391
476
561
646
731
816
901
ICEM
42
68
94
120
146
171
197
JKCE
408
470
531
593
654
716
777
JKLC
164
204
244
284
324
364
403
ORCMNT
38
57
76
94
113
132
151
PRSC
67
74
82
89
97
104
112
TRCL
212
259
306
353
401
448
495
Sector Update: Cement | May 2014
5

Near trough: Demand recovery key to re-rating
Urban housing and
commercial capex near
trough
Rising rural income, shift to
Pucca house to Sustain steady
growth
2
3
Stable governance key to
investment cycle
1
DEMAND
RECOVERY IN
SIGHT
4
Additional impetus: DFCC, new
state creation, political thrust
Utilization to bottom out in FY15,
with ID-IS breakeven in FY16
1
Can brownfield supply
surprise negatively?
SUPPLY
SLOWING
DOWN
3
Rising entry
barriers
STRONGER
UPCYCLE IN
MAKING
5
North, east and central to see
better pricing power
Getting Bigger v/s
Getting Better
Entry of non-traditional
players
COMPETITIVE
INTENSITY
SUBSIDING
1
2
4
2
3
Rising consolidation
Large players gained
significant B/S strengths
Sector Update: Cement | May 2014
6

2
3
1
DEMAND
RECOVERY IN
SIGHT
4
Demand on cusp of bottoming out
Lag in recovery to be shorter, given pent-up demand and enabling governance
5
1
4
2
3
1
2
3
§
Worst run for cement demand in the last two decades, with 4.2% CAGR over FY10-14.
§
Cement demand typically lags GDP growth by 1.5-2 years. Yet, recovery could be faster this time due to high pent-up
§
§
demand in the system.
If stable governance and improving fundamental factors start acting in congruence, normalized cement demand growth
of 1.25x GDP could be achieved over FY14-16.
Back tracing the key drivers’ trends suggest a potential of ~8% CAGR over FY14-17E.
Ex 1: Demand showing weakest run of past two decades
Volume Growth (%)
Worst period of dement growth in last 2 decades
§
Cement demand has witnessed the worst run in two
decades over the last four years. Demand CAGR over
FY10-14 plunged to 4.2% against ~10% over FY06-10
(exhibit-1).
The current period of weak demand is also the longest
compared to earlier down-cycles of FY93, FY01, or FY04-
05.
The period was also adversely impacted by
commencement of large number of new capacities
(108m tons over FY11-14, implying 10% CAGR)
announced in FY06-09.
As a result, the effective capacity utilization is at a 25-
year low of 69-70%.
CAGR 5.9%
CAGR 10%
CAGR 4.2%
§
§
§
Sector Update: Cement | May 2014
7

2
3
1
DEMAND
RECOVERY IN
SIGHT
4
Prevailing trends: Southern slowdown, weak GFCF
Southern overhang
Ex 2: Regional break-up of demand growth (%)
FY00-05
13.7
11.4
7.5
8.5
4.8
5.2
1.0
North
South
East
West
7.7
11.3 10.9
9.5
7.5
4.4
5.3
9.4
6.4
3.2
FY05-08
FY08-10
5
1
4
2
3
1
2
3
§
The South India market, the largest by volume share,
§
FY12-14
10.7
7.0
has been the key deterrent in industry demand growth
(Exhibit 2).
Political turmoil in Andhra Pradesh, coupled with
challenges in power supply in key southern states led to
a sharp fall in cement growth (1% CAGR over FY10-14
v/s ~9% CAGR over FY06-10) in the region, which
accounts for 27-30% of cement volume.
5.2
Central
Subdued GDP growth, weakened multiplier
§
Industrial GDP growth tapered significantly to 1-2%,
§
§
worse than overall GDP growth of 4-4.5% over FY13-14.
Historically, the cement GDP multiplier (x) has shown
strong correlation with change in gross fixed capital
formation (GFCF) in construction (Exhibit 3).
Sectoral demand was hit by a double whammy of lower
GDP growth and reduction in multiplier.
Ex 3: Strong correlation between “change in GFCF (construction, ex
machinery) as percentage of GDP” and cement demand elasticity
375
250
125
0
-125
Change in GFCF (Const)/GDP (bps)
Multiplier (x)
Trend line for GDP multiplier
2.4
1.6
0.8
0.0
-0.8
Sector Update: Cement | May 2014
8

2
3
1
DEMAND
RECOVERY IN
SIGHT
4
We anticipate a faster recovery with lower lag effect
A mid-to-late recovery cycle
§
The lag effect based on correlation between GDP and
Ex 4: Trend in cement demand and GDP growth (TTM)
14.0%
10.5%
7.0%
3.5%
0.0%
GDP Growth (%)
Cement Volume (%)
5
1
4
2
3
1
2
3
12.0%
9.0%
6.0%
3.0%
0.0%
§
§
cement demand growth is, empirically, not a very strong
number in the longer term (since FY02; Exhibit 4).
However, for the last 6-7 years, there is moderate
correlation (statistical correlation coefficient of 0.55)
between the two, with a lag of 15-18 months for cement
demand.
Cement being a project-based derived commodity, it would
take time for demand recovery, as decision making and the
approval process takes time.
Ex 5: Trend in GDP multiplier (x)
GDP (%)
2.2
1.2
2.0
1.0
1.7
-0.1
2.1
0.7
1.0
GDP Multiplier (x)
1.4
1.0 0.9 1.2 1.2
Recovery could be faster this time
§
Outstanding order book is already at all-time high, with
1.2 1.5 1.1
0.1
0.6
1.0
0.5 0.5
§
huge execution backlog (Exhibit 6).
It would be less dependent on the decision making phase
and recovery should happen earlier than expected once
comfort on liquidity and demand uptick drive execution.
Ex 6: Lowest project completion, all-time high backlog hinting strong
pent-up demand
18
12
6
0
-6
Cement demand (%)
Completion as % of Outstanding 160
120
80
40
0
Demand multiplier may show amplified reaction
§
Cement demand elasticity (GDP multiplier) had shown
§
considerable volatility, with instances of massive over-
contraction / expansion (Exhibit 5).
Strong pent-up demand may lead to amplified effect when
macros turn favorable.
9
Sector Update: Cement | May 2014

2
3
1
DEMAND
RECOVERY IN
SIGHT
4
Back tracing ‘demand framework’
Proxies taken in back tracing
5
1
4
2
3
1
2
3
(1) Rural housing:
Agri-GDP, rural wage growth trend, CAGR in ‘pucca’ and ‘semi-pucca’ house stock, and India Awas Yojana
(IAY)
(2) Urban housing:
(a) Pre sales data (prop equity), and (b) likely construction schedule.
(3) Commercial capex:
JLL data on office space, retail supply and assumed construction schedule.
(4) Infrastructure and industrial capex:
GFCF in infrastructure, ex-household GFCF, etc.
Exhibit 7: Key demand drivers and hindsight estimate on growth trend
Infra
17%
Industrial
8%
Rural
Housing
40%
Rural Housing
Urban Housing
15
5.4
Infra + Industrial
Commercial capex
10.0
3.9
12.7 11.8
7
4.6
4.7
Comm RE
10%
-1.0
Urban
Housing
25%
-4.4
FY06-09
FY09-12
FY12-14
-3.3
Growth to normalize to at least 8% over FY14-17
§
Back-tracing cement demand growth drivers suggests that during FY12-14, demand was only driven by rural housing.
§
There has been significant deceleration in organized housing and infrastructure/industrial investment. Execution of
§
commercial projects (office space and retail malls) has also slowed down.
Based on this framework, we expect demand to resume 7.5-8% CAGR over FY14-17 (Exhibit 8).
10
Sector Update: Cement | May 2014

2
3
1
DEMAND
RECOVERY IN
SIGHT
4
Revival likely in FY15 with ~6% growth and normalization to 7.5%+ in FY14-17
Ex 8: Understanding the contribution and growth trends of major cement consuming sectors
5
1
4
2
3
1
2
3
FY06-FY09
Key demand driving segments
Demand
CAGR (%) mix (%)
FY09-FY12
Demand
CAGR (%) mix (%)
FY12-FY14
CAGR
(%)
Demand
mix (%)
FY14-FY17E
CAGR
(%)
Demand
mix (%)
Rural Housing
Agri GDP
Rural Wage Growth (Real)
IAY
Housing stock
Pucca
Semi Pucca
Urban Housing
Infrastructure + Industrial
Infrastructure
Industrial
Commercial capex
Overall Estimated Demand
Actual cement demand
Variance
3.9
3.8
-2.0
8.8
4.0
4.0
2.6
10.0
12.7
4.6
16.9
11.8
9.6
9.7
-2%
25
30
31
20
11
14
100
5.4
4.8
7.9
5.0
4.0
4.0
2.6
15
7
3.7
13.0
-4.4
7.5
7.4
2%
35
30
24
16
8
11
100
4.6
2.6
6.9
0.0
4.0
4.0
2.6
4.7
-1.0
40
5.5
40
-3.3
2.5
2.5
-1%
25
25
15
10
10
100
8.0
10.0
10.0
10.0
8.0
7.5
25
25
15
10
10
100
Sector Update: Cement | May 2014
11

2
3
1
DEMAND
RECOVERY IN
SIGHT
4
Rural housing: Rising income, shift to pucca house to sustain steady growth
§
§
§
§
§
§
Rural housing accounts for 40% of overall cement consumption (v/s 25-30% pre-FY09).
Cement usage has increased, with 4-5% CAGR in ‘pucca’ house construction v/s 2-2.2% CAGR in overall housing stock.
Acceleration in rural income growth post FY09 (real wage growth of 7-8% since FY09 v/s negative before then).
Allocation to various government schemes like IAY and NREGA has improved meaningfully under XIIth five-year plan.
Rural GPD has recorded steadier trend in the recent past and is less dependent on monsoon.
We expect further acceleration in rural cement demand, with the above factors contributing 5-6pp.
Exhibit 9: 10-year CAGR of various housing categories
4.0
3.9
3.0
2.6
5
1
4
2
3
1
2
3
DRIVER 1: Proportion of ‘pucca’ houses
§
Continues to rise on the back of growing rural income
§
(driving self-funded house construction) and growing
spending under various schemes like India Awas Yojana
(IAY).
Exhibit 9 suggests that growth in ‘pucca’ houses has been
healthy over the past decade and should accelerate further,
with greater conversion to brick and cement structures
(Exhibit 10, 11), resulting in higher cement consumption.
2.1
Pucca House Roof material Floor material
as Cement
as Cement
Semi Pucca
House
-5.1
Housing stock Kutcha House
Exhibit 10: Greater shift towards concrete usage in roofs
Grass/Bamboo
13.2
10.8
8.6
36.1
31.3
FY91
Tiles
Metal/ Asbestos sheets
14.1
19.8
11.6
32.6
21.9
FY01
Concrete
16.3
29
15.9
23.8
15
FY11
Others
Exhibit 11: Greater shift towards brick structure for walls
Grass/ Thatch/Bamboo, etc
3.9
34.2
10.1
41.5
10.3
FY91
Mud/ Un-burnt bricks
4.5
43.7
9.4
32.2
10.2
FY01
Stone
Burnt brick
5.7
47.5
14.2
23.7
9
FY11
Others
Sector Update: Cement | May 2014
12

2
3
1
DEMAND
RECOVERY IN
SIGHT
4
Rural housing: IAY gives cushion
Ex 12: Trend in rural wage growth
Wage (INR/day)
280
210
140
70
0
Real growth (%)
15.0
10.0
5.0
0.0
-5.0
5
1
4
2
3
1
2
3
DRIVER 2: Rural wage growth
§
According to NSSO data, rural wages have increased
§
Ex 13: Targeted and actual house construction (IAY)
Target
Actual
meaningfully since FY09 and are sustaining well. The real
wage CAGR has been 7-8% FY09 onwards (nominal
growth of 17%) v/s negative growth (nominal growth of
5%) before then (Exhibit 12).
Increasing road connectivity, mobile penetration and
electrification have been major drivers, with further
potential over the next five years, as work achieved
under various programs is far from target.
DRIVER 3: Indira Awas Yojana (IAY)
§
Though a secondary contributor (~10% of rural house
§
Ex 14: Significant increase IAY allocation under XII 5-years plan
1349
§
§
VII
VIII
IX
X
XI
571
XII
8
1985-90
39
1992-97
97
1997-02
160
construction), IAY has seen strong growth in capital
allocation.
In FY14, allocation per household under IAY increased
50%+ to INR75,000 (v/s INR45,000 earlier).
Allocation to IAY has seen strong uptick under the XIIth
five-year plan.
The government has consumed the budget allocation
fully in the past, barring some drop (<80%) in FY13. We
expect IAY to remain an important driver. (Exhibit 13,
14).
2002-07
2007-12
2012-17
Sector Update: Cement | May 2014
13

2
3
1
DEMAND
RECOVERY IN
SIGHT
4
Organized real estate: Urban housing, commercial capex near trough
§
§
§
§
§
§
5
1
4
2
3
1
2
3
Urban housing and commercial real estate (office and retail) together account for 30-35% of cement consumption.
Estimated construction activities have slowed down from 10-15% in up-cycle of FY05-08 to negative-5% in recent times.
Key challenges: weak housing demand, slowdown in corporate expansion, severe liquidity pressure.
High construction backlog; huge potential for revival in cement demand, once sentiment improves.
Increasing visibility of corporate expansion plans and PE activity, and stabilization of vacancy rates are indicative of a fresh capex
cycle in commercial real estate.
We expect organized real estate to contribute 8pp to cement growth over FY14-17 (v/s negative 4pp during FY12-14 and 10-15pp
over FY06-09).
Housing sector demand slowdown, stressed liquidity
§
Organized housing witnessed steep de-growth in absorption rate and in-turn resulted in a massive rise in unsold
§
inventory (Exhibit 15) across markets.
On slowdown in operating momentum, real estate developers, grappling with high leverage and strained liquidity after
the global financial crisis of FY08, failed to achieve stable cash flows (Exhibit 16).
Ex 16: Weakness in operating cash flow and high financial leverage
Ex 15: Sharp decline housing absorption and massive rise in inventory impacted liquidity of real estate developers
Total Absorption and Unsold Inventory Trend
Total Absorption (Units)
Unsold Stock (Units) RHS
180,000
140,000
100,000
60,000
20,000
900,000
750,000
600,000
450,000
300,000
-180
-180
-43
-65
OCF - INT (INR b)
9
35
-12
27
-18
Sector Update: Cement | May 2014
14

2
3
1
DEMAND
RECOVERY IN
SIGHT
4
Organized real estate: Urban housing and commercial capex near trough
Ex 17: Meaningful delay in construction progress
5
1
4
2
3
1
2
3
Construction delays; piling backlog
§
Weakness in housing demand and cash flow pressure led to
§
§
significant slowdown in construction activity.
High proportion of projects launched over FY09-12 have
been witnessing major delays (Exhibit 17).
Pent-up execution work is high. Improvement in demand,
and in turn, liquidity for developers should unshackle the
execution backlog.
Ex 18: Vacancy rate and estimated construction in office space
Work Commencement (msf)
46
42
38
34
30
CY05
CY06
CY07
CY08
CY09
CY10
CY11
CY12
CY13
Vacancy rate (%)
20
15
10
5
0
Corporate expansion plans
§
Macro uncertainty led to a rise in vacancy levels in the
§
§
§
Ex 19: Growth in headcount in top five IT majors
23.7
20.4
14.3
13.5
9.8
6.1
17.8
14.4
12.8
commercial segment.
Liquidity crunch for developers slowed construction plans in
the commercial vertical in the last 2-3 years.
Macro improvement and stable governance should lead to
demand uptick in office/retail space and rise in PE
investments.
Vacancy rates have stabilized, with a hint of gradual
upswing. This points to a revival in the investment cycle
(Exhibit 16).
IT hiring to improve
§
After a lull in FY13-14, hiring growth for Indian IT majors is
§
FY08
FY09
FY10
FY11E
FY12
FY13
FY14
FY15E
FY16E
likely to accelerate on meaningful uptick in utilization
(Exhibit 19).
This could be a positive sign for construction activity in the
office space, as IT/ITES accounts for most of the demand in
this space.
Sector Update: Cement | May 2014
15

2
3
1
DEMAND
RECOVERY IN
SIGHT
4
Infrastructure and industrial capex: Stable governance to be key catalyst
5
1
4
2
3
1
2
3
§
Infra investment and industrial capex were materially impacted by policy logjam and economic slowdown during FY11-14.
§
With a stable new government in sight and all-time high order backlog, the pace of execution should pick up from 2HFY15.
§
Recovery in the investment cycle would be a big driver for cement demand. With the infrastructure and industrial segments
accounting for ~30% of cement consumption, we expect these segments to contribute 10pp to cement demand growth over
FY14-17 (v/s negative contribution over FY12-14 and 10pp+ contribution over FY06-09).
Ex 20: Private investment has turned negative, impacted by
decade-low corporate profit to GDP ratio
Pvt Projects addition (INR t)
22
16
9
3
-4
Corporate profit/GDP (%)
trigger line
Highest ever order backlog
§
Projects completed have been below 2% of TTM
outstanding projects (v/s 5-6% during FY05-09), while
projects dropped have risen significantly to 8%+ v/s 4-
4.5% over FY05-09 (Exhibit 13). This is due to
constrained economic viability, regulatory hurdles and a
virtuous cycle of cash flow generation in the system.
Domestic investment cycle
§
Domestic project investments have declined materially
Ex 21: Significant rise in percentage of projects dropped
9.9
7.9
5.3
6.4
4.8
4.2
5.0
3.6
4.7
4.4
3.4
6.0
9.6
8.1
§
in the last 6-8 quarters, initially impacted by policy
logjams and eventually accentuated by demand
slowdown, percolating into extreme lethargy in decision
making for new capex.
However, with a stable new government in sight and all-
time high order backlog, the pace of execution should
pick up considerably from 2HFY15.
16
Sector Update: Cement | May 2014

2
3
1
DEMAND
RECOVERY IN
SIGHT
4
Driver # 1: Creation of Telengana to support demand recovery
Ex 22: YoY growth in cement demand in separating states (combined, %)
FY99
FY00
20
10
-1
0
13
5
6
8
-2
BIHAR + JHK
UTKND + UP
11
8
FY01
FY02
FY03
31
5
1
4
2
3
1
2
3
§
Empirical evidence indicates strong pick-up in regional
§
§
§
§
10 11
16
CHTSH + MP
Ex 23: Trend in cement demand and growth in AP
AP demand (mt)
34
10
20
8
21
-24
15
15
3
7
12
14
Growth (%)
22
-1
-1
-12 -11
-2
cement demand following the creation of a new state.
This was seen in 2000-01 when Chattisgarh was created
from Madhya Pradesh and Uttarakhand was created
from Uttar Pradesh.
We expect similar spurt in cement demand in Andhra
Pradesh (AP), with the creation of Telengana and a new
state capital.
AP’s contribution in the South India demand has
declined from ~30% to ~24% post -6.5% de-growth
CAGR during FY10-14.
Pent-up demand due to multiple years of de-growth
and development work in Telengana should drive strong
growth in AP, benefiting southern players in particular.
Ex 25: Cement companies with exposure to AP (%)
Ex 24: Demand contribution of AP in overall southern dispatches (FY12, %)
Capacity mix
Kerala
16%
AP
24%
Dispatch mix
100
47
KNT
25%
TN
35%
60
18
26
24
50
43
9
13 13
12
Sector Update: Cement | May 2014
17

2
3
1
DEMAND
RECOVERY IN
SIGHT
4
Driver # 2: Dedicated Freight Corridor – execution on track…
Ex 26: Eastern and Western Dedicated Freight Corridors
Ex 27: Project phasing and completion timeline
5
1
4
2
3
1
2
3
§
Ex 28: Cement demand got boost from Golden Quadrilateral
project under NDA government
Completion (Kms)
9.6
Leading Cement Growth (%)
13.2
8.5
5.5
9.4
6.8
8.2
§
Implementation of the Eastern and Western
Dedicated Freight
Corridors (DFCs)
over CY14-19 should provide an additional
thrust to cement demand in underlying states.
Civil works have already been awarded for ~40% of the stretch in
Gujarat (Western Corridor), West-UP and Bihar (Eastern Corridor).
The balance route is in various stages of execution.
Golden Quadrilateral project under NDA
§
§
Historically, mega infrastructure projects have considerably
benefited cement consumption during execution period.
Golden quadrilateral project (2001-2012, but ~90% completed by
FY06) which comprised connecting 4 metros through 4/6-lane
national highway network of total length of 5,846km had drove
almost 10-12MT of incremental cement consumption during
execution period aiding 2-3% additional annual growth.
139
FY01
420
FY02
264
FY03
1,285
FY04
2,085
FY05
581
FY06
278
FY07
Sector Update: Cement | May 2014
18

2
3
1
DEMAND
RECOVERY IN
SIGHT
4
…providing additional demand trigger
Ex 29: Estimating potential cement consumption by DFCC
Cost Break-up
Civil Work (A)
Electrical
Signaling
Insurance
IDC
Price contingencies
Physical contingencies (B)
Working capital
Others
Total
Total civil work expenditure (A + B)
Assuming cement usage of 25-30% in construction…
…Spend on cement (INR b)
Assuming cement price of INR270/bag…
Estimated Cement volume (mt)
% of national annual demand
% of total
50
12
9
5
12
6
4
1
1
100
53
INR b
396
94
72
43
95
49
31
11
10
800
427
115
21
1.6
5
1
4
2
3
1
2
3
§
In Exhibit 29, we present our estimates of potential cement
§
§
§
consumption (~21m tons) by the DFC project over the next 5-
6 years.
Our calculations are based on the budgeted project cost
(~INR800b) and likely cost structure (as estimated by World
Bank).
The DFC project is cement intensive, given the requirement of
concrete sleepers, connecting bridges, supporting
infrastructure, etc. We expect this project to add 1.5% to
annual cement demand growth.
Central India (UP, MP) should witness the strongest
consumption drive (2.5-3%), followed by North India
(Rajasthan, Haryana), West India (Gujarat) and East India
(WB/Bihar/Jharkhand).
PUN
3%
Ex 31: States through which Eastern and Western Freight Corridors pass
WB/JHK
16%
Bihar
3%
HAR
8%
RAJ
17%
Ex 30: Project financing been tied up from multiple sources
Source
Equity
Debt
INR b
200
200
150
120
130
800
Remarks
Ministry of Railways
JICA for Western Corridor
World Bank for eastern Corridor
IRFC - Tax free bonds and Indian Banks
Dankuni - Sonnagar (550 Kms) -PPP
UP
31%
MH, 4%
PPP
Total
Gujarat
18%
§
Typically, cost efficient companies with high economies of scale derive greater benefits from such mega projects in terms of
volumes. Given the large volumes involved, executors of such projects negotiate very hard and smaller companies with higher
cost of production find it difficult to compete on price.
19
Sector Update: Cement | May 2014

2
3
1
DEMAND
RECOVERY IN
SIGHT
4
Driver # 3: Election manifesto conveys high promises on infrastructure
Segment
Industrial corridors / new cities
5
1
4
2
3
1
2
3
Focus area
Initiate building 100 new cities; Building on concepts like Twin cities and Satellite towns. Remote states like those in the
Northeast and Jammu and Kashmir will be connected with the rest of India through world class highways and rail lines
Build quality integrated Public Transport systems; National Highway construction projects will be expedited, especially
Border and Coastal highways; Every village will be connected through all-weather roads
Work on the Freight Corridors and attendant Industrial Corridors will be expedited
Mid income housing, low cost housing, urban upliftment, pucca; encourage overall housing sector through appropriate
policy intervention, credit and interest subvention scheme
Agri Rail network, Tourist Rail, Railways Modernization; Diamond Quadrilateral project - of High Speed Train network
(bullet train).
Modernize existing and operational Airports, and build new ones especially connecting smaller towns and all tourism
circuits
Sagar Mala Project: An economic model of Port-led development
Increase irrigated land by completing the long pending irrigation projects on priority. Inter-linking of rivers based on
feasibility
Transit system, highways
Freight corridors
Housing
Railways
Airport
Port
Irrigation/ inter-linking of rivers
§
The newly elected NDA’s election manifesto focuses on development. Considering the infrastructure segment’s muted
contribution to growth in cement demand since FY10, an impetus to infrastructure would drive up cement
consumption significantly.
Sector Update: Cement | May 2014
20

2
3
1
4
Dynamics on supply side gradually turning favorable
Visibility of return of pricing power over FY16-17
§
Utilization to bottom out in FY15, with ID-IS breakeven in FY16
§
Rising entry barriers, non-remunerative cement pricing
§
Can brownfield announcement surprise negatively?
Announced capacity decelerating
§
Expect capacity addition to decelerate, with effective
5
1
SUPPLY
SLOWING
DOWN
2
4
2
3
1
3
Ex 32: Trend in effective capacity addition (8% demand growth
assumed in FY15-17)
Effective Cap. addition (MT)
18.9
13.7
4.5
5.2
5.4
6.6
5.9
2.6
7.7
3.8
5.2
15.6 15.7
10.8
9.2
8.7
11.6
7.1
% of demand
§
cement capacity growing at a CAGR of 6% over FY14-17
against ~10% over FY10-14.
Capacity addition in key regions of South (12m tons over
FY14-17 v/s 25m tons over FY10-14) and North India (15m
tons over FY14-17 v/s 42m tons over FY10-14) is slowing
down, pointing to a return of pricing power.
2.4
8.1 23.2 28.8 32.0 40.2 24.5 21.5 20.8 29.4 19.2 7.1
ID-IS breakeven in FY16
§
Even if improvement in demand outlook starts driving the
expansion cycle, with capacity additions being announced
from FY15, these are unlikely to commence before FY18.
Gestation period could be longer for greenfield plants.
Upside risk to supply estimates is limited till FY17.
Incremental demand is likely to be equal to incremental
supply by FY16.
Higher than estimated demand growth (of 8%) would drive
up utilization and pricing power faster.
Ex 33: Trend in ‘incremental demand – incremental supply’ and
utilization
DD - SS
30
15
0
-15
-30
-45
94
89
85
89 90 91
97
101 99
92
84
75 74
71
68 67 69
73
Utilization (%)
§
§
§
Sector Update: Cement | May 2014
21

2
3
1
4
Rising entry barriers – higher set-up cost, gestation period
Greater downside risks to supply figures
5
1
SUPPLY
SLOWING
DOWN
2
4
2
3
1
3
Ex 34: Capacity addition slowing down, with more deferrals expected
Capacity CAGR
FY09-13: 12.1%
FY13-16: 6.6%
8
319
4 10
0
2 11
4
0 6
3
8
3
4 4 3
§
Execution delays and cash flow pressure that smaller
§
§
players are facing might lead to further deferrals in
capacity additions.
This implies upside risk to utilization levels.
Also, MoEF data on approval of new capacities indicates
significant slowdown with just ~2 approvals since CY12.
20
1
6 2
304
7
409
341
378
395
Increase in set-up costs
§
Based on our interactions with various equipment
suppliers and cement companies, the cost of putting up
new capacity is as follows:
1. Greenfield: USD130-150/ton
2. Brownfield (new line): USD90-110/ton
3. Brownfield (upgradation): USD75-85/ton
Ex 35: Trend in replacement cost based on our interaction with
various channel partners at various points of time
Replacement cost (USD/Ton)
170
140
110
80
§
Sharp decline in the order book for equipment
manufacturers has resulted in shift of bargaining power
to cement players. However, this benefit would be
diluted by higher land prices for greenfield plants.
50
Sector Update: Cement | May 2014
22

2
3
1
4
Rising entry barrier, higher gestation period continues…
Ex 36: Comparison of land cost under LARR bill
Land requirement
Prevailing market rate
Multiplier for land acquisition
Solatium
(on
Rate
+
Multiplier)
Cost of Land acquisition (a)
Basic R&R Cost (b)
Total : Land + R&R (a) + (b)
Increase (%)
Acres
INR m/acre
Of market rate
Of acquisition cost
INR m/acre
INR m/acre
INR M
LA Act (1894)
100
1
Nil
30%
1.3
0.1
140
LARR (2011)
100
1
2x
100%
4
2
600
4.3 x
5
<6
Avg
6mths
Avg
12mths
6 6
4
2
1
4
6-12
12-18
Avg
18mths
6 6
4
2
2
2
18-24
>24
Avg
24mths
8
5
1
SUPPLY
SLOWING
DOWN
2
4
2
3
1
3
Ex 37: Time taken for MoEF approval (months): Most projects taking
over 18 months to receive approval
Avg
15mths
7
6
5
Avg
24mths
1 1
2007
2008
2009
2010
2011
2012
2013
Ex 38: MoEF data suggests drastic reduction in number of projects cleared
Introduction of Land Acquisition Bill (LARR) – the
new hurdle
Capacity cleared (MTPA)
18
16
12
60.3
41.1
24.3
2007
2008
2009
21.6
2010
16
MoEF Approval received (no)
§
LARR could inflate land cost by 3-4x. Land accounts for
§
§
10-15% of total project cost in case of a greenfield plant.
This could augment project set-up cost by 25-30%.
However, more than cost push, we believe the timeline
would get stretched, given the lack of clarity on several
aspects and sellers’ expectations of rising prices.
14
2
20.2
2011
0
2012
4.1
2013
Sector Update: Cement | May 2014
23

2
3
1
4
Risks to our thesis of slowing capacity addition
Ex 39: Sustainable prices based on target return ratios for 1m ton greenfield plant
INR m
Project Cost @ $120/ton
Debt:Equi ty (x)
RoE (%)
Cash RoE (%)
PAT
PBT (@ 30% Ta x)
Interes t (@ 10% i nteres t ra te)
EBIT
Depreci a ti on (@ 5%)
EBITDA
EBITDA/Ton @ 75% utilization
Current EBITDA/Ton
Increa s e i n EBITDA/Ton
Increase in prices (INR/bag)
RoE at current pricing (%)
Target RoE Target Cash
Cash Brownfield @
of 12% RoE of 12% Breakeven
USD90/ton
7,200
7,200
7,200
5,400
1
1
1
1
2.0
-10
12.0
12
22.0
12.0
0.0
27.1
432
72
-360
324
617
103
-360
463
360
360
360
270
977
463
0
733
360
360
360
270
1,337
823
360
1,003
1,783
1,097
480
1,337
574
574
574
574
1,208
523
-94
763
60
26
-4.7
38.1
-2.8
-5.6
5
1
SUPPLY
SLOWING
DOWN
2
4
2
3
1
3
Risk 1: Can brownfield capacity addition surprise?
We don’t think so
§
The prevailing profitability is not remunerative (in terms
§
§
Ex 40: Trend in capacity mix
Greenfield
5.9
2.5
6.6
4.5
8.9
Brownfield
4.0
Grinding
3.5
2.9
5.9
20.8
18.3
22.1
4.9
FY08
4.1
FY09
FY10
FY11
FY12
FY13
11.4
15.9
8.3
9.4
FY14E
FY15E
FY16E
10.0
6.7
3.0
3.5
of RoE) for setting up a new greenfield (or brownfield)
plant at current replacement cost of ~USD120/100 per
ton (as illustrated in Exhibit 39), unless there is sustained
recovery in cement prices.
Despite our belief of rising challenges in setting up new
capacities, there could be negative surprises from
announcements of higher than anticipated brownfield
expansion, for which gestation is shorter, regulatory
clearances are fewer and costs are lower.
Nonetheless, we believe with major brownfield
expansion taking place over FY08-10 and FY14-15, most
key players would have limited scope.
Risk 2: Non-traditional entrants
§
Amidst a clear trend in industry consolidation, there is
28.2
19.1
15.0
§
another emerging trend of large non-traditional
entrants, especially those with a background in power
and steel due to captive availability of fly ash and slag.
Examples: Reliance, JSW, ABG, Nirma.
Recovery in industry outlook and profitability may lure
such players to augment their expansion plans.
Sector Update: Cement | May 2014
24

2
3
2
3
1
4
1
4
Competitive intensity subsiding, as Big got bigger
Strategy: Getting bigger v/s getting better
5
1
1
5
COMPETITIVE
INTENSITY
SUBSIDING
2
4
COMPETITIVE
INTENSITY
SUBSIDING
2
4
2
3
1
3
2
3
1
3
§
Four trends visible during current down-cycle
Ø
Large players gained significant B/S strengths due to calibrated capacity addition
Ø
Rising consolidation: players with down-cycle stress getting marginalized
Ø
Entry of non-traditional players in the system
Ø
Two different strategy - Getting Bigger v/s Getting Better
Southern weakness to persist, north, east and central to see better pricing power
Ex 41: Trend in gearing of four largest cement players (ex Jaypee)
Net Debt (INR b)
0.5
33
0.6
34
0.6
35
0.3
26
0.3
25
0.2
18
2
0.0
Net Debt:Equity (x)
11
0.0
-48 -54
-0.2 -0.2
-68
-83
-84
§
Trend 1: Large players gained significant B/S
strength over FY10-13
§
§
Large cap cement players gained significant balance sheet strength
over FY10-13 (exhibit 41) on either limited (Holcim group) or
systemic capacity addition (UTCEM/SRCM).
This enabled them to remain resilient during the downturn, and at
present, are strongly poised to leverage any opportunity for
industry consolidation, as and when it arises.
17
0.1
-0.2 -0.2 -0.2
Trend 2: Players with down-cycle stress getting
marginalized
§
§
Exhibit 42 indicates the high stress among small and inefficient
players, and the huge difference with large players in terms of
addressing liquidity pressure.
Rising instances of divestment activities are visible among weaker
section of players in recent times. Valuation expectation have also
rationalized among sellers.
25
Ex 42: Inefficient, small and marginal (ISM) players are barely able
to service their debt
Interest Cost (INR/Ton)
3.9
3.3
1.4
1.1
0.0
3.1
2.7
3.7
Interest Coverage (x)
4.8
3.0
2.1
3.1
1.7
0.5
1.1
Sector Update: Cement | May 2014

2
3
1
4
Competitive intensity subsiding with increasing consolidation
Ex 43: Rise in consolidation – 7 deals in 18 months in the cement industry
5
1
COMPETITIVE
INTENSITY
SUBSIDING
2
4
2
3
1
3
Trend 3: Increasing consolidation, but non-
traditional players also enter
§
Over CY01-07, there was a trend of industry
§
§
consolidation (capacity market share of top-5 in Exhibit
44).
However, expansion flattened post CY08 due to (a)
higher expansion by tier-II players, and (b) slowing
down by MNC parents.
Over CY08-14, a positive trend was further
marginalization of non-serious players while the
concerning factor was the entry of non-traditional
players like Nirma, Reliance, JSW, ABG, and possibly
Adani.
Ex 44: Trend in capacity market share(%)
Top 5 group (%)
Marginal players
Non-traditional
1
4
5
5
52
54
51
52
2
4
4
3
5
3
Ex 45: MNC parents were slow in adding capacity over CY07-14
Holcim
5
5
Other MNCs
7
7
5
5
4
4
3
3
4
4
9
33
8
35
8
36
7
36
48
48
50
5
9
5
9
4
10
5
10
48
47
20
20
19
17
17
16
16
17
17
2001 2002 2003 2004 2005 2006 2007 2008 2009 2011 2012 2014 2017E
Sector Update: Cement | May 2014
26

2
3
1
4
Two different strategy - Getting Bigger v/s Getting Better
Trend 4: Bigger v/s better
5
1
COMPETITIVE
INTENSITY
SUBSIDING
2
4
2
3
1
3
§
Industry leaders have proactively aligned/built strengths to leverage on the recovery phase, as and when it arrives.
§
Two different strategies were visible:
§
§
Ø
Getting bigger
Ø
Getting better
We expect benefits of both to percolate hereon, with either higher profitability and margin expansion (for getting better)
and/or better market share and operating leverage (for getting bigger).
While both these strategies have their own merits, we prefer companies with headroom to grow in line with industry
along with potential improvement in cost structure and B/S.
Ex 46: Bigger vs Better
Sector Update: Cement | May 2014
27

2
3
1
4
Strategies adopted by different players
Getting better
ACC
Cost savings of INR130-160/ton each from (a) ACC-Ambuja operational
consolidation synergy and (b) various internal measures including start of
captive coal mine
Cost savings of INR130-160/ton from merger-synergy
Diversifying market mix with expansion towards stable eastern region
Overall, it is investing ~INR65b investing in ~CPP, logistic infrastructure,
modernization
Balance sheet deteriorated as net debt has gone up sharply . Current Net
debt : EBITDA at 7x, albeit market mix have improved . Working on
improving profitability in loss making north east operations.
Major cost saving triggers (pet coke, captive coal mines etc) in Cement
business, drawing INR350-400/ton improvement in cement EBITDA/ton
Improvement in market mix, higher mix of newer plants to aid uptick
operating efficiencies. B/S strength deteriorated as leverage up 3x of FY10
level
Diversification in market mix along with deterioration in B/S strength as
leverage up 3x of FY10 level
Import of limestone and gypsum has recently impacted RM cost adversely
Ban in blast mining at Rajasthan eroded cost efficiencies
Captive power plant and Indonesian coal mine – albeit full benefits yet to
percolate
B/S improvement by retiring debt through divestment
5
1
COMPETITIVE
INTENSITY
SUBSIDING
2
4
2
3
1
3
Getting bigger
No expansion over FY10-14. 8 MT of expansion plan over medium-term,
including 3.5 MT of Jamul plant (Chhattisgarh) by CY15 (11% addition on
existing capacity)
No major expansion in FY10-14. Plan of Nagaur (Rajasthan) plant of 4.5
MT (16% growth) lacks clarity on actual timeline
2x scale-up in capacity in FY10-14; Another 15% growth by FY15 in
Chhattisgarh
Grew almost ~25% in capacity over FY10-14, with visibility of another
~15% by FY16-17 through organic (Rajasthan expansion) and inorganic
(Jaypee deal) route
Scaled-up capacity under control by ~2x since FY10 with both organic
(Karnataka expansion), OCL and inorganic route (acquisition of north
east and Jaypee’s Bokaro unit)
No major expansion, as it is yet to finalize AP expansion. Might witness
capacity constraints by FY17-18
No scale-up in capacity in FY10-14, and 3mt over FY14-15
Ambuja
Shree
Cement
Ultratech
Dalmia
Bharat
Prism
JK Cement
JK Lakshmi
Ramco
Cement
Birla Corp
India Cement
Jaypee
Scale-up in capacity by 1mt FY10-14, and 5mt over FY14-15
Doubled capacity in past 6 years. No further expansion announced
Scaled up 3.2mt since FY10, but utilization hit hurdles of mining ban.
Regulatory overhang on new expansion plan
1mt expansion over FY10-14, no further visibility till FY16
Selling of capacities; Gujarat and Bihar concluded, while a few more in
fray
Sector Update: Cement | May 2014
28

2
3
1
4
Regional preference: Weaker dynamics to persist in South India
Competitive intensity to remain highest in South India
5
1
COMPETITIVE
INTENSITY
SUBSIDING
2
4
2
3
1
3
§
No regional preference for the long term, as there would be
§
Ex 48: East to witness maximum growth in supply over FY14-17
Supply CAGR (FY09-14)
Supply CAGR (FY14-17)
11%
14%
§
§
§
cascading impact on cement prices. In the near to medium
term, markets other than South India should do well.
While East India would witness the highest supply CAGR over
FY14-17 (like South India over FY09-14), we remain positive
on the East, as absolute utilization would remain strong
despite moderating from a peak of ~90% to ~80%.
South India needs minimum demand CAGR. Yet, utilization
would remain below par, with high risk of hurting pricing
power. However, strong recovery in Andhra Pradesh could
lead to positive surprise.
Competitive intensity is maximum in the South. The East is
better placed, with highest market consolidation.
Despite better dynamics, West and Central India may get
impacted by spillover in South India.
10%
10%
5%
9%
5%
North
5%
Central
East
5%
West
4%
South
Ex 49: Yet, we expect effective utilization in East India to remain much
higher (75-80%), aiding pricing power (%)
North
100%
85%
70%
55%
40%
South
West
East
Central
Ex 50: Market share of top-5 players region-wise: Highest in East,
lowest in South (%)
FY10
FY14
FY17E
90
78
66 69
85
80
71
86
74
70
52
72 72
47 45
Central
North
East
West
South
Sector Update: Cement | May 2014
29

2
3
1
4
East enjoys highest consolidation, though competitive intensity may rise
5
1
COMPETITIVE
INTENSITY
SUBSIDING
2
4
2
3
1
3
Highest supply CAGR in east may get neutralized by consolidation
§
Eastern region has maximum market consolidation with top 5 cement players accounting for 85% of capacity market share.
§
It could get strengthened further with global merger of Lafarge and Holcim, resulting into ACC, Ambuja and Lafarge accounting for
§
almost 40% capacity share. East is followed by North, Central and West in the said parameters.
Higher consolidation offers better understanding in sustaining pricing discipline. South would continue to see weakest equation
with top 5 players enjoying only ~45% market share.
Ex51: Competitive intensity based on three parameters (1)
capacity by large caps, (2) capacity by new entrants, and (3)
capacity above 2.5m tons
Competitive intensity
§
Competitive intensity is highest in South India, with largest number of (a)
operating players, and (b) big-sized capacity additions. Relatively, East
India is better placed, with highest market consolidation (75%+ share of
top-5 players), though risk of sporadic price disruption might arise from
higher proportion of expansion by new entrants and more large-sized
capacities.
Share of large caps in capacity expansion
§
Higher the proportion of large caps in new expansion, lower the risk
of price competition. East and North India score better in this context.
Share of new entrants in capacity expansion
§
Higher the proportion of new entrants in capacity expansion, higher the
risk of price competition initiated by new entities. East and Central India
score the worst, while North and South India are the best placed.
Proportion of big size expansion
§
Bigger size expansion may lead to competitive pricing for faster ramp-
up. Risk is highest in the South and the East.
Sector Update: Cement | May 2014
30

2
3
1
4
Mid-cycle RoE despite multi-decade low utilization
Utilization under-stated; benefits of operating leverage, variable cost moderation to percolate
1
STRONGER
UPCYCLE IN
MAKING
5
4
2
3
1
2
3
§
Utilization understated with excess grinding capacity due to hub-and-spoke model, pricing power to strengthen faster
§
Operating leverage, variable cost moderation benefits to percolate gradually
§
High RoE period offers high re-rating potential
Rise in excess split grinding unit capacity
§
Significant increase in split grinding units over the last 3-
§
Ex52: Excess grinding unit capacity in the system has gone up significantly
(m tons)
Excess Grinding Cap (MT)
% of reported capacity
16.3 16.3
§
§
4 years has resulted in large excess grinding capacity
17.1 17.0 17.2 17.4 18.2
(equivalent to ~17% of nameplate capacity).
7.0
These are not producible capacities. Based on clinker
3.0
capacity (~240m tons as at March 2014), we estimate
-2.2 -2.8
6
15 47 52 55 59 68
-6.0 -4.5 -7.9 -8.0
the effective producible capacity at lower than
-7
-3
-4
-9
nameplate capacity.
-12 -13
Actual utilization (adjusted for producible capacity) is
estimated at ~78% as at March 2014 v/s 69% reported
utilization.
Ex53: Trend in reported and actual* capacity utilization (%)
Demand growth of 8% CAGR hereon would take
Reported Util (%)
Adjusted Util (%) *
utilization to 80-85% by FY16.
64
66
* Adjusted for excess grinding units
Sector Update: Cement | May 2014
31

2
3
1
4
Pricing to strengthen faster and at lower utilization threshold
Pricing power a function of threshold utilization
1
STRONGER
UPCYCLE IN
MAKING
5
4
2
3
1
2
3
§
Historically, cement players have gained tremendous pricing power in periods when industry utilization grew
§
§
§
beyond 80-85%.
The industry has also seen price strengthening over the weak demand period of FY10-14 at intervals, despite
utilization being 70-75%.
The key reason could be understatement of industry utilization, as explained.
Currently, the magnitude of understatement is 8-10pp, in our view, which makes us believe that strong pricing
power should return to cement players much earlier this time, with 75-77% of reported industry utilization.
Ex55: Cement price increases in upcycle can positively surprise,
driving strong earnings growth
Price Chg (INR/bag)
50
30
10
-10
Cement prices
increased by 13.3%
CAGR on volume CAGR
of over 9%
Price Chg (%) - RHS
30
20
10
Ex54: Utilization threshold of 80-85% has resulted in strong pricing
power, historically
116
102
88
74
60
Utilization (%)
Price Growth YoY (%)
38
21
4
-13
-30
We factor in ~4.5%
CAGR price change
over FY14-17E
0
-10
Sector Update: Cement | May 2014
32

2
3
1
4
Benefits of operating leverage, variable cost moderation to percolate
Operating leverage play
Moderation in variable cost push
1
STRONGER
UPCYCLE IN
MAKING
5
4
2
3
1
2
3
§
Any positive surprise in volume should trigger benefits
§
§
of operating leverage and reduction in fixed cost.
In case of ACC/TRCL, 2% volume surprise should lead to
~INR25/15 per ton reduction in fixed cost.
Higher the operating leverage and volume levers, bigger
would be the benefit of operating leverage play.
§
Variable costs push has started moderating in FY14 with
§
~4% rise in FY14 (MOSL cement universe) v/s CAGR of
13% in FY11-13 and 10% for FY08-13.
High inflationary pressure was thus far driven by
decontrol of pricing dynamics of various cost items, the
effect of which should normalize, going forward.
Ex56: Operating leverage – every 1% improvement in utilization would drive upto ~INR10/ton cost savings
ACC
78
1,187
-1%
CY13
1,215
4%
CY14
Fixed cost/ton (INR)
81
77
1,253
6%
79
1,230
8%
Utilization (%)
80
81.6
83
Ramco
58
56
771
3%
FY14
59
782
6%
FY15
Fixed cost/ton
62
812
6%
64
Utilization (%)
66
65
67
68
1,208
10%
CY15
1,186
12%
1,165
14%
736
11%
FY13
797
8%
782
10%
FY16
768
12%
755
14%
742
16%
Ex57: We assume 4% CAGR in variable cost over FY14-16 (INR/ton)
RM + Energy
Freight
16
14
11
9
1
FY08
FY09
FY10
FY11
FY12
FY13
FY14
4
FY15E
4
4
Growth (%)
Ex58: Factoring 17% EBITDA/ton CAGR over FY14-16 v/s -10% over FY10-14
Total cost
EBITDA
High cost push zone
with neg. Op. leverage
908
1020
2336
FY08
959
2543
FY09
1110
2521
FY10
757
2837
FY11
3210
FY12
3532
999
717
3698
856
985
3829
3958
FY16E
FY13
FY14
FY15E
FY16E
Sector Update: Cement | May 2014
33

2
3
1
4
Current profitability well below peak, but still near mid-cycle levels
Industry leaders survived efficiently
1
STRONGER
UPCYCLE IN
MAKING
5
4
2
3
1
2
3
§
In the current downturn, cement prices have been resilient despite utilization being at the lowest level. Sharp
§
§
cost push, better production discipline and higher effective utilization (as discussed in previous sections) were
the key attributable factors.
Adverse impact of cost push in energy, freight and raw material, coupled with periodic disruption of pricing
rationality have significantly impacted profitability and return ratios.
FY12-14 EBITDA/ton of MOSL cement universe mimics the level of FY07-09, while FY14 RoE and margins were
higher than in FY06 despite much lower utilization (even after adjusting for excess split grinding capacities).
Ex60: FY14 EBITDA/ton mimics the level of FY06, when utilization
dynamics were better
1110
1020
92
928
89
83
84
75
18.0
FY11
85
74
21.4
FY12
82
71
23.6
FY13
959
757
77
69
16.5
FY14
FY07
FY08
FY09
FY10
FY11
FY12
FY13
FY14
FY15E
FY16E
999
908
717
856
985
Ex59: Lower pricing and utilization impacted profitability
EBITDA Margins (%)
97
101
99
Utilization (%) RHS
Adj Utilization (%) RHS
13.6
FY06
24.2
FY07
25.1
FY08
20.6
FY09
24.6
FY10
Sector Update: Cement | May 2014
34

2
3
1
4
Sector enjoyed high premium to replacement cost in high RoE period
Better RoE proven to be strong support to replacement cost;
financials better than in previous down-cycle
Ex61: RoE at mid-cycle levels v/s utilization at 25-year low
RoE (%)
Utilization (%)
97
86
82
87
89
90
100
94
88
89
83
84
75
5.5
-5.7
85
1
STRONGER
UPCYCLE IN
MAKING
5
4
2
3
1
2
3
Adj Utilization (%) RHS
§
In the previous down-cycle (FY01-03), effective capacity
§
§
§
§
§
§
utilization was much above the current level (~85% v/s
~70% now).
Yet, the current RoE is 10%+ (v/s 0-5% in FY01-03), which
is at par with the mid-cycle RoE visible during FY05,
when industry utilization was gradually crossing the 90%
level.
We understand that better pricing discipline, especially
among leaders, is the key factor behind stronger RoE.
Cement companies sustained mid-cycle RoE over FY11-
14, a period of distressed utilization.
Historically, RoE improvement has triggered sharp re-
rating in valuation multiples, as illustrated in Exhibit xx.
Companies had traded at significant premium to
replacement cost during FY07-09. If there is visibility of
uptick in industry utilization to 80%+ by FY16-17 (on
producible capacities), asset valuations should re-rate
meaningfully.
Additionally, rising challenges in setting up greenfield
plants would also make existing assets more valuable
than before.
93
82
77
76
13.6
79
69
16.6
67
74 71
4.4 3.7 14.1 11.3 24.3 50.4 41.9 26.4 22.4 13.0 12.4 17.4 10.3 68
Ex62: Periods of high RoE and high premium to replacement cost
largely coincide
Cement Sector EV/Ton (USD)
200
125
50
-25
-100
Premium to Replacement Cost (%)
Sector Update: Cement | May 2014
35

2
3
1
4
Recovery in demand key to drive momentum
Prefer stocks with higher volume levers, better market mix and cost saving triggers
1
STRONGER
UPCYCLE IN
MAKING
5
4
2
3
1
2
3
§
Demand recovery coupled with slowing capacity would drive stronger pricing and result in EPS CAGR of ~37% over FY14-
§
§
§
17E (v/s flat earnings over FY11-14).
Companies with headroom to grow volumes atleast in-line with the industry, better market mix and cost saving triggers
would see a stronger uptick.
Although earning valuations looks stretched on near bottom of the cycle performance, asset valuations are still
attractive considering rising entry barriers during impending upcycle.
We prefer ACC and SRCM among large caps, and DBEL, JKCE, JKLC and PRSC among midcaps.
Ex64: EV/EBITDA valuations at median on bottom RoE
Ex63: Large caps traded ~2x replacement cost during FY07-08 upturn
Ex65: Large cap are trading near average P/B (x)
Ex66: Large cap v/s midcap: relative valuations on EV/Ton (USD)
Sector Update: Cement | May 2014
36

2
3
1
4
Valuation & view
FY17 EV/EBITDA sensitivity to cement price change (INR/Ton)
Price Chg
(INR/Ton)
0
100
200
300
400
500
600
ACC
10.2
8.9
7.8
6.9
6.2
5.6
5.1
ACEM
12.1
10.7
9.6
8.7
8.0
7.3
6.8
UTCEM
9.6
8.7
8.0
7.4
6.8
6.3
5.9
SRCM
8.9
8.1
7.4
6.8
6.3
5.9
5.5
BCORP
3.5
2.8
2.3
1.9
1.6
1.3
1.2
DBEL
6.9
6.1
5.5
5.0
4.6
4.2
3.8
ICEM
7.2
6.1
5.2
4.6
4.0
3.6
3.2
JKCE
4.7
4.3
4.0
3.6
3.4
3.1
2.9
JKLC
6.0
5.2
4.5
4.0
3.5
3.2
2.9
ORCMNT
8.3
7.1
6.2
5.4
4.9
4.4
4.0
PRSC
5.0
4.5
4.1
3.8
3.5
3.3
3.0
1
STRONGER
UPCYCLE IN
MAKING
5
4
2
3
1
2
3
TRCL
10.7
9.2
8.1
7.2
6.4
5.8
5.3
FY17 Target Price sensitivity to cement price change (INR/Sh)
Price Chg
(INR/Ton)
0
100
200
300
400
500
600
ACC
1,503
1,675
1,848
2,020
2,192
2,365
2,537
ACEM
229
242
256
269
283
296
310
UTCEM
2,384
2,598
2,812
3,026
3,240
3,454
3,668
SRCM
6,988
7,555
8,122
8,689
9,256
9,823
10,390
BCORP
371
425
479
533
587
641
695
DBEL
391
476
561
646
731
816
901
ICEM
42
68
94
120
146
171
197
JKCE
408
470
531
593
654
716
777
JKLC
164
204
244
284
324
364
403
ORCMNT
38
57
76
94
113
132
151
PRSC
67
74
82
89
97
104
112
TRCL
212
259
306
353
401
448
495
Sector Update: Cement | May 2014

2
3
1
4
Valuation & view
Operating Matrix
FY14E
ACC
30.7
Ambuja
28.8
Ul tra tech
59.1
Shree Cement
19.1
Large Cap
137.7
Bi rl a Corp
9.3
Da l mi a Bha ra t Ent.
11.9
Indi a Cements
15.2
JK Cement
8.6
JK La ks hmi Cement
5.3
Ma dra s Cement
14.5
Ori ent Cement
5.0
Pri s m Cement
5.6
Mid-caps
75.4
Aggregate
213.0
Capacity (MT)
FY15E FY16E
30.7
34.2
29.6
29.6
59.1
62.0
21.6
22.0
141.0 147.8
9.3
9.3
16.5
16.5
15.2
15.2
11.6
11.6
9.2
9.8
15.5
15.5
5.0
8.0
5.6
5.6
87.8
91.4
228.8 239.2
FY17E
34.2
29.6
62.0
22.0
147.8
9.3
16.5
15.2
11.6
9.8
15.5
8.0
5.6
91.4
239.2
FY14E
23.9
21.6
42.1
14.0
101.6
7.4
6.7
10.8
5.9
5.6
8.6
4.2
5.1
54.3
155.9
Volume (MT)
FY15E FY16E
24.9
26.9
22.4
23.7
46.2
50.7
15.7
17.6
109.1 118.8
8.0
8.4
9.1
10.4
11.5
12.5
6.7
7.4
6.0
6.7
9.1
10.0
4.3
4.9
5.5
6.1
60.1
66.5
169.3 185.3
FY17E
29.6
26.1
55.6
19.7
130.9
8.8
11.6
13.8
8.1
7.6
11.0
5.6
6.7
73.1
204.0
EBITDA (INR/Ton)
FY14E FY15E FY16E
572
638
802
717
865
980
859 1,003 1,148
979 1,111 1,240
778
907 1,050
283
478
593
485
527
744
549
692
781
580
973 1,223
536
712
843
516
700
797
491
608
739
68
448
755
452
645
804
664
814
962
FY17E
999
1,134
1,352
1,410
1,238
810
939
881
1,401
1,009
926
965
948
972
1,143
FY14E
12.5
17.0
18.0
23.9
17.3
7.1
11.4
13.3
12.2
14.7
14.1
14.4
2.4
11.4
15.3
EBITDA (%)
FY15E FY16E
13.5
16.1
19.5
20.9
19.9
21.4
25.5
27.2
19.1
21.0
11.3
13.3
14.3
18.5
15.8
17.0
16.9
19.8
18.1
20.2
16.8
18.0
16.6
18.9
7.2
11.2
14.8
17.2
17.6
19.6
FY17E
18.8
20.9
21.4
27.2
21.6
13.3
18.5
17.0
19.8
20.2
18.0
18.9
11.2
17.2
20.0
1
STRONGER
UPCYCLE IN
MAKING
5
4
2
3
1
2
3
Net Debt (INR b)
FY14E FY15E FY16E FY17E
-27.0 -30.6 -30.6 -35.9
-41.0 -37.3 -37.6 -37.5
-4.7
-0.7 -14.1 -45.4
-11.1 -10.5 -27.3 -47.5
-83.8 -79.1 -109.5 -166.3
-7.0
-7.6
-7.4 -10.8
29.8
43.8
40.8
33.2
33.5
34.7
31.1
26.7
23.0
27.6
24.3
16.5
12.3
15.5
13.9
11.2
28.6
27.8
24.2
17.3
3.5
12.8
16.2
14.9
17.8
17.2
13.9
10.2
141.5 171.8 156.9 119.1
57.6
92.7
47.4 -47.2
Financial Matrix
FY14E
48.5
6.8
75.6
275.2
16.9
-1.0
-7.9
10.7
9.2
4.9
4.9
-3.3
EPS (INR)
FY15E FY16E
60.4
79.2
8.9
10.4
94.9 119.9
325.5 432.4
36.1
-7.2
3.8
18.8
11.4
8.4
6.3
0.2
46.0
20.4
8.2
37.0
12.3
13.4
4.5
5.1
FY17E
104.1
13.2
157.4
567.8
66.5
64.2
13.9
61.0
24.3
21.0
9.4
8.8
FY14E
12.0
11.5
12.8
18.8
14.1
5.1
-0.3
-1.3
4.5
8.4
4.8
12.7
-15.9
0.7
10.1
RoE (%)
FY15E FY16E
14.1
17.3
14.1
15.3
14.3
15.8
18.2
20.1
16.0
18.2
10.2
11.9
-1.9
5.4
3.4
6.4
7.3
13.2
9.9
10.1
7.8
11.6
14.8
9.6
1.0
22.5
6.1
11.4
13.2
16.3
FY17E
20.7
18.0
17.8
22.7
21.0
15.0
15.3
9.8
19.1
18.0
16.3
18.4
30.6
18.4
20.3
FY14E
15.3
16.3
14.4
18.9
15.6
6.1
4.2
4.2
7.2
7.7
6.1
15.5
-0.7
5.9
12.2
RoCE (%)
FY15E FY16E FY17E
17.9
17.9 27.6
19.7
19.7 25.4
16.5
16.5 22.5
20.8
20.8 26.6
18.1
18.1 24.8
10.6
10.6 16.0
5.8
5.8 12.1
6.7
6.7 12.1
9.2
9.2 16.0
8.1
8.1 17.3
9.5
9.5 16.6
12.7
12.7 15.3
8.5
8.5 28.2
8.5
8.5 15.9
14.7
14.7 21.7
Net Debt:Equity (x)
FY14E FY15E FY16E FY17E
-0.3
-0.4
-0.3
-0.4
-0.4
-0.4
-0.3
-0.3
0.0
0.0
-0.1
-0.2
-0.2
-0.2
-0.4
-0.6
-0.2
-0.2
-0.2
-0.3
-0.3
-0.3
-0.2
-0.3
1.0
1.5
1.3
0.9
0.9
0.9
0.8
0.6
1.3
1.5
1.2
0.7
0.9
1.1
0.9
0.7
1.2
1.1
0.8
0.5
0.4
1.4
1.7
1.3
1.8
1.7
1.1
0.6
0.9
1.0
0.9
0.6
0.2
0.2
0.2
0.0
FY14E
4.4
6.3
5.8
4.9
34.3
8.1
4.8
6.7
12.7
6.1
-0.3
5.3
OCF yield (%)
FY15E FY16E FY17E
11.7
11.0
14.3
6.2
7.8
9.6
6.8
8.3
11.0
8.8
10.5
13.5
30.8
4.8
13.2
8.2
11.9
7.5
6.5
10.2
31.4
7.2
15.4
15.5
16.6
8.9
11.5
18.2
47.5
13.4
19.1
29.1
20.9
13.6
15.1
20.1
ACC
Ambuja
Ul tra tech
Shree Cement
Large Cap
Bi rl a Corp
Da l mi a Bha ra t Ent.
Indi a Cements
JK Cement
JK La ks hmi Cement
Ma dra s Cement
Ori ent Cement
Pri s m Cement
Mid-caps
Aggregate
Sector Update: Cement | May 2014
38

2
3
1
4
Valuation & view
Cement: Valuation summary
Reco
ACC
Ambuja
Ul tra tech
Shree Cement
LARGE CAP
Bi rl a Corp
Da l mi a Bha ra t Ent.
Indi a Cements
JK Cement
JK La ks hmi Cement
Ma dra s Cement
Ori ent Cement
Pri s m Cement
MID CAPS
AGGREGATE
* EV a dj for CWIP
Buy
Neutra l
Buy
Buy
Buy
Buy
Neutra l
Buy
Buy
Buy
Neutra l
Buy
Mcap
(USD b)
4.2
5.4
10.5
4.0
0.5
0.5
0.5
0.4
0.3
1.0
0.3
0.5
CMP
INR
1,331
208
2,264
6,822
347
347
93
336
175
260
77
54
Target price Upside
PE (x)
EV/EBITDA (x) *
(FY16)
(%)
FY14E FY15E FY16E FY17E FY14E FY15E FY16E
1,815
36
27.5
22.0
16.8
12.8
15.7
12.5
9.8
246
18
30.8
23.3
20.1
15.7
17.6
14.3
11.5
2,873
27
30.0
23.9
18.9
14.4
16.2
12.8
10.3
8,034
18
24.8
21.0
15.8
12.0
15.9
12.5
9.5
28.6
23.1
18.4
14.1
16.4
13.0
10.5
486
40
20.6
9.6
7.5
5.2
8.9
4.6
3.4
538
55
-335.9 -48.3 17.0
5.4
14.1
11.7
7.0
106
13
-11.8 24.3
11.4
6.7
10.4
7.9
6.0
469
40
31.4
17.8
9.1
5.5
8.5
8.2
5.5
262
50
19.1
15.3
14.2
7.2
7.9
8.1
5.8
326
25
52.9
31.0
19.4
12.4
17.3
12.8
9.8
88
14
15.6
12.2
17.3
8.2
7.5
6.2
8.5
74
37
-16.4 273.3 10.8
6.2
37.5
10.8
5.5
206.5 24.7
12.7
7.0
12.6
9.2
6.5
32.5
23.3
17.3
12.4
15.4
11.9
9.2
EV/Ton (USD) at CMP *
FY17E FY14E FY15E FY16E FY17E
6.9
119
110
105
105
8.7
161
158
153
153
7.4
167
169
163
163
6.8
187
165
156
156
7.6
159
155
150
150
1.9
34
32
31
31
4.6
66
72
68
68
4.5
68
70
66
66
3.6
56
73
69
69
4.0
76
64
57
57
7.2
103
97
93
93
5.4
52
55
65
65
3.8
121
105
71
71
4.5
74
74
70
70
6.6
129
124
119
119
1
STRONGER
UPCYCLE IN
MAKING
5
4
2
3
1
2
3
EV/Ton
at TP
150
160
200
190
50
84
70
82
75
110
70
94
Sector Update: Cement | May 2014

2
3
1
4
Annexure - I
1
STRONGER
UPCYCLE IN
MAKING
5
4
2
3
1
2
3
Sector Update: Cement | May 2014
40

2
3
1
4
Annexure - II
1
STRONGER
UPCYCLE IN
MAKING
5
4
2
3
1
2
3
Sector Update: Cement | May 2014
41

2
3
1
4
Annexure - III
List of region-wise capacity addition
Company/Plant
1Q
Central region
JP Ind - Si ddhi
Rel i a nce Cement
Rel i a nce Cement (G)
Central Capacity Additions
Eastern region
JK La ks hmi - CTG
Century Texti l es
Ul tra Tech
OCL (G)
Shree Cement (G)
ACC
Shree Cement
East Capacity Additions
Northern region
Shree Cement
La fa rge
Shree Cement
JK Cement
Ambuja Cement
Ul tra Tech
Ma nga l a m Cement
North Capacity Additions
FY14E
2Q
3Q
4Q
2.6
2.3
0.8
2.0
7.7
1Q
FY15E
2Q
3Q
4Q
1Q
FY16E
2Q
3Q
4Q
1Q
FY17E
2Q
3Q
1
STRONGER
UPCYCLE IN
MAKING
5
4
2
3
1
2
3
Total
4Q
2.6
2.3
0.8
2.0
7.7
2.7
1.5
4.8
1.0
2.0
3.5
2.5
18.0
2.0
2.5
2.0
3.0
0.0
2.9
1.3
13.7
0.0
0.0
0.0
0.0
0.0
2.7
0.0
0.0
0.0
0.0
0.0
0.0
0.0
0.0
0.0
0.0
1.5
4.8
1.0
2.0
3.5
1.5
4.8
2.0
2.5
2.0
3.0
2.9
0.0
2.0
0.0
1.3
3.8
0.0
2.0
3.0
2.9
0.0
0.0
0.0
0.0
0.0
0.0
0.0
0.0
0.0
1.0
0.0
4.7
0.0
0.0
3.5
2.5
2.5
0.0
0.0
0.0
0.0
0.0
0.0
Sector Update: Cement | May 2014
42

2
3
1
4
Annexure - III
1
STRONGER
UPCYCLE IN
MAKING
5
4
2
3
1
2
3
Sector Update: Cement | May 2014
43

Company section
Large-cap
q
q
q
q
Mid-cap
q
q
q
q
q
q
q
q
ACC
Ambuja Cements
UltraTech Cement
Shree Cement
Birla Corp
Dalmia Bharat
India Cements
JK Cement
JK Lakshmi Cement
The Ramco Cements
Orient Cement
Prism Cement
Sector Update: Cement | May 2014
44

ACC: Narrowing of profitability gap to drive re-rating
Financials & Valuation (INR b)
Y/E Decembe
Sa l es
2013
109.1
2014E
117.4
2015E
134.0
2016E
156.8
EBITDA
13.7
15.9
21.6
29.5
NP
9.1
11.4
14.9
19.6
Adj. EPS (INR
48.6
60.4
79.2
104.1
EPS Gr. (%)
-29.3
24.4
31.1
31.4
BV/Sh (INR)
416
441
473
531
RoE (%)
12.0
14.1
17.3
20.7
RoCE (%)
15.3
17.9
22.5
27.6
Pa yout (%)
60.2
62.6
58.7
44.7
Valuations
P/E (x)
27.5
22.0
16.8
12.8
P/BV (x)
3.2
3.0
2.8
2.5
EV/EBITDA (x
15.7
12.5
9.8
6.9
EV/Ton (x)
119
110
105
101
* Synergy impact not formally included in estimates
Best play on Indian Cement
Pan-India presence and a very strong brand make ACC one of the best proxies on the Indian
Cement industry. Considering its very high operating leverage, ACC’s EPS is very sensitive to
change in cement prices. For every INR1/bag change in cement prices, ACC’s CY14E/CY15E
EPS would change by 3.3%/2.7%.
Better play on synergies of operating consolidation
Acquisition of ACC by ACEM would drive synergies of INR3.5b-4b each to be realized over 2-3
years. ACC is a better vehicle to play these synergies, without issues of cash outflow (for
acquisition) or hold-co discount. ACC has the strongest B/S among large caps (post cash
outgo of ACEM owing to acquisition of ACC stake), with cash surplus of ~INR30b. Healthy B/S
and healthy operating leverage would help sustain its robust payout of 50%+.
Multiple cost savings triggers to narrow profitability discount to peers
Further, ACC is also targeting various cost saving measures over and above the synergies. The
management initiatives of INR4-4.5b of cost savings would include (1) reduction of logistics
cost by INR1.5-2b pa (~INR60-70/ton) by reducing turnaround time by 30-40%, resulting in
15% reduction in road freight cost, by increasing usage of RFID/GPS system, and (2) savings
on energy cost of ~INR2.5b pa (INR80-90/ton) over next 2 years through rise in alternate fuel
usage, pet coke and benefits of partial commencement of coal block. We estimate 20-30%
upgrade potential in ACC’s EPS over CY15-16, resulting in sharp narrowing of the existing
profitability gap with large cap peers, and a 4-5pp uptick in capital efficiencies.
Growth plans towards better market mix
~8m tons of expansion (to fructify over CY15-18) including ongoing 3.5m tons at Chhattisgarh
would strengthen geography mix. The contribution of Central and East India could increase
from ~37% in CY13 to ~50% by CY17/CY18. ACC’s expansion plans are expected to improve its
presence in better placed regions like East and Central India. At current utilization, it offers
reasonable scope to tap positive surprise in volume recovery.
Stock info
Equi ty Sha res (m)
52-Week Ra nge (INR)
1,6,12 Rel . Perf. (%)
M.Ca p. (INR b)
M.Ca p. (USD b)
187.9
1460/912
-7/4/-15
250.1
4.2
Sector Update: Cement | May 2014
45

ACC: Narrowing of profitability gap to drive re-rating
Buy with a target price of INR1,815, Base case upside 36%
We prefer ACC due to strongest balance sheet among peers (after cash outgo of ACEM) and healthy dividend, which would be
welcomed by parent (ACEM) to support its cash outgo. Given that ACC’s EV/ton has been historically lower than ACEM/UTCEM, it
should see a re-rating, led by uptick in profitability. The stock trades at an EV of 9x/6.1x CY15E/CY16E EBITDA and USD104/100 per
ton.
Buy
with a CY15-based TP of INR1,815 (EV of ~USD150/ton, assuming 50%/100% synergy benefits in CY15/16 but no benefit of
its own cost cutting initiatives). In bull case (~INR30/bag price increase in CY16), CY16 based TP can be ~INR2,537 (upside 91%).
CY15 performance sensitivity to cement price change
Price chg
EBITDA/Ton
over CY14
(INR/Ton)
(INR/Ton)
-100
452
0
552
100
652
250
802
300
852
400
952
500
1,052
EPS
42
53
63
79
84
95
106
PE (x)
31.6
25.2
21.0
16.8
15.7
14.0
12.6
EV/EBITDA
(x)
18.1
14.7
12.3
9.8
9.2
8.1
7.3
EV/Ton
(US$)
109
108
107
105
105
103
102
TP
(INR/sh)
1,121
1,319
1,518
1,815
1,915
2,113
2,311
EV/Ton at
Upside (%)
TP (USD)
90
107
124
150
159
176
194
-16
-1
14
36
44
59
74
Trend in EV/EBITDA (x)
CY16 performance sensitivity to cement price change
Price chg
EBITDA/Ton
over CY15
(INR/Ton)
(INR/Ton)
0
100
200
300
400
500
600
699
799
899
999
1,099
1,199
1,299
Trend in EV/ton (USD)
TP
(INR/sh)
1,503
1,675
1,848
2,020
2,192
2,365
2,537
EPS
70
81
93
104
115
127
138
PE (x)
19.0
16.3
14.3
12.8
11.5
10.5
9.6
EV/EBITDA
(x)
10.2
8.9
7.8
6.9
6.2
5.6
5.1
EV/Ton
(US$)
105
104
102
101
100
99
97
EV/Ton at
Upside (%)
TP (USD)
121
136
151
165
180
195
210
13
26
39
52
65
78
91
Historically, ACC traded at discount to peers like ACEM, UTCEM due to lower profitability. It asset valuations should see a gradual re-
rating, led by improvement in profitability on internal cost saving measures and synergies.
Sector Update: Cement | May 2014
46

ACC: Operational snapshot
Share of East and Central India rising in capacity market mix
(%); CY17/18 mix hinges on Tikaria and Amethi expansions
West
South
North
East
Central
13
30
20
22
15
CY13
12
27
17
30
13
CY15E
10
24
15
27
23
CY17/18E
South
19%
North
24%
West
13%
Central
23%
East
21%
Pan India volume
mix (%)
Utilization at ~80% offers meaningful scope for improvement at current visibility
Capacity (mt)
Despatch (mt)
Cap. Util (%)
90.6
82.2
77.4
69.4
78.0
78.6
81.1
78.7
86.5
CY08
CY09
CY10
CY11
CY12
CY13
CY14E
CY15E
CY16E
Multiple cost saving levers offer strong upgrade potential for profitability (refer
table on next page)
EBITDA/ton (INR)
Best case
Trend in capital efficiencies (%)
42
RoE
RoCE
140
220
34
26
18
825
CY08
1175
CY09
730
CY10
712
CY11
816
CY12
572
CY13
638
CY14E
802
CY15E
999
CY16E
10
CY08
CY09
CY10
CY11
CY12
CY13
CY14E
CY15E
CY16E
Strong B/S comfortably addresses capex plan
Net debt (INR b)
CWIP as % of CE
DER (x) RHS
ACC offers highest base case EPS (INR), CAGR (%)
CY13
CY14E
CY15E
CY16E
CY13-16E CAGR
-0.2
-12
CY08
27.9
-0.3
-17
CY09
31.1
21.2
5.3
-0.3
-23
CY10
-0.4
-28
CY11
-0.4
-31
CY12
3.8
-27
CY13
9.8
-0.3
-0.4
-31
23.8
7.9
-0.3
-31
CY15E
-0.4
-36
CY16E
-29
9.5
30
36
34
36
29
26
-24
22
27
26
26
28
31
-21
ACEM
UTCEM
CY14E
ACC
Sector Update: Cement | May 2014
47

ACC: Cost saving triggers, profitability uptick key to structural re-rating
Key cost saving measures adopted and potential savings
Aspiration to enhance operating efficiencies in line with best practices
Cost initiatives to lower profitability discount to peers (EBITA/ton in INR)
247
ACC
ACEM
UTCEM (ex white)
Gap vs Peers
162
203
111
46
CY12
CY13
CY14E
CY15E
CY16E
Sector Update: Cement | May 2014
48

ACC - Financials
Income Statement
Y/E December
Net Sales
Cha nge (%)
Tota l Expendi ture
EBITDA
Cha nge (%)
Ma rgi n (%)
Depreci a ti on
Int. a nd Fi n. Cha rges
Other Income - Rec.
PBT Before EO Item
EO Income/(Expens e)
PBT After EO Item
Ta x
Ta x Ra te (%)
Reported PAT
Adjusted PAT
Cha nge (%)
Ma rgi n (%)
(INR Million)
CY11
CY12
CY13
CY14E
CY15E
CY16E
94,296 111,305 109,084 117,362 133,995 156,760
22.2
18.0
-2.0
7.6
14.2
17.0
77,396 91,624 95,402 101,492 112,428 127,217
16,901 19,681 13,683 15,870 21,568 29,543
8.8
16.4
-30.5
16.0
35.9
37.0
17.9
17.7
12.5
13.5
16.1
18.8
-4,753
-5,589
-5,740
-5,753
-6,500
-7,427
-969
-1,147
-517
-425
-450
-450
4,226
4,923
4,573
5,250
5,500
5,500
15,404 17,869 12,000 14,942 20,118 27,166
2,280
-3,354
2,437
1,128
0
0
17,684 14,515 14,437 16,070 20,118 27,166
4,431
3,903
3,479
3,857
5,231
7,607
25.1
26.9
24.1
24.0
26.0
28.0
13,253 10,612 10,958 12,213 14,887 19,560
11,544 12,918
9,108 11,356 14,887 19,560
13.9
11.9
-29.5
24.7
31.1
31.4
12.2
11.6
8.3
9.7
11.1
12.5
Balance Sheet
Y/E December
Sha re Ca pi ta l
Res erves
Net Worth
Loa ns
Deferred Ta x Li a bi l i ty
Capital Employed
Gros s Bl ock
Les s : Accum. Depn.
Net Fixed Assets
Ca pi ta l WIP
Inves tments
Curr. Assets, Loans&Adv.
Inventory
Account Recei va bl es
Ca s h a nd Ba nk Ba l a nce
Others
Curr. Liab. and Prov.
Account Pa ya bl es
Other Li a bi l i ti es
Provi s i ons
Net Current Assets
Application of Funds
E: MOSL Es ti ma tes
CY11
1,879
70,043
71,923
5,061
5,184
82,167
95,757
34,378
61,378
4,353
16,250
37,912
10,995
1,877
16,526
8,513
37,726
22,273
3,723
11,730
186
82,167
CY12
1,880
71,949
73,828
850
5,169
79,848
92,582
33,831
58,752
3,000
25,536
31,975
11,336
3,035
6,784
10,821
39,415
21,763
3,811
13,841
-7,440
79,848
CY13
1,880
76,369
78,248
0
5,073
83,321
98,589
43,549
55,040
8,196
21,940
35,760
11,215
3,972
5,034
15,539
37,615
21,849
4,068
11,698
-1,855
83,321
CY14E
1,880
80,936
82,816
0
5,314
88,130
(INR Million)
CY15E
CY16E
1,880
1,880
87,086 97,908
88,965 99,787
0
0
5,616
6,023
94,581 105,810
99,785 128,285 141,785
49,302 55,802 63,229
50,483 72,483 78,556
21,000
7,500 10,000
10,537
7,623
9,094
47,910 54,699 63,992
12,862 14,684 17,179
3,215
3,671
4,295
20,096 22,944 26,842
11,736 13,400 15,676
41,800
23,151
4,180
14,469
6,109
88,130
47,724
26,432
4,772
16,520
6,975
55,832
30,922
5,583
19,327
8,160
94,581 105,810
Sector Update: Cement | May 2014
49

ACC - Financials
Ratios
Y/E December
Basic (INR)
EPS
Ca s h EPS
BV/Sha re
DPS
Pa yout (%)
Valuation (x)
P/E
Ca s h P/E
EV/Sa l es
EV/EBITDA
P/BV
Di vi dend Yi el d
EV/ton (USD-Ca p)
Return Ratios (%)
RoE
RoCE
Working Capital Ratios
Debtor (Da ys )
As s et Turnover (x)
Leverage Ratio
Debt/Equi ty (x)
* EPS numbers a re a nnua l i zed.
CY11
61.4
86.7
382.7
28.0
46.0
CY12
68.7
98.5
392.9
30.0
61.8
CY13
48.5
79.0
416.4
30.0
60.2
CY14E
60.4
91.0
440.7
35.0
62.6
CY15E
79.2
113.8
473.4
40.0
58.7
CY16E
104.1
143.6
531.0
40.0
44.7
Cash Flow Statement
Y/E December
OP/(Los s ) before Ta x
Interes t/Di vi dends Recd.
Di rect Ta xes Pa i d
(Inc)/Dec i n WC
CF from Operations
EO Income/(Expens e)
CF from Op. incl EO Exp.
(i nc)/dec i n FA
(Pur)/Sa l e of Inves tments
CF from Investments
Is s ue of Sha res
(Inc)/Dec i n Debt
Interes t Pa i d
Di vi dend Pa i d
CF from Fin. Activity
Inc/Dec of Cash
Add: Begi nni ng Ba l a nce
Closing Balance
E: MOSL Es ti ma tes
CY11
16,901
4,226
-2,863
-4,391
13,872
2,280
16,152
-4,032
777
-3,255
70
-177
-969
-6,095
-7,171
5,725
10,800
16,526
CY12
19,681
4,923
-3,917
-2,116
18,570
-3,354
15,217
-1,609
-9,286
-10,895
-2,153
-4,211
-1,147
-6,553
-14,064
-9,742
16,526
6,784
CY13
13,683
4,573
-3,576
-7,335
7,345
2,437
9,782
-7,224
3,595
-3,628
60
-850
-517
-6,597
-7,904
-1,750
6,784
5,034
(INR Million)
CY14E
15,870
5,250
-3,616
7,098
24,603
1,128
25,730
-14,000
11,403
-2,597
0
0
-425
-7,645
-8,070
15,062
5,034
20,096
CY15E
21,568
5,500
-4,929
1,982
24,121
0
24,121
-15,000
2,915
-12,085
0
0
-450
-8,738
-9,188
2,848
20,096
22,944
CY16E
29,543
5,500
-7,199
2,713
30,557
0
30,557
-16,000
-1,471
-17,471
0
0
-450
-8,738
-9,188
3,898
22,944
26,842
21.7
15.3
2.3
12.9
3.5
2.1
120
19.4
13.5
1.9
11.0
3.4
2.3
119
27.5
16.8
2.0
15.7
3.2
2.3
119
22.0
14.6
1.7
12.5
3.0
2.6
110
16.8
11.7
1.6
9.8
2.8
3.0
105
12.8
9.3
1.3
6.9
2.5
3.0
101
16.9
21.0
17.7
23.5
12.0
15.3
14.1
17.9
17.3
22.5
20.7
27.6
7
0.9
10
0.7
13
0.8
10
0.8
10
0.7
10
0.7
0.1
0.0
0.0
0.0
0.0
0.0
Sector Update: Cement | May 2014
50

Ambuja Cements: Positives priced in
Consol. Financials & Valuation (INR b)
Y/E December
Sa l es
EBITDA
NP
Adj. EPS (INR)
EPS Gr. (%)
BV/Sh. (INR)
RoE (%)
RoCE (%)
Pa yout (%)
Valuations
P/E (x)
P/BV (x)
EV/EBITDA (x)
EV/Ton (USD)
2013 2014E 2015E 2016E
200.0 216.7 245.2 286.9
29.2 35.2 44.8 59.1
15.1 18.0 21.4 28.2
7.6
9.1 10.9 14.3
-23.7 19.2 19.2 31.6
88.8 93.8 100.1 109.9
11.5 10.0 11.2 13.6
20.8 18.4 21.1 25.9
49.9 55.6 56.0 43.9
27.3
2.3
15.5
133
22.9
2.2
13.8
141
19.2
2.1
10.7
133
14.6
1.9
7.8
126
Acquisition of ACC drives doubling of capacity under control at reasonable price
ACC’s acquisition by ACEM, through Holcim’s restructuring transaction is at-par valuations for
ACEM (ex INR9b of guided synergy benefits and hold-co discount). This acquisition doubles
ACEM’s capacity, making it pan-India play with significant market dominance in North, East
and West.
Synergies to drive profitability, EPS upgrades
The management expects restructuring to drive synergies of INR7.8b-9b. The benefits would
accrue over the next 2-3 years and offset gradual reduction in subsidy, driving 16%/19% EPS
accretion in CY14/CY15 (after factoring impact of cash outgo). We expect material swap to
also (a) enable volume synergies by lowering regional capacity constraints, and (b) improve
market mix by expanding reach. We factor in synergy benefits of 20%/50% in CY14/CY15. Full
benefits would accrue only in CY16.
Balance sheet remains self-sustaining despite cash usage
We expect ACEM’s balance sheet to remain self-sustaining, despite INR35b cash outgo, as a
net debt situation will arise only if ACEM goes for additional 10% stake purchase in ACC. We
expect net cash to reduce from ~INR38b in CY14 pre-deal (standalone) to ~INR22b in CY14
post-deal (pro rata consolidated).
Positives priced in – Maintain Neutral
While investors are concerned about hold-co discount for ACEM’s stake in ACC, we believe
ACC’s higher payout and operating control by ACEM may offset concerns pertaining to
normal hold-co structure. However, ACEM’s consolidated capital efficiencies would dilute
significantly post acquisition of ACC. ACEM trades at 9.9x/6.8x CY15/16E EBITDA and at
CY15/16E EV/ton of USD132/124.
Maintain Neutral,
with a revised CY15 based target price of
INR246 (~USD160/ton, assuming 50%/100% synergy benefits in CY15/16 and no hold-co
discount).
Base case upside 18%
Stock info
Equity Shares (m)
52-Week Range (INR)
1,6,12 Rel. Perf. (%)
M.Cap. (INR b)
M.Cap. (USD b)
1,542.2
241/148
-9/-4/-10
321.1
5.4
Sector Update: Cement | May 2014
51

Ambuja Cements: Positives priced in
§
Factoring in for synergies of acquisition to be fully realized by CY16E, ACEM trades at valuations of 6.8x CY16E EV/EBITDA
§
and USD124/ton.
While our base case factors in for price increase of ~INR15/bag in CY16, in bull case (~INR30/bag price increase in CY16),
ACEM’s TP can be ~INR310 (implied EV/Ton of ~USD197).
CY15 performance sensitivity to cement price change
Price chg
EBITDA/Ton
over CY14
(INR/Ton)
(INR/Ton)
-100
630
0
730
100
830
250
980
300
1,030
400
1,130
500
1,230
EPS
6
8
9
10
11
12
13
PE (x)
32.1
27.4
23.9
20.1
19.1
17.3
15.8
EV/EBITDA
(x)
18.2
15.6
13.7
11.5
10.9
9.9
9.0
EV/Ton
(USD)
156
155
154
153
152
151
150
TP
(INR/sh)
187
204
221
246
254
271
287
EV/Ton at
Upside (%)
TP (USD)
120
131
142
160
165
177
188
-10
-2
6
18
22
30
38
Trend in EV/EBITDA (x)
CY16 performance sensitivity to cement price change
Price chg
EBITDA/Ton
over CY15
(INR/Ton)
(INR/Ton)
0
100
200
300
400
500
600
834
934
1,034
1,134
1,234
1,334
1,434
Trend in EV/ton (USD)
TP
(INR/sh)
229
242
256
269
283
296
310
EPS
10
11
12
13
14
16
17
PE (x)
21.7
19.3
17.3
15.7
14.4
13.3
12.3
EV/EBITDA
(x)
12.1
10.7
9.6
8.7
8.0
7.3
6.8
EV/Ton
(USD)
151
150
149
148
147
146
145
EV/Ton at
Upside (%)
TP (USD)
142
152
161
170
179
188
197
10
16
23
29
36
42
49
Sector Update: Cement | May 2014
52

Ambuja Cements: Operational snapshot
Capacity market mix skewed towards stronger regions
5
27
28
40
CY13
4
23
25
48
Central
East
West
South
North
CY16-18E
Pan India volume mix (%)
Central
Exports
2% 3%
North
37%
Utilization above industry average; fresh expansion only in CY16-17, may limit
growth levers
95
75
18
19
25
19
25 20
CY10
28
21
28
22
29
22
Capacity (MT)
81
78
Dispatches (MT)
79
75
76
30
Cap. Util (%)
80
88
South
2%
West
38%
East
18%
22
30
24
30 26
CY08
CY09
CY11
CY12
CY13
CY14E
CY15E
CY16E
ACEM’s margins at multi-decade low due to erosion of subsidy
benefits and cost push
32
27
27
27
EBITDA/ton
36
37
28
Synergies (INR/ton)
26
25
23
26
0
17
EBITDA margin (%)
36
19
84
21
153
23
Lack of expansion led lowering in market share (%)
Consol. RoE diluted by ACC’s acquisition
22.6
S/A RoE
19.6
18.1
16.3
Consol RoE
18.3
11.5
14.1
18.0
Consol balance sheet remains net cash
32
15.3
27
27
27
EBITDA/ton
36
37
28
Synergies (INR/ton)
26
25
23
26
0
17
EBITDA margin (%)
36
19
84
21
153
23
10.0
CY08
CY09
CY10
CY11
CY12
CY13
CY14E
11.2
13.6
CY15E
CY16E
Sector Update: Cement | May 2014
53

Ambuja Cements: Financials (Consolidated)
Income Statement (Consolidated)
Y/E December
Net Sales
Cha nge (%)
Tota l Expendi ture
% of Sa l es
EBITDA
Cha nge (%)
Ma rgi n (%)
Depreci a ti on
EBIT
Int. a nd Fi na nce Cha rges
Other Income - Rec.
PBT before EO Exp.
EO Expens e/(Income)
PBT after EO Exp.
Current Ta x
Deferred Ta x
Ta x Ra te (%)
Les s : Mi onri ty Interes t
Reported PAT
PAT Adj for EO Items
Cha nge (%)
2011
85,043
15.1
65,656
77.2
19,387
6.3
22.8
4,452
14,935
526
2,978
17,387
358
17,029
3,613
1,127
27.8
12,289
12,547
0.9
(INR Million)
2012
2013
2014E
2015E
2016E
96,749 199,953 216,665 245,180 286,883
13.8
106.7
8.4
13.2
17.0
72,074 170,788 181,452 200,388 227,769
74.5
85.4
83.7
81.7
79.4
24,675
27.3
25.5
5,373
19,302
757
4,042
22,588
3,570
19,018
6,048
0
31.8
12,971
15,435
23.0
29,165
18.2
14.6
10,640
18,524
1,168
8,923
26,280
-5,706
31,986
8,082
0
25.3
4,553
19,350
15,086
-2.3
35,213
20.7
16.3
10,722
24,491
1,066
8,850
32,275
-102
32,377
8,173
468
26.7
5,677
18,058
17,983
19.2
44,792
27.2
18.3
11,744
33,047
1,075
7,450
39,422
0
39,422
9,987
553
26.7
7,442
21,441
21,441
19.2
59,115
32.0
20.6
12,956
46,158
1,075
7,700
52,783
0
52,783
14,211
568
28.0
9,778
28,226
28,226
31.6
Balance Sheet
Y/E December
Equi ty Sha re Ca pi ta l
Tota l Res erves
Net Worth
Deferred Li a bi l i ti es
Mi nori ty Interes t
Tota l Loa ns
Capital Employed
Goodwi l l
Gros s Bl ock
Les s : Accum. Deprn.
Net Fixed Assets
Ca pi ta l WIP
Inves tments
Curr. Assets
Inventory
Account Recei va bl es
Ca s h a nd Ba nk Ba l a nce
Others
Curr. Liability & Prov.
Account Pa ya bl es
Provi s i ons
Net Current Assets
Appl. of Funds
E: MOSL Es ti ma tes
2011
3,069
77,626
80,694
6,436
466
87,597
(INR Million)
2012
2013
2014E
2015E
2016E
3,084
3,951
3,951
3,951
3,951
84,966 171,682 181,662 194,127 213,377
88,051 175,633 185,613 198,078 217,328
10,716 11,425 12,280 13,255
4,553 10,230 17,672 27,450
395
292
500
500
500
93,929 191,193 207,768 228,529 258,533
7,082 46,721 46,721 46,721
206,851 219,996 251,996 275,246
91,186 101,908 113,652 126,608
115,665 118,088 138,343 148,637
15,145 29,000 25,000 36,000
39,825 11,618 18,490 30,495
5,483
97,023 101,836
35,158 43,213
61,865 58,624
4,868
5,201
8,643 16,558
40,043
9,250
2,409
20,691
7,694
27,822
15,909
11,913
12,221
87,597
43,864 79,947 72,800 79,509 89,314
9,839 20,554 23,744 26,869 31,439
2,134
6,287
5,936
6,717
7,860
22,537 28,445 21,861 21,861 21,861
9,353 24,661 21,258 24,061 28,154
30,318 66,471 70,459 79,533 92,633
15,904 43,761 41,570 46,869 54,412
14,414 22,709 28,889 32,665 38,221
13,545 13,477
2,341
-25
-3,320
93,929 191,193 207,768 228,529 258,533
Sector Update: Cement | May 2014
54

Ambuja Cements: Financials (Consolidated)
Ratios
Y/E December
Basic (INR)
EPS
Ca s h EPS
BV/Sha re
DPS
Pa yout (%)
Valuation (x)
P/E
Ca s h P/E
P/BV
EV/Sa l es
EV/EBITDA
EV/Ton (Ca p) - US$
Di vi dend Yi el d (%)
Return Ratios (%)
RoE
RoCE
Working Capital Ratios
As s et Turnover (x)
Debtor (Da ys )
Worki ng Ca pi ta l Turnover (Da ys
Leverage Ratio (x)
Current Ra ti o
Debt/Equi ty
2011
8.2
11.1
52.4
3.2
46.7
25.5
18.8
4.0
3.4
14.7
176
1.5
16.3
23.2
1.0
10
52
1.4
0.0
2012
10.0
13.5
56.9
3.5
49.8
20.8
15.4
3.7
2.9
11.2
168
1.7
18.3
27.6
1.0
8
51
1.4
0.0
2013
7.6
13.0
88.8
3.6
49.9
27.3
16.0
2.3
2.4
15.5
133
1.7
11.5
20.8
1.0
11
25
1.2
0.0
2014E
2015E
2016E
Cash Flow Statement
Y/E December
Op. Profi t/(Los s ) before Ta x
Interes t/Di vi dends Recd.
Di rect Ta xes Pa i d
(Inc)/Dec i n WC
CF from Operations
EO Income
CF from Op. incl EO Exp
(i nc)/dec i n FA
(Pur)/Sa l e of Inves tments
CF from Investments
Is s ue of Sha res
(Inc)/Dec i n Debt
Interes t Pa i d
Di vi dend Pa i d
CF from Fin. Activity
Inc/Dec of Cash
Add: Begi nni ng Ba l a nce
Closing Balance
E: MOSL Es ti ma tes
2011
20,260
1,555
-4,722
-203
16,890
0
16,890
-6,233
196
-6,037
462
738
-251
-5,697
-4,748
6,105
16,482
22,586
2012
25,393
2,340
-6,399
-417
20,917
0
20,917
2013
29,165
8,923
-8,082
5,976
35,981
5,706
41,687
2014E
(INR Million)
2015E
2016E
9.1
14.5
93.8
5.0
55.6
22.9
14.3
2.2
2.4
13.8
141
2.4
10.0
18.4
1.0
10
4
1.0
0.0
10.9
16.8
100.1
5.5
56.0
19.2
12.4
2.1
2.1
10.7
133
2.6
11.2
21.1
1.1
10
0
1.0
0.0
14.3
20.8
109.9
5.5
43.9
14.6
10.0
1.9
1.7
7.8
126
2.6
13.6
25.9
1.1
10
-4
1.0
0.0
35,213
8,850
-8,642
4,552
39,974
102
40,076
-27,000
28,206
1,206
0
918
-1,066
-8,078
-8,227
33,055
28,445
61,500
44,792
7,450
-10,539
2,365
44,068
0
44,068
-28,000
-6,871
-34,871
0
854
-1,075
-8,976
-9,197
0
21,861
21,861
59,115
7,700
-14,779
3,295
55,330
0
55,330
-34,250
-12,005
-46,255
0
976
-1,075
-8,976
-9,075
0
21,861
21,861
-6,870 -77,625
601 -23,266
-6,269 -100,891
831
-636
-275
-4,964
-5,044
9,604
20,691
30,295
74,695
5,130
-1,168
-6,463
72,194
12,990
22,537
35,527
Sector Update: Cement | May 2014
55

UltraTech Cement: Well prepared for the upcycle
Financials & Valuation (INR b)
Y/E March
2014 2015E
Sa l es
EBITDA
NP
Adj EPS (INR)
EPS Gr. (%)
BV/Sh (INR)
RoE (%)
RoCE (%)
Pa yout (%)
Valuation
P/E (x)
P/BV (x)
EV/EBITDA (x)
EV/Ton (USD)
200.8
36.2
20.7
75.6
-21.2
623.5
12.8
14.4
13.5
30.0
3.6
16.2
167
233.2
46.3
26.0
94.9
25.5
706.7
14.3
16.5
12.2
23.9
3.2
12.8
169
2016E
271.4
58.2
32.9
119.9
26.4
813.8
15.8
19.0
10.7
18.9
2.8
10.3
163
2017E
318.0
75.2
43.2
157.4
31.3
957.3
17.8
22.5
8.9
14.4
2.4
7.4
151
Stock info
Equi ty Sha res (m)
52-Week Ra nge (INR)
1,6,12 Rel . Perf. (%)
M.Ca p. (INR b)
M.Ca p. (USD b)
274.0
2465/1405
0/1/-10
620.5
10.5
Well prepared for the upcycle
UTCEM, being the largest cement company with ~66mt of domestic capacity by FY16 (v/s
58.6mt in FY14) including Jaypee’s 4.8mt of Gujarat plant takeover and 2.9mt of Rajasthan
brownfield expansion, offers the best play on structural demand recovery. With strongest focus
on market share among large cap peers, it has increased capacity ahead of competition by
~20% (9.8mt) over FY12-14 and further expansion of 13% over FY14-16. Recently added
capacities are operating at low utilizations and thus, significant volume lever are in place.
Superior profitability to large cap peers
Pricing premium, and superior cost structure and presence in white cement business enable to
command superior profitability among large cap peers. The company is also investing in various
cost savings measures, which will continue to drive profitability over next 2-3 years viz. sea
mode of transportation to 8% from 3% currently by doubling jetty capacity at Gujarat plant by
March-15, increasing usage of alternate fuel from 2-3% to 6%, WHRS usage to 10% of power
requirement from 1-2% currently. It has allocated INR20-25b of capex for FY15-16 for such
initiative along with modernization and up-gradation of plants.
Significant cost levers on the cards to improve profitability in Jaypee Plant
Jaypee transaction should derive meaningful synergistic benefits -- (1) brand premium of
INR200-300/ton, (2) savings on freight cost led by cement/clinker swap and market
realignment, (3) market consolidation, with over 30% market share (~49% capacity share) for
UTCEM to aid pricing power, (4) better trade non-trade mix, and (5) tax savings on carry
forward loss of INR3.5b (as per the management). UTCEM would only be utilizing accumulated
tax benefits (INR5.8b) only after 2 years as it would be under MAT due higher depreciation on
its new plants. EBITDA/ton to improve from INR150/ton to INR800/ton.
Upgrade to Buy on strong volume levers:
Based on preliminary estimates for consolidation of
Jaypee's Gujarat plant, the stock trades at 18.8x/13.2x FY16/17 EPS, 10.2/7.4x EV/EBITDA and
USD161/150 per ton. Current valuations partially factors in for potential recovery in FY15-17.
Upgrade to Buy with TP of INR2,873
(FY16 EV/ton of USD200/ton, ~50% upside to replacement
cost) on the back strong volume levers the market leader can enjoy.
Base case upside 27%
56
Sector Update: Cement | May 2014

UltraTech Cement: Well prepared for the upcycle
§
Our estimates can see upgrades driven by cost savings based on ~INR25b investment in modernization and upgradation
§
in existing plants. We are not factoring in any savings due to limited visibility on it.
While our base case factors in for price increase of ~INR15/bag in FY16, in bull case (~INR30/bag price increase in FY17),
UTCEM’s TP can be ~INR3,668 (implied EV/Ton of ~USD256 at 10x EV/EBITDA).
FY16 performance sensitivity to cement price change
Price
Change
(INR/Ton)
-100
0
100
250
300
400
500
EBITDA/Ton
(INR/Ton)
813
912
1,011
1,159
1,208
1,307
1,405
EPS
74
87
100
120
127
140
153
PE (x)
30.7
26.1
22.6
18.9
17.9
16.2
14.8
EV/EBITDA
(x)
15.0
13.3
11.9
10.3
9.8
9.0
8.3
EV/Ton
(US$)
166
165
164
163
163
162
161
TP
(INR/sh)
2,003
2,252
2,500
2,873
2,997
3,246
3,494
EV/Ton at
Upside (%)
TP (USD)
140
157
174
200
209
226
244
-12
-1
10
27
32
43
54
Trend in EV/EBITDA (x)
FY17 performance sensitivity to cement price change
Price
Change
(INR/Ton)
0
100
200
300
400
500
600
EBITDA/Ton
(INR/Ton)
1,067
1,165
1,264
1,363
1,462
1,560
1,659
EPS
(INR)
115
129
143
157
172
186
200
PE (x)
19.7
17.5
15.8
14.4
13.2
12.2
11.3
EV/EBITDA
(x)
9.6
8.7
8.0
7.4
6.8
6.3
5.9
EV/Ton
(US$)
154
153
152
151
150
149
148
Trend in EV/ton (USD)
TP
(INR/sh)
2,384
2,598
2,812
3,026
3,240
3,454
3,668
EV/Ton at
Upside (%)
TP (USD)
166
181
196
211
226
241
256
5
15
24
34
43
53
62
Sector Update: Cement | May 2014
57

UltraTech Cement: Operational snapshot
Steady and Pan India market mix to remain intact with
secular expansion across regions (%)
North
South
West
East
Central
Pan India volume
mix (%)
Central
12% North
18%
South
23%
West
30%
Recent expansion aids strong volume levers
83
Capacity (MT)
71
21.9
18.2
FY09
48.8
34.7
FY10
49.4
34.7
FY11
49.4
40.7
FY12
51.5
40.7
FY13
59.1
41.5
FY14
59.1
45.5
FY15E
83
70
Dispatches (MT)
79
70
77
Cap. Util (%)
89
81
11
14
26
26
23
FY14
8
17
27
26
21
FY16E
East
17%
62.0
50.0
FY16E
62.0
54.9
FY17E
Cost savings and positive operating
leverage to drive EBITDA/ton (INR)
Trend in capital efficiencies (%)
RoE
RoCE
22.5
981
939
1,090
730
970
FY13
859
1,352
1,148
29.2 28.5
31.0
21.1
26.6
23.5 21.3
14.4 16.5
19.0
1,003
FY15E
FY17E
FY09
18.4 20.5 18.7
15.8 17.8
12.8 14.3
FY15E
FY17E
FY09
FY11
FY11
FY13
Negligible net debt despite acquisition of Jaypee deal
Net debt (INR b)
CWIP as % of CE
16
2
0.0
FY12
10
2
-5
0.0
FY13
0.0
FY14
FY15E
FY16E
13
11
0.1
37
0.2
22
3
7
-10
0.0
FY17E
Impact of acquisition of JPA's Gujarat plant on UTCEM (Provisional)
INR m
FY15E
FY16E
FY17E
Ca pa ci ty
4.8
4.8
4.8
Uti l i za ti on (%)
77
83
89
Vol umes
3.7
4.0
4.3
Bl endi ng (x)
Revenues
16,056
18,333
20,873
Rea l i za ti on (INR/ton)
4,366
4,616
4,866
EBITDA
2,799
3,768
4,864
EBITDA (INR/ton)
761
949
1,134
EBITDA (%)
17.4
20.6
23.3
Depreci a ti on
1,959
1,959
1,959
Interes t
3,468
3,468
3,468
PBT
-2,628
-1,659
-563
PAT
-2,628
-1,659
-563
Ul tra Tech's PBT pre-dea l
34,923
45,363
61,237
Ul tra Tech's PBT pos t-dea l
32,295
43,704
60,674
Cha nge i n PBT (%)
-7.5
-3.7
-0.9
Ta x
8,235
10,569
13,549
Ul tra Tech's EPS pre-dea l
95
120
158
EPS pos t-dea l
88
121
171
Cha nge i n EPS (%)
-7.8
0.4
8.8
Sector Update: Cement | May 2014
58

UltraTech Cement: Financials
Income Statement
Y/E March
Net Sales
Cha nge (%)
Tota l Expendi ture
% of Sa l es
EBITDA
Ma rgi n (%)
Depreci a ti on
EBIT
Int. a nd Fi na nce Cha rges
Other Income - Rec.
PBT
EO Expens e/(Income)
PBT after EO expense
Ta x
Ta x Ra te (%)
Reported PAT
Adj PAT
Cha nge (%)
(INRMillion)
2014
2015E
2016E
2017E
2012
2013
181,664 199,991
200,779 233,190 271,412
317,983
0.4
16.1
16.4
17.2
37.6
10.1
141,625 155,045
164,619 186,900 213,236
242,800
82.0
80.1
78.6
76.4
78.0
77.5
40,039
22.0
9,026
31,013
2,239
4,568
33,343
-666
34,009
9,467
27.8
24,542
24,062
71.4
44,946
22.5
9,454
35,492
2,097
4,620
38,015
0
38,015
11,700
30.8
26,315
26,315
9.4
36,160
18.0
10,523
25,637
3,192
5,310
27,755
-956
28,711
7,266
25.3
21,445
20,731
-21.2
46,291
19.9
12,398
33,893
3,570
4,600
34,923
0
34,923
8,905
25.5
26,018
26,018
25.5
58,177
21.4
14,418
43,759
3,396
5,000
45,363
0
45,363
12,475
27.5
32,888
32,888
26.4
Balance Sheet
Y/E March
Equi ty Sha re Ca pi ta l
Res erves
Net Worth
Deferred l i a bi l i ti es
Loa ns
Capital Employed
Gros s Bl ock
Les s : Accum. Deprn.
Net Fixed Assets
Ca pi ta l WIP
Inves tments
Curr. Assets
Inventory
Debtors
Ca s h & Ba nk Ba l
Others
Curr. Liability & Prov.
Credi tors
Provi s i ons
Net Current Assets
Appl. of Funds
E: MOSL Es ti ma tes
2014
2015E
2012
2013
2,742
2,742
2,741
2,742
125,858 149,606
168,233 191,064
128,598 152,348
170,975 193,806
(INR Million)
2016E
2017E
2,742
2,742
220,447
259,795
223,189
262,538
24668
17378
19059
22958
23308
27730
75,183
23.6
15,886
59,297
3,060
5,000
61,237
0
61,237
18,065
29.5
43,172
43,172
31.3
41,529 54,085
51,993 49,993 44,993
39,993
187,505 225,493
245,927 267,107 292,851
330,261
190,138 213,822
240,256 281,756 331,756
344,256
73,797 82,599
93,121 105,519 119,936
135,823
116,342 131,224
147,134 176,237 211,819
208,433
18,965 35,054
32,000 30,000 10,000
22,500
37,888 51,087
53,917 22,475 27,475
27,475
56,257
20,359
7,660
1,896
26,342
41,947
33,740
8,207
14,310
56,723
23,505
10,172
1,427
21,619
48,595
37,903
10,692
8,128
64,489
23,684
12,810
2,775
25,220
51,614
41,884
9,730
12,875
95,255
28,750
9,583
28,173
28,750
56,860
47,277
9,583
38,395
109,737
33,462
11,154
31,659
33,462
66,180
55,026
11,154
43,557
149,389
39,203
13,068
57,914
39,203
77,536
64,468
13,068
71,853
187,505 225,493
245,926 267,107 292,851
330,261
Sector Update: Cement | May 2014
59

UltraTech Cement: Financials
Ratios
Y/E March
Basic (INR)
EPS
Ca s h EPS
BV/Sha re
DPS
Pa yout (%)
Valuation (x)
P/E
Ca s h P/E
P/BV
EV/Sa l es
EV/EBITDA
EV/Ton (Ca p-USD)
Di vi dend Yi el d (%)
Return Ratios (%)
RoE
RoCE
Working Capital Ratios
Fi xed As s et Turnover (x)
Debtor (Da ys )
Credi tor (Da ys )
Inventory (Da ys )
Worki ng Ca pi ta l Turnover (Da
Leverage Ratio
Current Ra ti o
Interes t Cover Ra ti o
Debt/Equi ty
2012
87.8
120.7
469.2
8.0
10.4
25.8
18.8
4.8
3.3
15.1
207
0.4
20.5
23.5
1.0
15
68
41
29
1.3
13.9
0.3
2013
96.0
130.5
555.7
9.0
11.0
23.6
17.4
4.1
2.9
13.1
193
0.4
18.7
21.3
1.1
19
69
43
15
1.2
16.9
0.4
2014
75.6
114.0
623.5
9.0
13.5
2015E
94.9
140.1
706.7
10.0
12.2
2016E
119.9
172.5
813.8
11.0
10.7
2017E
157.4
215.4
957.3
12.0
8.9
14.4
10.5
2.4
1.7
7.4
151
0.5
17.8
22.5
1.1
15
74
45
82
1.9
19.4
0.2
Cash Flow Statement
Y/E March
Op. Profi t/(Los s ) before Ta x
Interes t/Di vi dends Recd.
Di rect Ta xes Pa i d
(Inc)/Dec i n WC
CF from Operations
2012
41,304
478
-7,340
158
34,600
2013
46,244
566
-7,165
-3,887
35,759
32
35,727
-32,676
-10,349
-43,025
79
12,557
-3,268
-2,539
6,829
-469
1,896
1,427
2014
36,160
5,310
-3,367
-3,399
34,704
-956
35,660
-23,380
-2,830
-26,209
69
-2,092
-3,192
-2,887
-8,102
1,349
1,427
2,775
2015E
46,291
4,600
-8,556
-122
42,213
0
42,213
-39,500
31,441
-8,059
0
-2,000
-3,570
-3,187
-8,756
25,398
2,775
28,173
(INR Million)
2016E
2017E
58,177
75,183
5,000
5,000
-11,114
-15,003
-1,675
-2,041
50,387
63,139
0
50,387
-30,000
-5,000
-35,000
0
-5,000
-3,396
-3,505
-11,901
3,486
28,173
31,659
EO expens e
22
CF from Operating incl EO expen 34,578
(i nc)/dec i n FA
(Pur)/Sa l e of Inves tments
CF from investments
Is s ue of Sha res
(Inc)/Dec i n Debt
Interes t Pa i d
Di vi dend Pa i d
CF from Fin. Activity
Inc/Dec of Cash
Add: Begi nni ng Ba l a nce
Closing Balance
E: MOSL Es ti ma tes
-31,575
2,159
-29,416
16
83
-2,907
-1,905
-4,714
448
1,448
1,896
0
63,139
-25,000
0
-25,000
0
-5,000
-3,060
-3,824
-11,884
26,255
31,659
57,914
30.0
19.9
3.6
2.9
16.2
167
0.4
23.9
16.2
3.2
3
12.8
169
0.4
18.9
13.1
2.8
2
10.3
163
0.5
12.8
14.4
14.3
16.5
15.8
19.0
1.2
23
76
43
23
1.2
15
74
45
60
1.2
15
74
45
59
1.2
8.0
0.3
1.7
9.5
0.3
1.7
12.9
0.2
Sector Update: Cement | May 2014
60

Shree Cement: In top league
Financials & Valuation (INR b)
Y/E June
2014 2015E
Sa l es
57.5
68.3
EBITDA
13.7
17.4
NP
7.9
9.0
Adj EPS (INR)
275.2 325.5
EPS Growth (%)
-12.6
18.3
BV/Sha re (Rs )
1,301 1,528
RoE (%)
18.8
18.2
RoCE (%)
18.9
20.8
Pa yout (%)
12.4
11.7
Valuation
P/E (x)
24.8
21.0
P/BV (x)
5.2
4.5
EV/EBITDA (x)
16.5
13.0
EV/Ton (USD)
187
165
2016E
80.3
21.8
11.7
432.4
32.8
1,830
20.1
22.9
10.3
15.8
3.7
9.6
156
2017E
94.5
27.8
16.2
567.8
31.3
2,260
22.7
26.6
7.5
12.0
3.0
6.8
141
Superior operating performance, absolute EBITDA in large cap zone
SRCM’s absolute EBITDA of INR15b in FY14E (cement EBITDA of ~INR14b) is getting closer to
large cap peers like ACC/ACEM (~INR19b in CY14) and is 2x the EBITDA of the next largest
player (TRCL). This, coupled with superior operating performance (EBITDA/ton 20-25%
premium to large cap average), strengthening market mix, steady scale-up in size and strong
balance sheet should help it to command big league valuations. Historically, ACEM had seen
similar re-rating during FY02-06 based on scale-up in operations.
Differentiated expansion strategy helped attain critical mass
SRCM demonstrated a differentiated expansion strategy, with regular capacity additions at
higher frequency but of smaller magnitude. This enabled it to (1) expand systematically as per
market demand, (2) achieve faster project turnaround and quick stabilization, and (3) drive
growth with minimum pressure on balance sheet. Its Chhattisgarh greenfield expansion of
2.5m tons would take total capacity to ~22m tons by June 2015. We believe SRCM has
attained critical mass. It can grow capacity by 10-12% annually based on sustainable OCF.
Market mix to improve, operating advantage to be maintained
The Chhattisgarh expansion, through which SRCM would enter East India, is likely to aid
diversification in market mix. Cost leadership and superior profitability would persist over the
medium term. We expect SRCM to generate operating cash flow of ~INR53b over FY14-16 v/s
capex need of ~INR33b. Hence, it would be able to drive growth without impacting its
balance sheet.
Strong case for permanent re-rating; Buy
SRCM’s superior profitability and consistent operating strength make a strong case for
structural re-rating in asset valuation. The stock trades at 9.6x/6.8x FY16/17E EV/EBITDA, and
USD156/141 per ton. We value SRCM at US$ 190x FY16E Cement EV/ton and DCF for power
business, translating into a target price of INR8,034. Lower payout and delay in volume
recovery could be key deterrents to a re-rating.
Maintain Buy
with base case upside of 18%.
Stock info
Equity Shares (m)
52-Wk Range (INR)
1,6,12 Rel. Perf. (%)
M.Cap. (INR b)
M.Cap. (USD b)
34.8
7,129/3,413
9/36/14
237.7
4.0
Sector Update: Cement | May 2014
61

Shree Cement: In top league
§
While our base case factors in for price increase of ~INR15/bag in FY17, in bull case (~INR30/bag price increase in FY17),
§
SRCM’s TP can be ~INR10,390 (implied EV/Ton of ~USD232).
Scale up capacity, superior profitability and consistent operating strength will lead to re-rating in asset valuation
Trend in EV/EBITDA (x)
TP
(INR/sh)
5,821
6,453
7,086
8,034
8,350
8,983
9,615
EV/Ton at
Upside (%)
TP (USD)
135
151
166
190
198
214
230
-15
-5
4
18
22
32
41
FY16 performance sensitivity to cement price change
Price
Change
(INR/Ton)
-100
0
100
250
300
400
500
EBITDA/Ton
(INR/Ton)
851
951
1,051
1,201
1,251
1,351
1,451
EPS
293
333
373
432
452
492
532
PE (x)
23.3
20.5
18.3
15.8
15.1
13.9
12.8
EV/EBITDA
(x)
13.8
12.3
11.1
9.6
9.2
8.5
7.9
EV/Ton
(US$)
160
159
157
156
155
154
153
FY17 performance sensitivity to cement price change
Price
Change
(INR/Ton)
0
100
200
300
400
500
600
Trend in EV/ton (USD)
TP
(INR/sh)
6,988
7,555
8,122
8,689
9,256
9,823
10,390
EBITDA/Ton EPS
(INR/Ton) (INR)
1,078
1,178
1,278
1,378
1,478
1,578
1,678
434
478
523
568
612
657
702
PE (x)
15.7
14.3
13.0
12.0
11.1
10.4
9.7
EV/EBITDA
(x)
8.9
8.1
7.4
6.8
6.3
5.9
5.5
EV/Ton
(US$)
144
143
142
141
139
138
137
EV/Ton at
Upside (%)
TP (USD)
148
162
176
190
204
218
232
2
11
19
27
36
44
52
Sector Update: Cement | May 2014
62

Shree Cement: uptick in profitability key to structural re-rating
Cost leadership (INR/ton) attributable to energy efficiencies…
ACC
ACEM
Ultratech
SRCM
…leading to superior profitability in large cap universe (EBITDA/ton in INR)
ACC
ACEM
Ultratech
SRCM
FY11
FY12
FY13
FY14E
FY15E
FY16E
FY17E
FY11
FY12
FY13
FY14
FY15E
FY16E
FY17E
Absolute EBITDA (INR b) at par with large peers
ACC
ACEM
SCRM (Pure cement)
25
SCRM (incl Power)
Strong OCF offers critical mass to grow 10-12% internally (INR b)
30
15
0
-15
-30
OCF
Capex
FCF
5
30 28
23 22
27
20
19
19 17
21 30
19
18
18
15 15 14
15 18
25 14
14
17
13
13
13
9
16
9
8
20
19 9
9
17 9
8 17
16 6
6
16
22
2
2
14
FY07
FY08
FY09
FY10
FY11
FY12
FY13 FY14E FY15E FY16E FY17E
FY06
SRCM started trading at large cap EV/ton – a structural re-rating
300
200
100
0
ACC
ACEM
UltraTech
SRCM
§
SRCM scores on superior operating performance,
successful differentiated expansion strategy and
exemplary gradual leap into large cap zone. It should
continue to offer strong comfort in cement up-cycle, with
meaningful levers in utilization and best-in-class cost
management.
Sector Update: Cement | May 2014
63

Shree Cement: Operational snapshot
Capacity mix (%): From North-only presence to expansion
into East as well
North
East
Current volume mix (%)
Systematic expansion in tandem with volume growth; drop in
utilization offers enough growth avenues
Capacity (mt)
94
94
85 78
Dispatch (mt)
Utilization (%)
Central
28%
East
0%
West
0%
North
72%
21
100
88
90
76
80
70
68
80
79
FY13
FY15E
South
0%
FY07
FY08
FY09
FY10
FY11
FY12
FY13
FY14E FY15E FY16E FY17E
SRCM enjoys one of the lowest variable manufacturing cost…
RM+Energy Cost (INR/Ton)
899
991
1017
1074
861
872
919
969
…driving premium EBITDA peers
Cement EBITDA/ton
107
53
1,306
1,061
FY09
1,359
FY10
810
FY11
62
1,077
FY12
200
1,034
FY13
56
923
FY14E
43
1,068
FY15E
Power EBITDA/ton
33
836
845
39
1,201
FY16E
1,378
FY17E
FY08
FY09
FY10
FY11
FY12
FY13
FY14E
FY15E
FY16E
FY17E
FY08
Return ratios healthy despite steady capex and net cash B/S (%)
80
60
40
20
0
FY08
FY09
FY10
FY11
FY12
FY13
FY14E
FY15E
FY16E
FY17E
RoE
RoCE
Strong B/S offers critical mass to grow sustainably
40
20
0
-20
-40
-60
FY08
FY09
FY10
FY11
FY12
FY13 FY14E FY15E FY16E FY17E
Net debt (INR b)
CWIP as % CE
DER (x)
0.8
0.4
0.0
-0.4
-0.8
Sector Update: Cement | May 2014
64

Shree Cement: Financials
Income Statement
Y/E June
Net Sales
Cha nge (%)
Tota l Expendi ture
% of Sa l es
EBITDA
Ma rgi n (%)
Depri ci a ti on
EBIT
Int. a nd Fi na nce Cha rges
Other Income - Rec.
PBT before EO Expense
EO Expens e/(Income)
PBT a fter EO Expens e
Ta x
Deferred Ta x
Ta x Ra te (%)
Reported PAT
Adj PAT for EO items
Cha nge (%)
Ma rgi n (%)
Normal PAT *
2012
47,806
38.4
33,941
71.0
13,865
29.0
7,133
6,732
1,878
1,471
6,325
41
6,284
649
10.3
5,635
5,671
119.7
11.9
9,558
2013
55,671
16.5
40,293
72.4
15,378
27.6
4,356
11,022
1,931
2,114
11,205
11
11,194
1,155
10.3
10,040
10,049
77.2
18.1
11,017
2014E
57,494
3.3
43,775
76.1
13,719
23.9
5,600
8,119
1,378
2,000
8,741
0
8,741
878
10.1
7,862
7,862
-21.8
13.7
9,775
2015E
68,302
18.8
50,858
74.5
17,444
25.5
6,581
10,863
1,646
2,150
11,367
0
11,367
2,387
21.0
8,980
8,980
14.2
13.1
10,807
(INR Million)
2016E
80,257
17.5
58,450
72.8
21,807
27.2
7,807
14,000
1,646
2,500
14,854
0
14,854
3,119
21.0
11,735
11,735
30.7
14.6
13,902
2017E
94,530
17.8
66,751
70.6
27,779
29.4
8,158
19,621
1,646
2,500
20,475
0
20,475
4,300
21.0
16,175
16,175
37.8
17.1
18,324
Balance Sheet
Y/E June
Equi ty Sha re Ca pi ta l
Other Res erves
Tota l Res erves
Net Worth
Deferred Li a bi l i ti es
Secured Loa n
Uns ecured La on
Tota l Loa ns
Capital Employed
Gros s Bl ock
Les s : Accum. Deprn.
Net Fixed Assets
Ca pi ta l WIP
Inves tments
Curr. Assets
Inventory
Account Recei va bl es
Ca s h a nd Ba nk Ba l a nce
Others
Curr. Liability & Prov.
Account Pa ya bl es
Provi s i ons
Net Current Assets
Appl. of Funds
2012
348
26,991
26,991
27,339
-697
16,079
532
16,611
43,253
50,564
35,886
14,678
1,500
25,352
17,499
5,033
1,811
4,590
6,065
15,776
13,822
1,954
1,723
43,253
2013
348
38,088
38,088
38,436
-938
11,274
0
11,274
48,773
56,895
40,242
16,653
2,500
22,033
19,478
5,305
3,147
3,694
7,333
11,891
10,841
1,050
7,587
48,773
2014E
348
44,972
44,972
45,321
-1633
11,274
1,000
12,274
55,962
62,895
45,842
17,053
8,500
22,033
20,678
6,301
2,757
1,382
10,239
12,302
11,026
1,276
8,376
55,962
2015E
348
52,900
52,900
53,248
-1633
13,274
1,000
14,274
65,889
79,395
52,423
26,972
10,000
22,033
21,703
6,924
3,275
2,710
8,795
14,819
13,099
1,720
6,885
65,889
(INR Million)
2016E
348
63,420
63,420
63,769
-1633
11,774
1,000
12,774
74,910
89,395
60,230
29,165
2,500
22,033
38,770
8,136
3,848
17,992
8,795
17,559
15,392
2,167
21,212
74,910
2017E
348
78,381
78,381
78,730
-1633
10,274
1,000
11,274
88,371
91,895
68,388
23,507
2,500
22,033
61,217
9,583
4,532
36,743
10,359
20,886
18,129
2,757
40,331
88,371
E: MOSL Estimates; ^ Y/E March; * Adj for accelerated depn & EO items
Sector Update: Cement | May 2014
65

Shree Cement: Financials
Ratios
Y/E June
Basic (INR)
Normal EPS *
Ca s h EPS
BV/Sha re
DPS
Pa yout (%)
Valuation (x)
P/E
Ca s h P/E
P/BV
EV/Sa l es
EV/EBITDA
EV (US$)
EV/ton (USD-Ca p)
Di vi dend Yi el d (%)
Return Ratios (%)
RoE
RoCE
Working Capital Ratios
Inventory (Da ys )
Debtor (Da ys )
Worki ng Ca pi ta l Turnover (Da
Leverage Ratio (x)
Current Ra ti o
Debt/Equi ty
2012
274.4
479.1
784.8
20.0
14.5
24.9
14.2
8.7
5.2
16.2
3,613
268
0.3
24.0
19.6
38
14
13
1.1
0.6
2013
314.9
441.3
1,103.3
20.0
8.1
21.7
15.5
6.2
4.4
14.5
3,577
219
0.3
30.6
28.1
35
21
50
1.6
0.3
2014E
275.2
441.3
1,300.9
24.0
12.4
24.8
15.5
5.2
4.3
16.5
3,573
187
0.4
18.8
18.9
40
18
53
1.7
0.3
2015E
325.5
499.1
1,528.5
26.0
11.7
21.0
13.7
4.5
3.6
13.0
3,573
165
0.4
18.2
20.8
37
18
37
1.5
0.3
2016E
432.4
623.1
1,830.5
30.0
10.3
15.8
10.9
3.7
2.9
9.6
3,427
156
0.4
20.1
22.9
37
18
96
2.2
0.2
2017E
567.8
760.2
2,259.9
30.0
7.5
12.0
9.0
3.0
2.2
6.8
3,094
141
0.4
22.7
26.6
37
18
156
2.9
0.1
Oper. Profi t/(Los s ) before Ta x
Interes t/Di vi dends Recd.
Di rect Ta xes Pa i d
(Inc)/Dec i n WC
CF from Operations
(i nc)/dec i n FA
(Pur)/Sa l e of Inves tments
CF from investments
Is s ue of Sha res
(Inc)/Dec i n Debt
Interes t Pa i d
Di vi dend Pa i d
CF from Fin. Activity
Inc/Dec of Cash
Add: Begi nni ng Ba l a nce
Closing Balance
Cash Flow Statement
2012
13,865
1,471
-564
6,173
20,945
-4,350
-13,387
-17,738
2,617
-3,468
-1,878
-815
-3,544
-337
4,987
4,590
2013
15,368
2,114
-2,198
-5,957
9,326
-7,331
3,319
-4,012
1,867
-5,337
-1,931
-810
-6,211
-896
4,590
3,693
2014E
13,719
2,000
-1,573
-3,101
11,045
-12,000
0
-12,000
0
1,000
-1,378
-978
-1,356
-2,311
3,694
1,382
2015E
17,444
2,150
-2,387
2,819
20,026
-18,000
0
-18,000
0
2,000
-1,646
-1,052
-698
1,327
1,382
2,710
(INR Million)
2016E
21,807
2,500
-3,119
955
22,142
-2,500
0
-2,500
0
-1,500
-1,646
-1,214
-4,360
15,282
2,710
17,992
2017E
27,779
2,500
-4,300
-368
25,611
-2,500
0
-2,500
0
-1,500
-1,646
-1,214
-4,360
18,751
17,992
36,743
E: MOSL Estimates; ^ Y/E March; * Adj for accelerated depreciation & EO items
Sector Update: Cement | May 2014
66

Birla Corp: Deep value, but ownership issue long overhang
Financials & Valuation (INR b)
Y/E MARCH
Sa l es
EBITDA
NP
Adj. EPS (INR)
EPS Gr. (%)
BV/Sh. (INR)
RoE (%)
RoCE (%)
Pa yout (%)
Valuations
P/E (x)
P/BV (x)
EV/EBITDA (x)
EV/Ton (x)
2014
29.7
2.1
1.3
16.9
-51.9
328.0
5.1
6.1
55.5
20.6
1.1
8.9
34
2015E
33.7
3.8
2.8
36.1
114.2
353.7
10.2
10.6
29.0
9.6
1.0
4.6
32
2016E
37.7
5.0
3.5
46.0
27.5
388.1
11.9
12.7
25.2
7.5
0.9
3.4
31
2017E
41.7
7.1
5.1
66.5
44.5
443.0
15.0
16.0
17.5
5.2
0.8
1.9
24
Market mix favorable
BCORP's sales mix is concentrated in North, Central and East India, where supply overhang is
lower. It posted strong dispatch growth (12% CAGR) over FY12-14, with permission for
mechanized mining at the Chanderia (Rajasthan) plant (without blast). This helped enhance
throughput in the last concluded expansion, taking utilization from 70% in FY13 to 80% in
FY14.
Delay in expansion plans may keep near-term volume growth modest
Both of BCORP’s expansion plans (Chanderia and greenfield plant at MP) were marred by
litigation, resulting in lower utilization levers till FY16. Recently, it has received (a)
environmental clearance for 1.5m tons at Chanderia. The board has approved setting-up of
three grinding/blending units in MP, one grinding unit in Bihar, and one blending unit each in
UP and Jharkhand, having aggregate capacity of ~4.5m tons, with estimated investment of
~INR9.5b.
Cost efficiencies diluting, investing in improving cost structure
BCORP had been a cost efficient cement producer due to superior fuel efficiency, higher share
of linkage coal in its fuel mix and low cost power (captive power of 66%). Shift towards open
market coal, increase in fixed costs and ban on limestone mining at Rajasthan plant had
impacted cost adversely (due to open market purchase of limestone and clinker), which is now
partially resolved post allowance of mechanized mining in FY14. Still, complete resolution of
the mining ban would be critical for normalization of profitability. Planned split
grinding/blending units are expected to drive logistics cost savings, improve quality and
increase BCORP’s competitiveness in the eastern market.
Deep value, but ownership issue long overhang
BCORP has a strong balance sheet, with net cash of INR7b as at FY14E, which offers comfort,
though expansion remains the avenue to deploy the same. It trades at 3.4x/1.9x FY16E/17E
EV/EBITDA and at USD31/24 on EV/ton. We value BCORP at INR486 (5.5x FY16E EV/EBITDA or
~USD50/ton). Maintain
Buy.
Lack of clarity of ownership is the key hurdle to a re-rating.
Stock info
Equi ty Sha res (m)
52-Week Ra nge (INR)
1,6,12 Rel . Perf. (%)
M.Ca p. (INR b)
M.Ca p. (USD m)
77.0
393/191
8/23/14
26.7
452.9
Sector Update: Cement | May 2014
67

Birla Corp: Deep value, but ownership issue long overhang
§
While our base case factors in for price increase of ~INR15/bag in FY17, in bull case (~INR30/bag price increase in FY17),
§
BCORP’s FY17 based TP can be ~INR695 (implied EV/Ton of ~USD70 at 4x EV/EBITDA).
Any progress towards subsiding of ownership overhang and deployment of surplus cash towards expansion should lead
to re-rating.
Trend in EV/EBITDA (x)
TP
(INR/sh)
244
313
382
486
521
590
660
FY16 performance sensitivity to cement price change
Price
Change
(INR/Ton)
-100
0
100
250
300
400
500
EBITDA/Ton
(INR/Ton)
365
465
565
715
765
865
965
EPS
17
25
34
46
50
58
67
PE (x)
20.1
13.6
10.3
7.5
6.9
6.0
5.2
EV/EBITDA
(x)
9.4
6.4
4.8
3.4
3.0
2.5
2.1
EV/Ton
(US$)
35
34
32
31
30
29
27
EV/Ton at
Upside (%)
TP (USD)
21
29
37
50
54
63
71
-30
-10
10
40
50
70
90
FY17 performance sensitivity to cement price change
Price
Change
(INR/Ton)
0
100
200
300
400
500
600
EBITDA/Ton
(INR/Ton)
627
727
827
927
1,027
1,127
1,227
EPS
(INR)
40.9
49.4
58.0
66.5
75.1
83.6
92.1
PE (x)
8.5
7.0
6.0
5.2
4.6
4.2
3.8
EV/EBITDA
(x)
3.5
2.8
2.3
1.9
1.6
1.3
1.2
EV/Ton
(US$)
28
27
26
24
23
22
20
Trend in EV/ton (USD)
TP
(INR/sh)
371
425
479
533
587
641
695
EV/Ton at
Upside (%)
TP (USD)
32
38
44
50
57
63
69
7
22
38
53
69
85
100
Sector Update: Cement | May 2014
68

Birla Corp: Operational snapshot
Favorable market mix (%)
North
37
25
40
Capacity mix
South
East
West
40
3
19
38
5.8 5.3
5.8 5.3
FY09
6.1 5.7
FY10
7.5 5.9
FY11
7.8 6.0
FY12
No expansion in FY13-16, utilization lever modest as partial lifting of
mining ban led to strong growth in FY14
Central
91
91
Capacity (mt)
93
79
86
76
70
9.3 6.5
FY13
9.3 7.4
FY14
9.3 8.0
FY15E
9.3 8.4
FY16E
9.3 8.8
FY17E
80
Dispatch (mt)
Utilization (%)
91
94
Volume mix
FY08
Historical EBITDA at premium to peers, but adversely impacted due to structural cost inflation due to shrinkage in linkage coal and mining
ban
3,620 3,703
Cement Cost (INR/Ton)
Cement EBITDA/ton
3,257
2,887
2,287
1089
FY08
819
FY09
1236
FY10
696
FY11
528
FY12
570
FY13
290
FY14
482
FY15E
596
FY16E
813
FY17E
1,912
FY08
FY09
FY10
FY11
FY12
FY13
FY14
FY15E
FY16E
FY17E
2,315
2,517
3,396
3,484
Expect gradual uptick in utilization to aid return ratios (%)
48
36
24
12
0
FY08
FY09
FY10
FY11
FY12
FY13
FY14
FY15E FY16E FY17E
RoE
RoCE
Strong B/S offers support to growth plan
Net debt (INR b)
12.7
-0.3
-5.2
-6.0
-0.5
FY09
-7.7
-0.4
FY10
FY11
FY12
FY13
15.3
-3.6
CWIP as % CE
-0.2
14.6
-0.1
-3.2
5.9
-0.3
DER (x)
-0.3
-0.2 5.3
9.4
-0.4
-3.9
FY08
8.6
5.8 -0.3
-7.0
2.6
-7.6
3.7
-7.4
-10.8
FY14
FY15E
FY16E
FY17E
Sector Update: Cement | May 2014
69

Birla Corp: Financials
Income Statement
Y/E March
Net Sales
Cha nge (%)
Tota l Expendi ture
EBITDA
Cha nge (%)
Ma rgi n (%)
Depreci a ti on
EBIT
Int. a nd Fi na nce Cha rges
Other Income - Rec.
PBT
Cha nge (%)
Ta x
Ta x Ra te (%)
PAT
Extra Ordi na ry Expens es
PAT Adj for EO Items
Cha nge (%)
Ma rgi n (%)
2012
22,469
5.8
19,345
3,124
-25.2
13.9
800
2,324
525
1,662
3,461
-20.9
1,068
30.9
2,392
0
2,392
-25.2
10.6
2013
25,638
14.1
22,101
3,536
13.2
13.8
1,044
2,493
649
1,663
3,507
1.3
809
23.1
2,698
0
2,698
12.8
10.5
2014
29,705
15.9
27,599
2,107
-40.4
7.1
1,326
781
856
1,598
1,523
-56.6
225
14.8
1,298
0
1,298
-51.9
4.4
2015E
33,671
13.3
29,865
3,806
80.7
11.3
1,433
2,373
842
1,944
3,475
128.2
695
20.0
2,780
0
2,780
114.2
8.3
(INR Million)
2016E
37,672
11.9
32,671
5,001
31.4
13.3
1,433
3,568
786
1,944
4,726
36.0
1,181
25.0
3,544
0
3,544
27.5
9.4
2017E
41,725
10.8
34,620
7,105
42.1
17.0
1,433
5,673
786
1,944
6,830
44.5
1,708
25.0
5,123
0
5,123
44.5
12.3
Balance Sheet
Y/E March
Equi ty Sha re Ca pi ta l
Res erves
Net Worth
Loa ns
Deferred Li a bi l i ti es
Capital Employed
Gros s Bl ock
Les s : Accum. Deprn.
Net Fixed Assets
Ca pi ta l WIP
Inves tments
Curr. Assets
Inventory
Account Recei va bl es
Ca s h a nd Ba nk Ba l a nce
Others
Curr. Liability & Prov.
Account Pa ya bl es
Provi s i ons
Net Current Assets
Appl. of Funds
E: MOSL Es ti ma tes
2012
770
21,664
22,434
11,243
1533
35,210
21968
8486
13,482
5139
10448
11,526
4171
372
4386
2597
5,386
4,744
642
6,140
35,210
2013
770
23,731
24,501
12,261
2,117
38,878
26,803
9,475
17,328
2,286
12,707
12,934
5,701
750
2,786
3,696
6,377
5,427
950
6,557
38,878
2014
770
24,491
25,261
11,302
2,342
38,905
30,589
10,801
18,614
1,000
13,340
15,266
5,151
747
5,011
4,357
9,315
8,357
958
5,951
38,905
2015E
770
26,465
27,235
11,163
2,342
40,740
33,089
12,233
20,855
1,500
13,340
16,799
5,724
673
5,397
5,004
11,754
10,775
979
5,045
40,740
(INR Million)
2016E
770
29,115
29,885
11,163
2,342
43,390
36,589
13,666
22,923
2,500
13,340
17,873
6,404
753
5,271
5,444
13,245
12,055
1,190
4,627
43,390
2017E
770
33,343
34,113
11,163
2,342
47,618
39,089
15,099
23,990
2,500
13,340
22,462
7,093
834
8,644
5,890
14,674
13,352
1,322
7,788
47,618
Sector Update: Cement | May 2014
70

Birla Corp: Financials
Ratios
Y/E March
Basic (INR)
EPS
Ca s h EPS
BV/Sha re
DPS
Pa yout (%)
Valuation (x)
P/E
Ca s h P/E
P/BV
EV/Sa l es
EV/EBITDA
EV/Ton - Ca p (USD)
Di vi dend Yi el d (%)
Return Ratios (%)
RoE
RoCE
Working Capital Ratios
Inventory (Da ys )
Debtor (Da ys )
Worki ng Ca pi ta l Turnover (Da
Leverage Ratio
Current ra ti o
Debt/Equi ty (x)
2012
31.1
41.5
291.3
6.0
22.6
11.2
8.4
1.2
0.8
5.8
39
1.7
10.7
11.3
2013
35.0
48.6
318.2
7.5
24.9
9.9
7.1
1.1
0.8
6.0
39
2.2
11.0
10.7
2014
16.9
34.1
328.0
6.0
55.5
20.6
10.2
1.1
0.6
8.9
34
1.7
5.1
6.1
2015E
36.1
54.7
353.7
9.0
29.0
9.6
6.3
1.0
0.5
4.6
32
2.6
10.2
10.6
2016E
46.0
64.6
388.1
10.0
25.2
7.5
5.4
0.9
0.4
3.4
31
2.9
11.9
12.7
2017E
66.5
85.1
443.0
10.0
17.5
5.2
4.1
0.8
0.3
1.9
24
2.9
15.0
16.0
Cash Flow Statement
Y/E March
Op.Profi t/(Los s ) before Ta x
Interes t/Di vi dends Recd.
Di rect Ta xes Pa i d
(Inc)/Dec i n WC
CF from Operations
CF from Oper. incl EO Items
(i nc)/dec i n FA
(Pur)/Sa l e of Inves tments
CF from Investments
(Inc)/Dec i n Debt
Interes t Pa i d
Di vi dend Pa i d
CF from Fin. Activity
Inc/Dec of Cash
Add: Begi nni ng Ba l a nce
Closing Balance
2012
3,124
1,662
-1,068
62
3,779
3,779
-4,778
1,244
-3,534
1,085
-525
-541
23
268
3,711
4,385
2013
3,536
1,663
-809
-2,016
2,375
2,375
-2,036
-2,259
-4,296
1,017
-649
-671
-263
-2,184
4,386
2,786
2014
2,107
1,598
-225
3,282
6,761
6,761
-1,777
-633
-2,410
-959
-856
-721
-2,352
1,999
2,786
4,786
2015E
3,806
1,944
-695
841
5,896
5,896
-3,723
0
-3,723
-139
-842
-805
-1,787
387
5,011
5,397
(INR Million)
2016E
5,001
1,944
-1,181
291
6,055
6,055
-4,500
0
-4,500
0
-786
-895
-1,681
-126
5,397
5,271
2017E
7,105
1,944
-1,708
213
7,554
7,554
-2,500
0
-2,500
0
-786
-895
-1,681
3,373
5,271
8,644
68
6
0.6
81
11
0.7
63
9
0.8
62
7
0.8
62
7
0.9
62
7
0.9
2.1
0.5
2.0
0.5
1.6
0.4
1.4
0.4
1.3
0.4
1.5
0.3
Sector Update: Cement | May 2014
71

Dalmia Bharat: Big league ambitions, already in top-4
DBEL: Valuation summary
2014 2015E 2016E
2017E
Sales
28.7
42.0
51.3
60.5
EBITDA
3.3
6.0
9.5
12.7
-0.1
-0.6
1.7
5.2
NP
Adj EPS (INR)
-1.0
-7.2
20.4
64.2
EPS Gr. (%)
-104
595 -384
215
BV/Sh. (INR)
381
372
390
452
RoE (%)
-0.3
-1.9
5.4
15.3
RoCE (%)
4.2
5.8
8.6
12.1
Pa yout (%)
-
-
-
-
Valuation
P/E (x)
-336 -48.3
17.0
5.4
P/BV (x)
0.9
0.9
0.9
0.8
EV/EBITDA (x)
12.0
11.4
7.4
5.0
EV/Ton (USD)
66
72
69
61
Stock info
Equi ty Sha res (m)
52-Week Ra nge (INR)
1,6,12 Rel . Perf. (%)
M.Ca p. (INR b)
M.Ca p. (USD m)
Y/E March
Capacity expansion to drive superior volume growth
DBEL’s sustained focus on capacity and market expansion through both the organic and
inorganic routes makes its 4
th
largest cement group with 24mt of capacity under control by
FY15 (effective stake of 16.5mt). Current utilization base of southern and stabilizing north-
east operations are low, and thus aids huge volume lever once demand starts improving and
clinker bottleneck in north-east operations (Calcom) eases off with new capacity.
Diversifying market mix – not merely South-centered
DBEL (standalone) is a dominant player in the South (fourth-largest), with the largest sales
exposure in Tamil Nadu and Kerala (exposure to AP is ~13%). The company has de-risked itself
through (a) entry into the fast-growing North East market which offer strong potential in
absence of any major brand, and (b) exposure to the better performing East market through
OCL, and © recent acquisition of Bokaro (east) plant from Jaypee group .
Superior profitability took hit in FY14, gradual recovery in FY15 onwards
DBEL and OCL historically have enjoyed superior profitability historically due to higher
realizations and operational efficiency. While weak dynamics of south plant and low
utilizations at north east has impacted profitability in FY14, we expect a gradual recovery
FY15 onwards with improvement in both aspects.
Trading at discount for 4th largest player; Buy
DBEL is poised for strong scale-up, driven by sustained focus on capacity and market
expansion through both organic and inorganic routes. The stock trades at FY16/17E
EV/EBITDA of 7.4x/5x and EV/ton of USD69/61. Maintain
Buy
with TP of ~INR538 (FY16 SOTP
based),
base case upside of 55%
81.2
385/92
27/149/151
28.2
480.0
Sector Update: Cement | May 2014
72

Dalmia Bharat: Big league ambitions, already in top-4
§
While our base case factors in for price increase of ~INR15/bag in FY17, in bull case (~INR30/bag price increase in FY17),
§
DBEL’s TP can be ~INR901 (implied EV/Ton of ~USD104 at 8x EV/EBITDA).
Further upside may emerge from re-rating with strong scale-up and successful execution of its big league ambition
Trend in EV/EBITDA (x)
TP
(INR/sh)
141
240
340
439
538
638
737
FY16 performance sensitivity to cement price change
Price
Change
(INR/Ton)
-100
0
100
200
300
400
500
EBITDA/Ton EPS
(INR/Ton) (INR)
661
757
854
950
1,047
1,143
1,239
-30
-17
-5
8
20
33
45
PE (x)
-11.7
-20.2
-74.7
44.1
17.0
10.6
7.6
EV/EBITDA
(x)
12.3
10.6
9.3
8.3
7.4
6.7
6.1
EV/Ton
(US$)
72
71
71
70
69
68
67
EV/Ton at
Upside (%)
TP (USD)
55
62
70
77
85
92
100
-59
-31
-2
26
55
83
112
FY17 performance sensitivity to cement price change
Price
(INR/Ton)
0
100
200
300
400
500
600
Trend in EV/ton (USD)
TP
(INR/sh)
391
476
561
646
731
816
901
EBITDA/Ton
(INR/Ton)
946
1,043
1,140
1,237
1,333
1,430
1,527
EPS
22.6
36.5
50.4
64.2
78.1
92.0
105.9
PE (x)
15.4
9.5
6.9
5.4
4.4
3.8
3.3
EV/EBITDA
(x)
6.9
6.1
5.5
5.0
4.6
4.2
3.8
EV/Ton
(US$)
64
63
62
61
60
59
58
EV/Ton at
Upside (%)
TP (USD)
68
74
80
86
92
98
104
13
37
62
86
110
135
159
Sector Update: Cement | May 2014
73

Dalmia Bharat: Operational snapshot
Market mix improve with rising diversification (%)
East
North East
South
Strong scale, but weak utilization offers significant head room to grow
Capacity (mt)
Volume (mt)
60
58
Utilization (%)
58
64
67
13
20
FY14E
58
15
27
FY16E
50
59
61
46
52
9 5
FY10
9 5
FY11
10 6
FY12
11 6
FY13
12 7
FY14
16 8
FY15E
16 9
FY16E
16 10
FY17E
16 10
FY18E
Profitability to see strong uptrend with better market mix and
ramp-up of operations at North East plant…
South operations
Blended operations
…driving up capital efficiencies
RoE
RoCE
15.3
9.7
5.8
8.8
6.6
-0.3
FY13
FY14
-1.9
FY15E
FY16E
FY17E
FY18E
4.2
5.8
8.6
5.4
12.1
22.2
15.2
1,031
1,117
744
485
527
551
FY14
807
FY15E
1,047
FY16E
939
1,080
934
FY12
1,116
FY13
1,237
FY17E
1,373
FY18E
FY12
Gearing to peak at 1.5x on the back of expansion and acquisition
Net debt (INR b)
Net DER (x)
Significant operating and financial leverage at play
Interest as % EBITDA
74
Depreciation as % of EBITDA
1.5
0.8
0.4
10.9
FY12
24.8
FY13
29.8
FY14
43.8
FY15E
1.0
1.3
0.9
0.5
40.8
FY16E
33.2
FY17E
20.6
FY18E
55
41
84
FY15E
31
41
FY17E
26
33
FY18E
48
47
FY11
33
27
FY12
32
36
FY13
97
FY14
55
FY16E
Sector Update: Cement | May 2014
74

Dalmia Bharat: Operational snapshot
Break-up of capacity (mt)
Capacity (mt)
DCBL
OCL
Adhuni k
Ca l com
Boka ro
Total Capacity under control
Capacity based on Eco. Interest
DBEL's
Stake (%)
85
40.3
85.0
64.6
62.9
FY14E
9.0
5.4
1.5
1.3
2.1
17.1
11.9
FY15E
11.5
6.8
1.5
2.1
2.1
24.0
16.5
FY16E
11.5
6.8
1.5
2.1
2.1
24.0
16.5
FY17E
11.5
6.8
1.5
2.1
2.1
24.0
16.5
EBITDA break-up (INR m)
EBITDA (INR m)
Stake (%)
DCBL
85
OCL
40.3
Adhuni k
85.0
Ca l com
64.6
Boka ro
62.9
Total EBITDA
EBITDA based on Eco. Interest
FY14E
2,687
2,840
554
-111
5,970
3,826
FY15E
3,154
3,681
803
63
1,979
9,680
6,131
FY16E
4,986
4,116
1,142
834
2,523
13,601
8,993
FY17E
6,920
4,703
1,538
1,219
3,003
17,383
11,760
PAT break-up (INR m)
PAT (INR m)
DCBL
OCL
Adhuni k
Ca l com
Boka ro
Total PAT
PAT based on Eco. Interest
Stake (%)
85
40.273
85
64.6
62.9
FY14E
-1,294
979
-370
-825
-1,511
-1,554
FY15E
-2,441
1,171
-65
-909
1,024
-1,219
-1,601
FY16E
-2,449
1,541
219
-495
1,405
221
-710
FY17E
-242
1,985
575
-267
1,741
3,792
2,005
Net Debt break-up (INR m)
Net Debt (INR m)
Stake (%)
DCBL
85
OCL
40.3
Adhuni k
85.0
Ca l com
64.6
Boka ro
Total Net Debt
Net Debt based on Eco. Interest
Net Debt:EBITDA
FY14E
22,000
4,043
5,116
8,000
39,160
29,845
7.8
FY15E
37,837
2,432
4,825
8,000
2,230
55,324
43,813
7.1
FY16E
35,844
561
4,165
8,000
2,230
50,800
40,804
4.5
FY17E
29,187
-1,998
3,044
8,000
2,230
40,463
33,162
2.8
DBEL: Sum of the Parts valuations
INR m
Valuation method Multiple (x)
DCBL
EV/EBITDA (x)
10.0
OCL (@
EV/EBITDA (x) &
20%
40% hol d-co
8
Hol dCo
di s count
di s count)
Adhuni k
EV/Ton
75
Ca l com
EV/Ton
75
Boka ro
EV/EBITDA (x)
8
Total EV
Les s : Pro-ra ta Net Debt (a dj for CWIP)
Total Equity Value
Fair value (INR/share)
Ups i de (%)
Implied EV/Ton (on pro-rata capacity)
FY15E
26,809
9,488
5,621
6,038
15,830
63,786
41,813
21,973
271
-22.1
66
FY16E
42,383
10,608
5,621
6,038
12,696
77,346
38,304
39,042
481
38.4
80
FY17E
41,175
We believe stock re-rating hinges upon:
10,607
5,621
6,038
13,223
76,663
30,662
46,000
567
63.0
79
§
Balancing of long-term growth aspirations and medium-term
financial prudence
§
Improvement
in financial performance, driven by
improvement in operations, especially North-East operations
§
Simplification of holding structure
§
Consolidation of capacity addition before the next leg of
capex
Sector Update: Cement | May 2014
75

Dalmia Bharat: Financials
Income Statement
Y/E March
Net Sales
Cha nge (%)
Tota l Expendi ture
% of Sa l es
EBITDA
Ma rgi n (%)
Depreci a ti on
EBIT
Int. a nd Fi na nce Cha rges
Other Income - Rec.
PBT bef. EO Exp.
EO Expens e/(Income)
PBT after EO Exp.
Current Ta x
Ta x Ra te (%)
Reported PAT
Mi nori ty a nd As s oci a tes
PAT Adj for EO items
Cha nge (%)
Ma rgi n (%)
2012
23,304
33.5
17,748
76.2
5,556
23.8
1,817
3,739
1,513
874
3,099
395
2,704
832
45.4
1,476
1,691
1,538.8
7.3
2013
27,906
19.8
21,564
77.3
6,342
22.7
2,059
4,282
2,314
769
2,738
0
2,738
1,336
48.8
1,402
569
1,971
16.5
7.1
2014E
28,670
2.7
25,407
88.6
3,263
11.4
2,422
842
3,151
2,081
-229
0
-229
644
-281.5
-873
789
-84
-104.3
-0.3
2015E
41,962
46.4
35,964
85.7
5,998
14.3
3,315
2,684
5,051
2,001
-366
0
-366
1,111
-303.8
-1,477
893
-584
595.0
-1.4
(INR Million)
2016E
51,251
22.1
41,765
81.5
9,486
18.5
3,866
5,619
5,243
2,006
2,382
0
2,382
1,456
61.1
927
730
1,657
-383.8
3.2
2017E
60,496
18.0
47,816
79.0
12,680
21.0
3,977
8,703
5,243
2,512
5,972
0
5,972
1,027
17.2
4,945
272
5,217
214.9
8.6
Balance Sheet
Y/E March
Equi ty Sha re Ca pi ta l
Tota l Res erves
Net Worth
Deferred Li a bi l i ti es
Mi nori ty Interes t
Tota l Loa ns
Capital Employed
Gros s Bl ock
Les s : Accum. Deprn.
Net Fixed Assets
Ca pi ta l WIP
Total Investments
Curr. Assets, Loans&Adv.
Inventory
Account Recei va bl es
Ca s h a nd Ba nk Ba l a nce
Loa ns a nd Adva nces
Curr. Liability & Prov.
Account Pa ya bl es
Provi s i ons
Net Current Assets
Appl. of Funds
E: MOSL Es ti ma tes
2012
162
28,743
28,905
927
19,127
53,231
37,987
3,659
34,328
1,165
11,935
8,795
2,615
1,354
664
4,162
3,042
2,726
316
5,753
53,231
2013
162
30,517
30,679
1,638
5,181
35,744
73,242
49,979
7,410
42,569
5,503
11,804
16,139
3,520
2,572
999
9,048
6,899
6,241
658
9,240
73,242
2014E
162
30,785
30,947
1,865
4,464
42,760
80,036
55,482
9,832
45,650
12,000
12,336
15,560
3,311
2,843
844
8,562
7,523
6,874
649
8,037
80,036
2015E
162
30,012
30,175
1,865
4,520
58,260
94,820
77,103
13,146
63,957
2,000
12,336
13,127
3,640
2,831
-1,431
8,088
6,891
6,471
420
6,237
94,820
(INR Million)
2016E
162
31,481
31,643
2017E
162
36,509
36,671
1,865
1,865
4,936
6,436
58,260 58,260
96,703 103,232
79,103
17,012
62,090
2,500
12,336
17,694
4,360
3,391
1,222
8,720
8,207
7,751
456
9,487
81,603
20,990
60,613
2,500
12,336
26,595
5,108
3,406
9,000
9,082
9,102
9,082
21
17,493
96,703 103,232
Sector Update: Cement | May 2014
76

Dalmia Bharat: Financials
Ratios
Y/E March
Basic (INR) *
EPS
Ca s h EPS
BV/Sha re
DPS
Pa yout (%)
Valuation (x) *
P/E
Ca s h P/E
P/BV
EV/Sa l es
EV/EBITDA
EV/Ton (US$)
Di vi dend Yi el d (%)
Return Ratios (%)
RoE
RoCE
Working Capital Ratios
As s et Turnover (x)
Inventory (Da ys )
Debtor (Da ys )
Leverage Ratio (x)
Current Ra ti o
Debt/Equi ty
2012
20.3
43.2
356.0
1.5
8.4
17.1
8.0
1.0
1.6
6.9
66
0.4
5.8
9.7
0.4
41
19
2.9
0.7
2013
24.3
49.6
377.8
2.0
9.6
14.3
7.0
0.9
1.8
6.6
75
0.6
6.6
8.8
0.4
46
32
2.3
1.2
2014E
-1.0
28.8
381.1
2.0
-
-335.9
12.1
0.9
1.8
12.0
66
0.6
-0.3
4.2
0.4
42
39
2.1
1.4
2015E
-7.2
33.6
371.6
2.0
-
-48.3
10.3
0.9
1.9
11.4
72
0.6
-1.9
5.8
0.4
32
35
1.9
1.9
2016E
20.4
68.0
389.7
2.0
-
17.0
5.1
0.9
1.5
7.4
69
0.6
5.4
8.6
0.5
31
35
2.2
1.8
2017E
64.2
113.2
451.6
2.0
-
5.4
3.1
0.8
1.1
5.0
61
0.6
15.3
12.1
0.6
31
30
2.9
1.6
Cash Flow Statement
Y/E March
Oper. Profi t/(Los s ) before Ta x
Interes t/Di vi dends Recd.
Depreci a ti on
Di rect Ta xes Pa i d
(Inc)/Dec i n WC
CF from Operations
EO expens e
CF from Operating incl EO
(i nc)/dec i n FA
(Pur)/Sa l e of Inves tments
CF from investments
Is s ue of Sha res
(Inc)/Dec i n Debt
Interes t Pa i d
Di vi dend Pa i d
CF from Fin. Activity
Inc/Dec of Cash
Add: Begi nni ng Ba l a nce
Closing Balance
2012
3,883
874
1,817
-832
-3,419
2,323
0
2,323
-220
-5,343
-5,563
-1,042
237
-1,513
-141
-2,459
-5,700
4,543
-1,157
2013
5,118
936
1,847
-597
-3,151
4,153
-395
3,758
-16,330
132
-16,198
-1,088
16,617
-2,263
-189
13,077
637
664
1,300
2014E
1,127
928
2,004
-398
1,047
4,708
0
4,708
-12,000
-533
-12,533
431
7,016
-2,355
-190
4,902
-2,923
999
-1,923
2015E
1,034
956
2,652
-700
-475
3,466
0
3,466
-11,621
0
-11,621
449
15,500
-3,536
-189
12,224
4,069
844
4,913
(INR Million)
2016E
2,444
626
3,241
-759
-597
4,956
0
4,956
-2,500
0
-2,500
2,529
0
-4,370
-189
-2,029
427
-1,431
-1,004
2017E
4,486
693
3,335
-35
-228
8,251
0
8,251
-2,500
0
-2,500
3,681
0
-4,370
-189
-877
4,874
1,222
6,096
Sector Update: Cement | May 2014
77

India Cement: South recovery, potential restructuring, deleveraging key drivers
Financials & Valuation (INR b)
INR million
Sa l es
EBITDA
NP
Adj. EPS (INR)
EPS Gr. (%)
BV/Sh (INR)
RoE (%)
RoCE (%)
Pa yout (%)
Valuation
P/E (x)
P/BV (x)
EV/EBITDA (x)
EV/Ton (USD)
2014
44.4
5.4
-0.5
-7.9
-236
125.4
-1.3
4.2
0.0
-11.8
0.7
10.8
72
2015E 2016E
50.2
7.5
1.3
3.8
-149
127.4
3.4
6.9
53.3
24.3
0.7
8.0
71
57.6
9.3
2.5
8.2
113
132.2
6.4
9.4
42.1
11.4
0.7
6.1
67
2017E
66.9
11.4
4.2
13.9
70
142.2
9.8
12.1
25.8
6.7
0.7
4.6
62
Volume growth hinges on regional demand recovery
Regional leader having strong presence in South India, with total capacity of 15.5m ton and
strong brand equity in its key markets. The volume growth largely hinges on recovery in
southern demand especially in Andhra Pradesh, which accounts for ~20% of its sales. It owns
61% stake in Trinetra Cement, which has a 1.5mt plant in the North (Rajasthan), which is
operating at 75% utilizations.
Cost structure could see improvement
Despite, strategically located plants, ICEM historically had the higher cost structure due to (1)
high dependence on grid power, (2) increase in lead distance, and (3) negative operating
leverage (low utilization). We expect it to derive benefits from (1) commencement of the AP
CPP (48MW), coupled with ramp-up in TN CPP (CPP to account for ~80% of power
requirement, and help save INR1/unit), and (2) stabilization of Indonesian coal mine (to help
save USD10-15/ton on cost of imported coal).
IPL offers option value; yet, non-core capital allocation a concern
While we do not assign any value to its IPL team, based on the floor valuation of auction,
ICEM's IPL team can be valued at INR38/share. However, its investments in non-core activities
- capital allocation to shipping for ferrying own coal, investment in IPL, significant inter-group
company loans, and potential diversification into the infrastructure business raise concerns of
suboptimal capital efficiency.
Strong volume partially factored in; Neutral
ICEM’s net debt/equity stood at 0.9x. Recovery in AP demand is biggest catalyst, albeit strong
volume recovery is partially factored in current valuations. Adverse market mix, sub-optimal
capital allocation/efficiencies and high gearing, would remain overhangs. The stock trades at
6.1x/4.6x FY16/17E EV/EBITDA and USD67/62 per ton. Maintain
Neutral
with FY16 based
target price of INR106 (6.5x FY17E EV/EBTIDA or USD70/ton).
Base case upside of 13%.
Stock info
Equity Shares (m)
52-Week Range (INR)
1,6,12 Rel. Perf. (%)
M.Cap. (INR b)
M.Cap. (USD b)
307.2
110/43
29/46/12
28.7
0.5
Sector Update: Cement | May 2014
78

India Cement:
South recovery, potential restructuring, deleveraging key drivers
§
While our base case factors in for price increase of ~INR15/bag in FY17, in bull case (~INR30/bag price increase in FY17),
§
ICEM’s FY17 based TP can be ~INR197 (implied EV/Ton of ~USD92 at 5x EV/EBITDA).
Balance sheet deleveraging and improvement in capital allocation may lead to re-rating.
FY16 performance sensitivity to cement price change
Price
Change
(INR/Ton)
-100
0
100
250
300
400
500
Trend in EV/EBITDA (x)
TP
(INR/sh)
7
35
64
106
120
148
177
EBITDA/Ton EPS
(INR/Ton) (INR)
445
545
645
795
845
945
1,045
-1
1
4
8
10
12
15
PE (x)
-64.1
72.2
23.1
11.4
9.8
7.6
6.2
EV/EBITDA
(x)
11.2
9.1
7.7
6.1
5.7
5.0
4.5
EV/Ton
(US$)
72
70
69
67
66
65
63
EV/Ton at
Upside (%)
TP (USD)
41
49
58
70
74
83
91
-93
-62
-32
13
29
59
89
FY17 performance sensitivity to cement price change
Price
Change
(INR/Ton)
0
100
200
300
400
500
600
Trend in EV/ton (USD)
TP
(INR/sh)
42
68
94
120
146
171
197
EBITDA/Ton
(INR/Ton)
592
692
792
892
992
1,092
1,192
EPS
4.8
7.8
10.8
13.9
16.9
19.9
22.9
PE (x)
19.5
12.0
8.6
6.7
5.5
4.7
4.1
EV/EBITDA
(x)
7.2
6.1
5.2
4.6
4.0
3.6
3.2
EV/Ton
(US$)
66
65
63
62
60
59
58
EV/Ton at
Upside (%)
TP (USD)
48
55
63
70
77
85
92
-55
-27.1
0.5
28.1
55.8
83.4
111.0
Sector Update: Cement | May 2014

India Cements: Operational snapshot
Capacity market mix (%)
West
7%
North
11%
AP
45%
Volume mix (%)
East
2%
West North
9% 12%
Weak market results in lower utilization
Capacity (mt)
Despatch (mt)
Utilization (%)
91
78
70
9.1
13.0
FY09
11.0
14.1
FY10
71
10.0
14.1
FY11
10.1
67
15.1
FY12
83
71
10.7
15.1
FY13
71
10.8
15.2
FY14
76
11.5
15.2
FY15E
12.5
15.2
FY16E
13.8
15.2
FY17E
TN
37%
South
77%
Benefits of cost triggers like CPP, coal block partly behind, and would
drive further growth in profitability along with pricing uptick
29.1
21.9
12.4
1092
FY09
754
FY10
435
FY11
948
FY12
839
FY13
EBITDA (INR/ton)
Margin (%)
Lower utilization, weak pricing and sub-optimal capital allocation
impacts capital efficiency
16.8
15.7
10.6
8.4
3.6
7.3
1.6
-1.3
FY09
FY10
FY11
FY12
FY13
FY14
4.3
10.1
RoE
8.4
4.2
RoCE
6.9
9.4
12.1
9.8
6.4
3.4
21.5
18.3
12.1
535
FY14
15.0
707
FY15E
16.1
795
FY16E
17.1
892
FY17E
FY15E
FY16E
FY17E
No meaningful capex would drive B/S deleveraging
Net debt (INR b)
Net DER (x)
Weak operations, high debt offers very high operating leverage
Interest as % of EBITDA
Depreciation as % of EBITDA
0.6
19
FY09
0.5
20
FY10
0.6
0.7
0.9
1.0
1.0
0.8
0.7
56
28
17
FY10
28
32
FY12
33
36
FY13
51
37
66
43
FY15E
30
35
FY16E
25
28
FY17E
24
FY11
27
FY12
32
FY13
35
FY14
35
FY15E
31
FY16E
27
FY17E
20
11
FY09
33
FY11
FY14
Sector Update: Cement | May 2014
80

India Cement - Financials
Income Statement
Y/E March
Net Sales
Cha nge (%)
Tota l Expendi ture
% of Sa l es
EBITDA
Ma rgi n (%)
Depreci a ti on
EBIT
Int. a nd Fi na nce Cha rges
Other Income - Rec.
PBT bef. EO Exp.
EO Expens e/(Income)
PBT after EO Exp.
Current Ta x
Deferred Ta x
Ta x Ra te (%)
PAT Adj for EO items
Cha nge (%)
Ma rgi n (%)
2012
42,034
20.1
33,001
78.5
9,034
21.5
2,513
6,521
2,867
193
3,846
36
3,810
378
502
23.1
2,958
345.8
7.0
2013
45,970
9.4
37,537
81.7
8,433
18.3
2,818
5,615
3,078
186
2,724
200
2,524
836
52
35.2
1,765
-40.3
3.8
2014E
44,409
-3.4
39,037
87.9
5,371
12.1
2,764
2,608
3,537
396
-533
1,091
-1,624
0
0
0.0
-533
-130.2
-1.2
2015E
50,160
12.9
42,633
85.0
7,527
15.0
2,796
4,731
3,227
170
1,674
0
1,674
335
0
20.0
1,339
-351.4
2.7
(INR Million)
2016E
57,606
14.8
48,336
83.9
9,270
16.1
2,778
6,492
3,213
225
3,504
0
3,504
876
88
27.5
2,541
89.7
4.4
2017E
66,923
16.2
55,495
82.9
11,428
17.1
2,804
8,624
3,198
300
5,726
0
5,726
1,431
143
27.5
4,151
63.4
6.2
Balance Sheet
Y/E March
2012
Equi ty Sha re Ca pi ta l
3,072
Ful l y Di l uted excl Trea s ury s to 2,872
Tota l Res erves
37,516
Net Worth
40,587
Deferred Li a bi l i ti es
Tota l Loa ns
Capital Employed
Gros s Bl ock
Les s : Accum. Deprn.
Net Fixed Assets
Ca pi ta l WIP
Total Investments
Curr. Assets, Loans&Adv.
Inventory
Account Recei va bl es
Ca s h a nd Ba nk Ba l a nce
Loa ns a nd Adva nces
Rea l Es ta te Projects WIP
Curr. Liability & Prov.
Account Pa ya bl es
Other Current Li a bi l i ti es
Provi s i ons
Net Current Assets
Appl. of Funds
E: MOSL Es ti ma tes ; * Adjus ted
3,245
27,010
70,842
65,019
23,690
41,329
1,451
8,520
2013
3,072
2,872
37,825
40,896
3,297
30,230
74,423
70,571
26,509
44,063
750
9,578
2014E
3,072
2,872
35,441
38,513
3,297
32,000
73,810
72,821
29,272
43,549
1,000
9,455
35,288
5,509
4,225
31
25,319
204
13,559
8,643
4,322
594
21,729
75,733
2015E
3,072
2,872
36,066
39,138
3,297
31,999
74,434
74,321
32,068
42,253
1,000
9,435
37,224
6,321
4,810
1,069
24,819
204
15,478
8,933
5,497
1,049
21,745
74,434
(INR Million)
2016E
3,072
2,872
37,536
40,608
3,385
31,849
75,841
75,821
34,846
40,976
1,000
9,435
42,160
7,260
5,524
4,353
24,819
204
17,729
9,469
6,313
1,947
24,430
75,841
2017E
3,072
2,872
40,617
43,688
3,528
31,699
78,915
77,821
37,650
40,172
1,000
9,435
48,412
8,434
6,417
8,538
24,819
204
20,104
10,268
7,334
2,502
28,308
78,915
31,114 33,638
5,258
4,961
2,098
4,656
29
47
23,524 23,770
204
204
11,571 13,606
6,275
7,756
3,972
4,453
1,325
1,396
19,542 20,032
70,842 74,423
for trea s ury s tocks
Sector Update: Cement | May 2014
81

India Cement - Financials
Ratios
Y/E March
Basic (INR) *
Consol EPS
Ca s h EPS
BV/Sha re
DPS
Pa yout (%)
Valuation (x) *
P/E
Ca s h P/E
P/BV
EV/Sa l es
EV/EBITDA
EV/Ton (US$)
Di vi dend Yi el d (%)
Return Ratios (%)
RoE
RoCE
Working Capital Ratios
As s et Turnover (x)
Inventory (Da ys )
Debtor (Da ys )
Leverage Ratio (x)
Current Ra ti o
Debt/Equi ty
* Adjus ted for trea s ury s tocks
2012
8.5
17.8
132.1
2.0
24.5
11.0
5.2
0.7
1.2
5.9
62
2.1
7.3
10.1
0.6
45.7
18
2.7
0.7
2013
5.8
14.9
133.1
2.0
43.6
16.1
6.3
0.7
1.2
6.4
68
2.1
4.3
8.4
0.6
39.4
37
2.5
0.7
2014E
-7.9
7.3
125.4
0.0
0.0
-11.8
12.9
0.7
1.3
10.8
72
0.0
-1.3
4.2
0.6
45.3
35
2.6
0.8
2015E
3.8
13.5
127.4
2.0
53.3
24.3
6.9
0.7
1.2
8.0
71
2.1
3.4
6.9
0.7
46.0
35
2.4
0.8
2016E
8.2
17.3
132.2
3.0
42.1
11.4
5.4
0.7
1.0
6.1
67
3.2
6.4
9.4
0.8
46.0
35
2.4
0.8
2017E
13.9
22.6
142.2
3.0
25.8
6.7
4.1
0.7
0.8
4.6
62
3.2
9.8
12.1
0.8
46.0
35
2.4
0.7
Cash Flow Statement
Y/E March
Oper. Profi t/(Los s ) before Ta x
Interes t/Di vi dends Recd.
Di rect Ta xes Pa i d
(Inc)/Dec i n WC
CF from Operations
EO expens e
CF from Operating incl EO
(i nc)/dec i n FA
(Pur)/Sa l e of Inves tments
CF from investments
Is s ue of Sha res
(Inc)/Dec i n Debt
Interes t Pa i d
Di vi dend Pa i d
CF from Fin. Activity
Inc/Dec of Cash
Add: Begi nni ng Ba l a nce
Closing Balance
2012
9,034
193
-378
5,321
14,169
-36
14,133
-3,860
-6,917
-10,777
-2,521
2,449
-2,867
-719
-3,658
-302
331
29
2013
8,433
186
-836
-472
7,312
-200
7,112
-4,851
-1,059
-5,910
-613
3,220
-3,078
-714
-1,184
18
29
47
2014E
5,371
396
0
-1,714
4,054
-1,091
2,963
-576
123
-453
-760
1,770
-3,537
0
-2,526
-17
47
31
2015E
7,527
170
-335
1,022
8,385
0
8,385
-3,424
21
-3,403
0
-1
-3,227
-714
-3,943
1,039
31
1,069
(INR Million)
2016E
9,270
225
-876
599
9,217
0
9,217
-1,500
0
-1,500
0
-150
-3,213
-1,071
-4,433
3,284
1,069
4,353
2017E
11,428
300
-1,431
307
10,603
0
10,603
-2,000
0
-2,000
0
-150
-3,198
-1,071
-4,419
4,185
4,353
8,538
Sector Update: Cement | May 2014
82

JK Cement: Cushion of white cement
Financials & Valuation (INR b)
Y/E March
2014
27.8
3.4
0.8
10.7
-67.5
249.7
4.5
7.2
32.7
31.4
1.3
8.5
57
2015E
36.4
6.2
1.3
18.8
75.8
261.2
7.3
9.2
37.3
17.8
1.3
8.2
74
2016E 2017E
43.3
8.6
2.5
37.0
96.3
289.4
13.2
12.6
22.1
9.1
1.2
5.5
69
50.0
10.8
4.2
61.0
64.9
341.5
19.1
16.0
13.4
5.5
1.0
3.6
58
Sales
EBITDA
NP
Adj EPS (INR)
EPS Gr. (%)
BV/Sh. (INR)
RoE (%)
RoCE (%)
Pa yout (%)
Valuation
P/E (x)
P/BV (x)
EV/EBITDA (x)
EV/Ton (USD)
Favorable market mix; improving gray cement cost structure
JKCE has a favorable market mix, with North and West India accounting for ~70% of its
dispatches. Southern capacity would benefit in the event of AP market recovery. Ongoing
expansion of 3m tons would further enhance presence in the North and aid utilization levers
hereon. Gray cement cost structure has traditionally been sub-par due to old plants (lower
operating efficiency) and higher lead distance/freight cost (absence of split grinding).
Improvement on both counts is likely through expansions and new grinding units. Benefits of
operating leverage should drive superior profitability growth in gray cement business, with
EBITDA/ton at INR577 in FY16E, up from INR228.
White cement business a cash cow
JKCE is the second largest player in the duopolistic white cement industry in India, with 40%
market share. It has a capacity of 0.6m tons in India, and is putting up a 0.6m tons white
cement plant in UAE by 1QFY15 to address international demand. We estimate INR3.5b-4b of
EBITDA contribution from white cement in FY15-16 (v/s INR2.1b in FY14), which would
continue to lend cushion to JKCE's debt servicing during the capex cycle.
Expect de-leveraging from FY16
JKCE's net debt is likely to peak at INR28b (1.4x) in FY15 v/s INR23b in FY14 on the back of 3m
tons of brownfield expansion at Rajasthan and 0.6m tons of white cement capacity in the
UAE. FCF generation from FY16 should trigger deleveraging, with full benefit of new
capacities, resulting in net debt:equity of ~1.2x/0.7x in FY16/FY17E.
Buy, with an SOTP-based target price of INR469
The stock trades at 5.5x/3.6x EV/EBITDA and USD68/58 per ton on FY16E/17E basis. We value
JKCE’s gray cement business at 7x FY16E EBITDA (implied EV/ton of USD45) and white cement
business at 6x FY17E EBITDA. Our FY16 SOTP-based target price is INR469 (blended EV/ton of
USD80). Maintain
Buy, with base case upside of 40%
Stock info
Equi ty Sha res (m)
52-Week Ra nge (INR)
1,6,12 Rel . Perf. (%)
M.Ca p. (INR b)
M.Ca p. (USD b)
69.9
360/148
38/57/28
23.5
0.4
Sector Update: Cement | May 2014
83

JK Cement: Cushion of white cement
§
Ongoing capex cycle makes gearing high over near-term, making it also a leverage play over the medium term.
§
While our base case factors in for price increase of ~INR15/bag in FY17, in bull case (~INR30/bag price increase in FY17),
JKCE’s TP can be ~INR777 (implied blended EV/Ton of ~USD100).
FY16 performance sensitivity to cement price change
Price
Change
(INR/Ton)
-100
0
100
250
300
400
500
Trend in EV/EBITDA (x)
TP
(INR/sh)
205
280
356
469
507
582
658
EBITDA/Ton EPS
(INR/Ton) (INR)
304
404
504
654
704
804
904
15
21
27
37
40
46
53
PE (x)
22.7
15.9
12.2
9.1
8.4
7.2
6.4
EV/EBITDA
(x)
7.7
6.9
6.3
5.5
5.3
4.8
4.5
EV/Ton
(US$)
71
71
70
69
68
67
67
EV/Ton at
Upside (%)
TP (USD)
58
65
71
82
85
92
99
-39
-17
6
40
51
73
96
FY17 performance sensitivity to cement price change
Price
(INR/Ton)
0
100
200
300
400
500
600
Trend in EV/ton (USD)
TP
(INR/sh)
408
470
531
593
654
716
777
EBITDA/Ton
(INR/Ton)
540
640
740
840
940
1,040
1,140
EPS
40.1
47.0
54.0
61.0
67.9
74.9
81.9
PE (x)
8.4
7.1
6.2
5.5
4.9
4.5
4.1
EV/EBITDA
(x)
4.7
4.3
4.0
3.6
3.4
3.1
2.9
EV/Ton
(US$)
60
59
58
57
56
55
54
EV/Ton at
Upside (%)
TP (USD)
67
72
78
83
88
94
99
22
40
58
76
95
113
131
Sector Update: Cement | May 2014
84

JK Cement: Operational snapshot
Market mix getting better (%)
North
40
South
East
29
West
Central
18
18
15
49
Headroom to grow from current capacities, as well as new additions
MP Others
5% RAJ
8%
18%
UP
10%
KAR
15%
MAH
17%
94
Capacity (mt)
85
57
68
71
Dispatch (mt)
76
72
Utilization (%)
67
HAR
15%
Delhi,
Pun,
Chandi
garh
12%
55
61
60
71
4.0 3.8
FY08
4.5 3.8
FY09
7.5 4.3
FY10
7.5 5.1
FY11
7.5 5.3
FY12
7.5 5.6
FY13
7.5 5.4 10.55.8 10.56.4 10.57.0
FY14
FY15E
FY16E
FY17E
Cap mix FY14 Cap mix FY15E Volume mix
Uptick in gray cement EBITDA/ton assumed to be in line with industry
volume and pricing recovery
White cement business along with commencement of UAE plant to
aid INR4-4.5b of steady EBITDA in FY16 onwards
India
UAE
0.9
1.0
1.1
1,010
FY08
697
FY09
835
FY10
306
FY11
667
FY12
637
FY13
279
FY14
442
FY15E
654
FY16E
840
FY17E
0.4
FY08
0.7
FY09
1.0
FY10
1.2
FY11
1.6
FY12
2.0
FY13
2.2
FY14
2.7
FY15E
3.3
FY16E
3.7
FY17E
Operating and financial leverage high
Interest as % of EBITDA
43
25
10
9
FY08
16
14
FY09
20
14
FY10
45
FY11
29
FY12
23
25
FY13
45
FY14
42
FY15E
Depre as % of EBITDA
Leverage to peak out with conclusion of current capex cycle in FY15
Net debt (INR b)
38
40
36
30
35
FY16E
26
25
28
FY17E
0.4
4.4
FY08
9.2
FY09
0.8
0.7
0.8
0.6
3
8.5
FY12
8
CWIP as % CE
37
1.3
0.5
8.4
23.0
FY14
9
3
9.4 10.6
FY10
FY11
1
27.6
FY15E
DER (x)
1.5
1.2
0.7
1
16.5
FY17E
1
24.3
FY16E
FY13
Sector Update: Cement | May 2014
85

JK Cement: Financials
Income Statement
Y/E March
Net Sales
Cha nge (%)
Tota l Expendi ture
% of Sa l es
EBITDA
Ma rgi n (%)
Depreci a ti on
EBIT
Int. a nd Fi na nce Cha rges
Other Income - Rec.
PBT bef. EO Exp.
EO Expens e/(Income)
PBT after EO Exp.
Current Ta x
Deferred Ta x
Ta x Ra te (%)
Reported PAT
PAT Adj for EO items
Cha nge (%)
Ma rgi n (%)
Les s : Mi onri ty Interes t
Net Profit
2012
25,379
21.8
20,329
80.1
5,050
19.9
1,256
3,794
1,443
558
2,908
78
2,830
902
182
38.3
1,746
1,794
214.2
7.1
0
1,794
2013
29,040
14.4
23,547
81.1
5,493
18.9
1,287
4,206
1,398
567
3,375
0
3,375
1,071
0
31.7
2,305
2,305
28.5
7.9
-3.083
2,308
2014E
27,815
-4.2
24,431
87.8
3,384
12.2
1,342
2,042
1,526
626
1,142
0
1,142
392
0
34.4
749
749
-67.5
2.7
-22.1
772
2015E
36,438
31.0
30,272
83.1
6,166
16.9
2,236
3,929
2,572
455
1,812
0
1,812
447
48
27.3
1,318
1,318
75.8
3.6
21.7
1,296
(INR Million)
2016E
43,304
18.8
34,743
80.2
8,561
19.8
2,558
6,003
3,020
570
3,553
0
3,553
874
94
27.2
2,586
2,586
96.3
6.0
43.2
2,543
2017E
49,964
15.4
39,176
78.4
10,788
21.6
2,700
8,088
3,020
899
5,967
0
5,967
1,538
165
28.5
4,264
4,264
64.9
8.5
47.5
4,217
Balance Sheet
Y/E March
Equi ty Sha re Ca pi ta l
Tota l Res erves
Net Worth
Deferred Li a bi l i ti es
Tota l Loa ns
Capital Employed
Gros s Bl ock
Les s : Accum. Deprn.
Net Fixed Assets
Ca pi ta l WIP
Total Investments
Curr. Assets, Loans&Adv.
Inventory
Account Recei va bl es
Ca s h a nd Ba nk Ba l a nce
Loa ns a nd Adva nces
Curr. Liability & Prov.
Account Pa ya bl es
Provi s i ons
Net Current Assets
Appl. of Funds
2012
699
14,522
15,221
2,291
12,963
30,475
29,013
5,845
23,167
904
92
11,596
3,628
837
4,332
2,799
5,284
2,286
630
6,312
30,476
2013
699
16,206
16,905
2,490
12,482
31,925
30,822
7,132
23,690
2,546
324
13,518
4,614
1,153
3,753
3,998
8,152
1,966
799
5,365
31,925
2014E
699
16,762
17,462
2,685
27,750
48,041
31,743
8,474
23,269
17,875
675
15,814
5,420
1,117
4,086
5,191
9,592
4,401
497
6,222
48,041
2015E
699
17,567
18,267
2,733
32,250
53,416
54,818
10,710
44,108
800
675
18,534
6,836
1,451
3,980
6,267
10,701
4,557
447
7,833
53,416
(INR Million)
2016E
699
19,537
20,236
2,826
33,375
56,648
55,818
13,268
42,550
800
675
24,324
7,444
1,724
8,390
6,767
11,702
4,737
874
12,623
56,648
2017E
699
23,181
23,880
2,991
34,500
61,629
56,818
15,968
40,850
800
675
33,352
7,820
1,992
17,286
6,256
14,049
5,474
1,538
19,303
61,629
Sector Update: Cement | May 2014
86

JK Cement: Financials
Ratios
Y/E March
Basic (INR) *
Consol EPS
Ca s h EPS
BV/Sha re
DPS
Pa yout (%)
Valuation (x) *
P/E
Ca s h P/E
P/BV
EV/Sa l es
EV/EBITDA
EV/Ton (US$)
Di vi dend Yi el d (%)
Return Ratios (%)
RoE
RoCE
Working Capital Ratios
As s et Turnover (x)
Inventory (Da ys )
Debtor (Da ys )
Leverage Ratio (x)
Current Ra ti o
Debt/Equi ty
2012
25.7
43.6
217.7
5.0
23.3
13.1
7.7
1.5
1.2
6.2
68
1.5
12.3
15.6
0.8
52.2
11
2.2
0.9
2013
33.0
51.4
241.7
6.5
23.1
10.2
6.5
1.4
1.0
5.3
63
1.9
14.4
16.6
0.9
58.0
13
1.7
0.7
2014E
10.7
29.9
249.7
3.0
32.7
31.4
11.2
1.3
1.0
8.5
57
0.9
4.5
7.2
0.6
71.1
13
1.6
1.6
2015E
18.8
50.8
261.2
6.0
37.3
17.8
6.6
1.3
1.4
8.2
74
1.8
7.3
9.2
0.7
68.5
13
1.7
1.8
2016E
37.0
73.6
289.4
6.0
22.1
9.1
4.6
1.2
1.1
5.5
69
1.8
13.2
12.6
0.8
62.7
13
2.1
1.6
2017E
61.0
99.6
341.5
6.0
13.4
5.5
3.4
1.0
0.8
3.6
58
1.8
19.1
16.0
0.8
57.1
13
2.4
1.4
Cash Flow Statement
Y/E March
Oper. Profi t/(Los s ) before Ta x
Interes t/Di vi dends Recd.
Depreci a ti on
Di rect Ta xes Pa i d
(Inc)/Dec i n WC
CF from Operations
EO expens e
CF from Operating incl EO
(i nc)/dec i n FA
(Pur)/Sa l e of Inves tments
CF from investments
Is s ue of Sha res
(Inc)/Dec i n Debt
Interes t Pa i d
Di vi dend Pa i d
CF from Fin. Activity
Inc/Dec of Cash
Add: Begi nni ng Ba l a nce
Closing Balance
2012
3,794
558
1,256
-902
633
5,338
29
5,368
-1,439
-50
-1,489
-68
-845
-1,443
-406
-2,761
1,117
3,215
4,332
2013
4,206
567
1,287
-872
419
5,608
-1
5,607
-3,451
-232
-3,683
-91
-481
-1,398
-532
-2,503
-579
4,332
3,753
2014E
2,042
626
1,342
-198
-528
3,284
4
3,288
-16,250
-351
-16,601
30
15,268
-1,526
-245
13,527
214
3,753
3,967
2015E
3,929
455
2,236
-447
-1,636
4,538
-81
4,457
-6,000
0
-6,000
0
4,500
-2,572
-491
1,437
-106
4,086
3,980
(INR Million)
2016E
6,003
570
2,558
-874
-300
7,958
-81
7,877
-1,000
0
-1,000
0
1,125
-3,020
-573
-2,468
4,409
3,980
8,390
2017E
8,088
899
2,700
-1,538
2,296
12,445
-81
12,364
-1,000
0
-1,000
0
1,125
-3,020
-573
-2,468
8,896
8,390
17,286
Sector Update: Cement | May 2014
87

JK Lakshmi Cement: Operating efficiencies, with strong utilization levers
JK Lakshmi Cement: Valuation summary
INR million
2014 2015E 2016E
Sa l es
20.6
23.7
28.2
EBITDA
3.0
4.3
5.7
NP
1.1
1.3
1.5
9.2
11.4
12.3
Adj EPS (INR)
-42.6
24.3
8.3
EPS Gr. (%)
110.7 118.6 125.7
BV/Sh. (INR)
RoE (%)
8.4
9.9
10.1
RoCE (%)
7.7
9.5
11.2
Pa yout (%)
29.6
30.6
42.4
Valuations
P/E (x)
19.1
15.3
14.2
P/BV (x)
1.6
1.5
1.4
EV/EBITDA (x)
7.9
8.1
5.8
EV/Ton (USD)
76
64
57
Stock info
Equi ty Sha res (m)
52-Week Ra nge (INR)
1,6,12 Rel . Perf. (%)
M.Ca p. (INR b)
M.Ca p. (USD b)
2017E
33.8
7.6
2.9
24.3
97.0
144.8
18.0
17.3
21.5
7.2
1.2
4.0
52
117.7
190/59
41/140/48
20.6
0.3
Expansion offers utilization levers; diversifying into better regions
With existing utilization of 100%+, JKLC’s ongoing expansion offers much needed
growth levers ahead of anticipated volume recovery. Expansions will double existing
capacity under control to 10.5m tons (v/s 5.3m tons as on date). This includes 2.7m
tons of greenfield capacity at Durg (4QFY15) and 0.65m tons grinding unit each at
Surat (2QFY16) and Jhajjar (4QFY14), and Udaipur Cement Works (~75.5% equity stake)
of 1.6m tons (4QFY16). JKLC's dispatch mix is skewed towards the North (~65%) and
West - Gujarat (~35%). New capacities would enrich the mix further, with higher
presence in East and Central India.
Superior cost structure; self-sufficiency in power comforting
JKLC has a superior cost structure, which is likely to be maintained owing to (a)
improving fuel efficiency, (b) 100% self-sufficiency in power, and (c) competitive pet
coke prices (85% of fuel mix). Surplus power of 20MW offers additional revenue
stream. With Durg plant, overall cost structure would improve further, as cost at Durg
plant would be lower by INR150-200/ton. Our EBITDA/ton estimate of INR816/INR991
for FY16/FY17 v/s INR536 in FY14, hinges on strengthening realizations.
Balance sheet deleveraging FY16 onwards
JKLC’s net debt is likely to peak at INR16b in FY15 with the conclusion of ongoing
expansion. Positive FCFE FY16 onward would trigger de-leveraging, driving down net
debt:equity to 0.7x by FY17E (v/s ~1.1x in FY15E). Further, capacity addition in UCW
would result in debt of ~INR4b in UCW.
Improving mix, balance sheet deleveraging to drive re-rating; Buy
Improving volume growth, with pricing strength, better cost structure and balance
sheet deleveraging would drive ~38% EPS CAGR. JKLC trades at an EV/EBITDA of
5.8x/4x FY16E/17E and EV/ton of USD57/52.
Buy
with a target price of INR262
(USD75/ton for 9.8m tons and UCW capacity of 1.6mt), base case upside of
50%
88
Sector Update: Cement | May 2014

JK Lakshmi: Improving mix, cost structure and timely expansion
§
Ongoing capex cycle makes gearing and operating leverage high over near-term, making it also a leverage play.
§
While our base case factors in for price increase of ~INR15/bag in FY17, in bull case (~INR30/bag price increase in FY17),
JKLC’s TP can be ~INR403 (implied EV/Ton of ~USD95 at 5.5x EV/EBITDA).
FY16 performance sensitivity to cement price change
Price
Change
(INR/Ton)
-100
0
100
250
300
400
500
Trend in EV/EBITDA (x)
TP
(INR/sh)
89
138
188
262
287
336
385
EBITDA/Ton EPS
(INR/Ton) (INR)
493
593
693
843
893
993
1,093
-2
2
6
12
14
18
22
PE (x)
-102.7
75.7
27.6
14.2
12.2
9.5
7.8
EV/EBITDA
(x)
10.6
8.7
7.3
5.8
5.4
4.8
4.2
EV/Ton
(US$)
61
60
59
57
56
55
54
EV/Ton at
Upside (%)
TP (USD)
61
60
59
57
56
55
54
-49
-21
7
50
64
92
120
FY17 performance sensitivity to cement price change
Price
(INR/Ton)
0
100
200
300
400
500
600
Trend in EV/ton (USD)
TP
(INR/sh)
164
204
244
284
324
364
403
EBITDA/Ton EPS
(INR/Ton) (INR)
709
809
909
1,009
1,109
1,209
1,309
10.8
15.3
19.8
24.3
28.8
33.3
37.8
PE (x)
16.1
11.4
8.8
7.2
6.1
5.2
4.6
EV/EBITDA
(x)
6.0
5.2
4.5
4.0
3.5
3.2
2.9
EV/Ton
(US$)
56
55
53
52
51
50
49
EV/Ton at
Upside (%)
TP (USD)
54
61
68
75
81
88
95
-6
17
40
62
85
108
131
Sector Update: Cement | May 2014
89

JK Lakshmi: Operational snapshot
Market mix healthy and getting better (%)
North
10
South
East
11
26
64
West
Central
35
Other
nother
n states
35%
MAH
5%
Raj
30%
100
85
4.7
4.0
FY09
Timely expansion aids strong growth levers
Capacity (mt)
Dispatch (mt)
Utilization (%)
9.2
97
4.7
4.6
FY10
91
4.7
4.3
FY11
103
5.3
4.7
4.9
FY12
5.3
FY13
5.3
5.6
FY14
100
106
66
6.0
FY15E
9.8
69
6.7
FY16E
7.6
FY17E
77
9.8
90
65
Cap mix FY14 Cap mix FY15E Volume mix
GuJ
30%
3.7
3.6
FY08
EBITDA/ton best in class due to edge in energy cost
963
771
925
686
431
991
812
536
687
816
Trend in return ratios (%)
60
45
30
15
0
RoE
RoCE
FY08
FY09
FY10
FY11
FY12
FY13
FY14
FY15E
FY16E
FY17E
FY08
FY09
FY10
FY11
FY12
FY13
FY14
FY15E FY16E FY17E
Financial leverage high due to impact of 2x expansion
Interest as % of EBITDA
Depre as % of EBITDA
De-leveraging expected FY16 onward
Net debt (INR b)
CWIP as % CE
DER (x)
44
34
25
FY16E
16
FY17E
0.9
28.9
0.5
0.8
30.0
1.1
0.9
0.7
46
17
8
FY08
22
7
FY09
19
5
FY10
33
FY11
39
26
FY12
35
19
FY13
45
26
FY14
45
25
FY15E
0.5
0.4
6.9
3.5
FY08
5.9
2.9
FY09
8.90.2
2.3
FY10
0.2
2.4
15.5
9.5
FY13
12.3
FY14
4.5
FY15E
12.3
5.6
FY12
13.9
4.6
FY16E
11.2
4.6
FY17E
2.0
FY11
Sector Update: Cement | May 2014
90

J K Lakshmi Cement: Financials
Income Statement
Y/E March
Net Sales
Cha nge (%)
Tota l Expendi ture
% of Sa l es
EBITDA
Ma rgi n (%)
Depreci a ti on
EBIT
Int. a nd Fi na nce Cha rges
Other Income - Rec.
PBT bef. EO Exp.
EO Expens e/(Income)
PBT after EO Exp.
Current Ta x
Deferred Ta x
Ta x Ra te (%)
Reported PAT
PAT Adj for EO items
Cha nge (%)
Ma rgi n (%)
2012
17,177
30.4
13,824
80.5
3,353
19.5
1,297
2,056
874
638
1,820
392
1,427
179
161
23.8
1,088
1,387
134.5
8.1
2013
20,550
19.6
16,262
79.1
4,287
20.9
1,489
2,798
835
555
2,517
163
2,354
696
-99
25.3
1,757
1,879
35.5
9.1
2014
20,566
0.1
17,546
85.3
3,020
14.7
1,352
1,668
772
443
1,339
185
1,154
132
92
19.4
930
1,079
-42.6
5.2
2015E
23,662
15.1
19,376
81.9
4,286
18.1
1,791
2,496
1,108
400
1,788
0
1,788
429
18
25.0
1,341
1,341
24.3
5.7
(INR Million)
2016E
28,188
19.1
22,503
79.8
5,686
20.2
2,438
3,248
1,470
298
2,075
0
2,075
602
21
30.0
1,453
1,453
8.3
5.2
2017E
33,838
20.0
26,217
77.5
7,621
22.5
2,548
5,073
1,300
315
4,088
0
4,088
1,186
41
30.0
2,862
2,862
97.0
8.5
Balance Sheet
Y/E March
Equi ty Sha re Ca pi ta l
Tota l Res erves
Net Worth
Deferred Li a bi l i ti es
Tota l Loa ns
Capital Employed
Gros s Bl ock
Les s : Accum. Deprn.
Net Fixed Assets
Ca pi ta l WIP
Total Investments
Curr. Assets, Loans&Adv.
Inventory
Account Recei va bl es
Ca s h a nd Ba nk Ba l a nce
Loa ns a nd Adva nces
Curr. Liability & Prov.
Account Pa ya bl es
Provi s i ons
Net Current Assets
2012
612
11,140
11,752
1,233
11,004
23,989
24,486
11,193
13,293
2,941
4,538
7,085
1,201
382
890
4,612
3,868
3,513
355
3,218
2013
589
12,010
12,598
1,134
13,390
27,121
26,079
12,682
13,397
7,830
4,065
6,145
1,148
501
127
4,369
4,315
3,876
439
1,830
2014
589
12,444
13,032
1,226
16,042
30,300
29,753
14,034
15,719
9,080
4,477
6,388
1,024
555
352
4,457
5,364
4,950
415
1,024
30,300
2015E
589
13,374
13,963
1,244
18,042
33,249
43,333
15,824
27,508
1,500
3,477
7,044
1,229
639
118
5,059
6,281
5,637
644
763
33,249
(INR Million)
2016E
589
14,211
14,800
1,265
16,542
32,606
45,333
18,262
27,070
1,500
3,477
8,271
1,553
762
260
5,695
7,712
6,989
722
559
32,606
2017E
589
16,457
17,046
1,305
14,042
32,393
47,333
20,811
26,522
1,500
3,477
9,581
1,761
915
483
6,422
8,687
7,976
711
894
32,393
Appl. of Funds
23,989 27,121
E: MOSL Es ti ma tes ; * Adjus ted for trea s ury s tocks
Sector Update: Cement | May 2014
91

J K Lakshmi Cement: Financials
Ratios
Y/E March
Basic (INR) *
EPS
Ca s h EPS
BV/Sha re
DPS
Pa yout (%)
Valuation (x) *
P/E
Ca s h P/E
P/BV
EV/Sa l es
EV/EBITDA
EV/Ton (USD)
Di vi dend Yi el d (%)
Return Ratios (%)
RoE
RoCE
Working Capital Ratios
As s et Turnover (x)
Inventory (Da ys )
Debtor (Da ys )
Leverage Ratio (x)
Current Ra ti o
Debt/Equi ty
* Adjus ted for trea s ury s tocks
2012
11.3
21.9
96.0
1.9
25.3
15.4
8.0
1.8
1.4
6.9
83
1.1
12.5
12.9
0.7
25.5
7
1.8
0.9
2013
16.0
28.6
107.0
2.5
19.5
10.9
6.1
1.6
1.1
5.2
71
1.4
15.4
13.8
0.8
20.4
8
1.4
1.1
2014
9.2
20.7
110.7
2.0
29.6
19.1
8.5
1.6
1.2
7.9
76
1.1
8.4
7.7
0.7
18.2
9
1.2
1.2
2015E
11.4
26.6
118.6
3.0
30.6
15.3
6.6
1.5
1.5
8.1
64
1.7
9.9
9.5
0.7
19.0
9
1.1
1.3
2016E
12.3
33.1
125.7
4.5
42.4
14.2
5.3
1.4
1.2
5.8
57
2.6
10.1
11.2
0.9
20.1
9
1.1
1.1
2017E
24.3
46.0
144.8
4.5
21.5
7.2
3.8
1.2
0.9
4.0
52
2.6
18.0
17.3
1.0
19.0
9
1.1
0.8
Cash Flow Statement
Y/E March
Oper. Profi t/(Los s ) before Ta x
Interes t/Di vi dends Recd.
Depreci a ti on
Di rect Ta xes Pa i d
(Inc)/Dec i n WC
CF from Operations
EO expens e
CF from Operating incl EO
(i nc)/dec i n FA
(Pur)/Sa l e of Inves tments
CF from investments
Is s ue of Sha res
(Inc)/Dec i n Debt
Interes t Pa i d
Di vi dend Pa i d
CF from Fin. Activity
Inc/Dec of Cash
Add: Begi nni ng Ba l a nce
Closing Balance
2012
3,353
638
0
-179
-2,693
1,119
127
1,246
-3,831
740
-3,091
476
2,521
-874
-275
1,848
3
888
890
2013
4,287
555
0
-696
624
4,770
-163
4,607
-6,482
473
-6,009
-569
2,386
-835
-342
639
-764
890
127
2014
3,020
443
0
-132
1,032
4,362
-185
4,177
-4,924
-413
-5,337
-220
2,653
-772
-275
1,385
226
127
352
2015E
4,286
400
0
-429
27
4,284
0
4,284
-6,000
1,000
-5,000
0
2,000
-1,108
-410
482
-235
352
118
(INR Million)
2016E
5,686
298
0
-602
346
5,728
0
5,728
-2,000
0
-2,000
0
-1,500
-1,470
-616
-3,585
142
118
260
2017E
7,621
315
0
-1,186
-112
6,639
0
6,639
-2,000
0
-2,000
0
-2,500
-1,300
-616
-4,415
223
260
483
Sector Update: Cement | May 2014
92

Orient Cement: Entering into capex cycle
Financials & Valuation (INR b)
Y/E March
Sales
EBITDA
NP
Adj EPS (INR)
EPS Gr. (%)
BV/Sh. (INR)
RoE (%)
RoCE (%)
Pa yout (%)
Valuation
P/E (x)
P/BV (x)
EV/EBITDA (x)
EV/Ton (USD)
2014 2015E 2016E 2017E
14.3 15.7 19.2 23.5
2.1
2.6
3.6
5.4
1.0
1.3
0.9
1.9
4.9
6.3
4.5
9.4
-37.5 28.0 -29.2 111.4
40.5 45.0 47.7 54.8
12.7 14.8
9.6 18.4
15.5 12.7 10.6 15.3
47.5 36.8 52.0 24.6
15.6
1.9
7.5
52
12.2
1.7
6.2
55
17.3
1.6
8.5
65
8.2
1.4
5.4
62
Expansion to give impetus to volume growth, enrich market mix
ORCMNT’s 3m ton greenfield expansion at Gulbarga, Karnataka (1.6x existing capacity to 8m
tons by FY16) gives the required impetus to scale up volume growth and achieve better
market exposure. Despite presence in the South, ORCMNT’s core market exposure is superior
(almost 85% in Maharashtra and Telengana) and it enjoys much better utilization of 82% (v/s
69% in South-West). Gulbarga expansion would release (1) the Devapur (AP) plant to dispatch
more to AP, MP and East, and (2) the Jalgaon plant to cater to Maharashtra and Gujarat. In
turn, the Gulbarga plant would serve TN and Karnataka.
Cost leadership in cement may see moderate dilution
ORCMNT, being the lowest cost cement producer (15-20% lower than industry), traditionally
enjoys superior profitability. Its cost advantage emerges from higher proportion of linkage
coal (55-60%) and energy consumption efficiency. However, the advantage could reduce with
decline in linkage coal availability and rise in cost of incremental capacities.
Ambitious expansion plan may hurt medium-term balance sheet
ORCMNT aims at capacity of 15m tons by FY20 against 8m tons by 1QFY16, with plans of
greenfield expansions at (1) Rajasthan (2.5-3m tons), and (2) Chhattisgarh (2.5-3m tons) –
which would significantly diversify its market mix to the North and East. While successful
scale-up and market diversification could lead to re-rating in the longer term, sharp jump in
leverage (peak could be 2:1) during the capex cycle would be a pressure point.
Capex cycle overhang may limit upside; Neutral
Unlike many of its midcap peers, ORCMNT has just entered into capex cycle. Therefore, its
current balance sheet strength will meaningfully dilute by FY16. The stock trades at 8.5x/5.4x
FY16/17E EV/EBITDA and USD65/62 on EV/ton. Maintain
Neutral
with TP of ~INR88 (9x FY16E
EV/EBITDA, implied EV/ton of USD70).
Stock info
Equi ty Sha res (m)
52-Week Ra nge (INR)
1,6,12 Rel . Perf. (%)
M.Ca p. (INR b)
M.Ca p. (USD b)
204.9
85/30
44/78/-
15.8
0.3
Sector Update: Cement | May 2014
93

Orient Cement: Entering into capex cycle
§
The company is uniquely poised compared to peers, as it has been a late entry into the capex cycle, first with Gulbarga
§
expansion, followed by other North and East India expansions. This may gradually reduced B/S strength.
While our base case factors in for price increase of ~INR15/bag in FY17, in bull case (~INR30/bag price increase in FY17),
ORCMNT’s TP can be ~INR151 (implied EV/Ton of ~USD92 at 6x EV/EBITDA).
FY16 performance sensitivity to cement price change
Price
Change
(INR/Ton)
-100
0
100
250
300
400
500
Trend in EV/EBITDA (x)
TP
(INR/sh)
5
28
52
88
100
123
147
EBITDA/Ton EPS
(INR/Ton) (INR)
389
489
589
739
789
889
989
-1
1
2
4
5
7
8
PE (x)
-71.9
151.2
36.8
17.3
14.7
11.3
9.2
EV/EBITDA
(x)
16.9
13.3
10.9
8.5
7.9
6.9
6.2
EV/Ton
(US$)
68
67
67
65
65
64
63
EV/Ton at
Upside (%)
TP (USD)
37
46
56
70
75
84
94
-94
-63
-32
14
29
60
91
FY17 performance sensitivity to cement price change
Price
(INR/Ton)
0
100
200
300
400
500
600
Trend in EV/ton (USD)
TP
(INR/sh)
38
57
76
94
113
132
151
EBITDA/Ton
(INR/Ton)
665
765
865
965
1,065
1,165
1,265
EPS
3.9
5.7
7.6
9.4
11.3
13.2
15.0
PE (x)
20.0
13.5
10.2
8.2
6.8
5.9
5.1
EV/EBITDA
(x)
8.3
7.1
6.2
5.4
4.9
4.4
4.0
EV/Ton
(US$)
65
64
63
62
61
60
59
EV/Ton at
Upside (%)
TP (USD)
48
55
63
70
77
84
92
-51
-26
-2
23
47
71
96
Sector Update: Cement | May 2014
94

Orient Cement: Operational snapshot
Mix tilted towards South, but Karnataka base gives good exposure to West as
well; should benefit meaningfully from recovery in AP
North
40
South
East
25
West
Central
4
68
60
75
2
26
Gujarat
3%
MP, CT
GRH
6%
AP
24%
TN/Kar
nataka
2%
Mahara
shtra
65%
3.42.6
FY08
3.42.9
FY09
New expansion gives leeway to grow in better markets
Capacity (mt)
76
85
61
70
76
Dispatch (mt)
82
84
Utilization (%)
86
61
70
5.03.0
FY10
5.03.5
FY11
5.03.8
FY12
5.04.1
FY13
5.04.2
FY14
5.04.3
FY15E
8.04.9
FY16E
8.05.6
FY17E
Cap mix FY14 Cap mix FY16E Volume mix
With dilution in cost advantages, EBITDA/ton may remain below historical levels
1165
876
754
Capex cycle may keep return ratios modest (%)
24
RoE
RoCE
1079
1092
737
491
608
739
965
18
12
6
0
FY08
FY09
FY10
FY11
FY12
FY13
FY14
FY15E
FY16E
FY17E
FY13
FY14
FY15E
FY16E
FY17E
Financial leverage to increase
Interest as % of EBITDA
Depre as % of EBITDA
35
27
21
8
FY11
14
5
FY12
19
6
FY13
27
7
FY14
23
10
FY15E
FY16E
34
25
FY17E
B/S strength to deteriorate with entry into capex cycle
Net debt (INR b)
CWIP as % CE
52.2
1.7
28.1
3.8
-0.2
0.0
FY13
3.5
0.4
FY14
FY15E
FY16E
1.4
12.8
3.9
16.2
DER (x)
1.3
14.9
4.2
FY17E
Sector Update: Cement | May 2014
95

Orient Cement: Financials
Income Statement
Y/E March
Net Sales
Cha nge (%)
Tota l Expendi ture
% of Sa l es
EBITDA
Ma rgi n (%)
Depreci a ti on
EBIT
Int. a nd Fi na nce Cha rges
Other Income - Rec.
PBT bef. EO Exp.
EO Expens e/(Income)
PBT after EO Exp.
Current Ta x
Deferred Ta x
Ta x Ra te (%)
Reported PAT
PAT Adj for EO items
Cha nge (%)
Ma rgi n (%)
Net Profit
2012
13,729
33.2
9,600
69.9
4,129
30.1
581
3,549
189
234
3,594
0
3,594
1,216
0
33.8
2,378
2,378
64.5
17.3
2,378
2013
14,844
8.1
11,829
79.7
3,015
20.3
561
2,455
187
219
2,486
0
2,486
794
76
35.0
1,617
1,617
-32.0
10.9
1,617
2014
14,302
-3.7
12,237
85.6
2,065
14.4
564
1,501
144
175
1,532
0
1,532
522
0
34.1
1,010
1,010
-37.5
7.1
1,010
2015E
15,737
10.0
13,118
83.4
2,619
16.6
600
2,019
260
200
1,959
0
1,959
627
39
34.0
1,293
1,293
28.0
8.2
1,293
(INR Million)
2016E
2017E
19,168 23,531
21.8
22.8
15,538
81.1
3,630
18.9
1,255
2,375
1,228
240
1,386
0
1,386
444
28
34.0
915
915
-29.2
4.8
915
18,126
77.0
5,406
23.0
1,436
3,970
1,366
240
2,844
0
2,844
910
0
32.0
1,934
1,934
111.4
8.2
1,934
Balance Sheet
Y/E March
Equi ty Sha re Ca pi ta l
Tota l Res erves
Net Worth
Deferred Li a bi l i ti es
Tota l Loa ns
Capital Employed
Gros s Bl ock
Les s : Accum. Deprn.
Net Fixed Assets
Ca pi ta l WIP
Total Investments
Curr. Assets, Loans&Adv.
Inventory
Account Recei va bl es
Ca s h a nd Ba nk Ba l a nce
Loa ns a nd Adva nces
Curr. Liability & Prov.
Account Pa ya bl es
Provi s i ons
Net Current Assets
Appl. of Funds
E: MOSL Es ti ma tes
2012
205
2013
205
7,363
7,567
1,293
1,489
10,350
12,766
4,228
8,538
397
875
4,391
869
765
1,699
1,059
3,261
2,649
612
1,130
10,350
2014
205
8,083
8,288
1,266
4,303
13,857
12,426
4,792
7,635
3,897
875
3,774
713
647
816
1,598
1,756
1,425
331
2,018
13,857
2015E
205
9,016
9,221
1,305
13,228
23,754
14,426
5,392
9,035
12,397
875
4,139
862
647
475
2,156
2,124
1,725
400
2,015
23,754
(INR Million)
2016E
2017E
205
205
9,571 11,026
9,776
1,333
17,078
28,187
31,226
6,647
24,579
1,097
875
5,112
1,050
788
911
2,363
2,909
2,626
283
2,204
28,187
11,231
1,333
17,078
29,642
32,574
8,083
24,491
1,250
875
7,363
1,289
967
2,206
2,901
3,770
3,223
546
3,594
29,642
Sector Update: Cement | May 2014
96

Orient Cement: Financials
Ratios
Y/E March
Basic (INR)
Consol EPS
Ca s h EPS
BV/Sha re
DPS
Pa yout (%)
Valuation (x)
P/E
Ca s h P/E
P/BV
EV/Sa l es
EV/EBITDA
EV/Ton (USD)
Di vi dend Yi el d (%)
Return Ratios (%)
RoE
RoCE
Working Capital Ratios
As s et Turnover (x)
Inventory (Da ys )
Debtor (Da ys )
Leverage Ratio (x)
Current Ra ti o
Debt/Equi ty
2012
11.6
14.4
2013
7.9
10.6
36.9
2.0
29.5
9.8
7.3
2.1
1.0
5.0
51
2.6
21.4
29.5
1.4
21.4
10.3
1.3
0.2
2014
4.9
7.7
40.5
1.5
47.5
15.6
10.0
1.9
1.1
7.5
52
1.9
12.7
15.5
1.0
18.2
8.1
2.1
0.5
2015E
6.3
9.2
45.0
1.5
36.8
12.2
8.3
1.7
1.0
6.2
55
1.9
14.8
12.7
0.7
20.0
7.0
1.9
1.4
2016E
4.5
10.6
47.7
1.5
52.0
17.3
1.6
1.6
8.5
65
1.9
9.6
10.6
0.7
20.0
7.1
1.8
1.7
2017E
9.4
16.4
54.8
2.0
24.6
8.2
1.4
1.3
5.4
62
2.6
18.4
15.3
0.8
20.0
7.1
2.0
1.5
Cash Flow Statement
Y/E March
Oper. Profi t/(Los s ) before Ta x
Interes t/Di vi dends Recd.
Depreci a ti on
Di rect Ta xes Pa i d
(Inc)/Dec i n WC
CF from Operations
EO expens e
CF from Operating incl EO
(i nc)/dec i n FA
(Pur)/Sa l e of Inves tments
CF from investments
Is s ue of Sha res
(Inc)/Dec i n Debt
Interes t Pa i d
Di vi dend Pa i d
CF from Fin. Activity
Inc/Dec of Cash
Add: Begi nni ng Ba l a nce
Closing Balance
2013
2014
1,501
175
564
-522
1,771
-53
0
-53
-3,161
90
-3,071
70
2,814
-144
-360
2,380
-744
1,699
955
2015E
2,019
200
600
-627
339
1,853
0
1,853
-10,500
0
-10,500
0
8,925
-260
-360
8,305
-341
816
475
(INR Million)
2016E
2017E
2,375
3,970
240
240
1,255
1,436
-444
-910
-248
95
3,674
4,640
0
3,674
-5,500
0
-5,500
0
3,850
-1,228
-360
2,262
437
475
911
0
4,640
-1,500
0
-1,500
0
0
-1,366
-479
-1,846
1,295
911
2,206
6.6
5.3
1.2
3.8
54
0.0
Sector Update: Cement | May 2014
97

Prism Cement – On cusp of recovery
Financials & Valuation (INR b)
Y/E March
2014
49.4
1.2
-1.7
-3.3
175.7
20.0
-15.9
-0.7
0.0
-16.4
2.7
37.5
121
2015E
2016E
2017E
75.5
9.8
4.4
8.8
74.4
33.0
30.6
28.2
6.6
6.2
1.7
3.8
48
Sales
EBITDA
NP
Adj EPS (INR)
EPS Gr. (%)
BV/Sh. (INR)
RoE (%)
RoCE (%)
Pa yout (%)
Valuations
P/E (x)
P/BV (x)
EV/EBITDA (x)
EV/Ton (USD)
57.0
66.7
4.1
7.4
0.1
2.5
0.2