29 May 2014
4QFY14 Results Update | Sector:
Oil & Gas
ONGC
BSE SENSEX
24,234
Bloomberg
S&P CNX
7,236
ONGC IN
CMP: INR375
TP: INR435
Buy
Equity Shares (m)
8,555.5
M.Cap. (INR b) / (USD 3,205.3/54.3
b)
52-Week Range (INR)
425/234
1, 6, 12 Rel. Per (%)
9/9/-8
Financials & Valuation (INR Billion)
Y/E Mar
Net Sales
EBITDA
Adj PAT
EPS (INR)
Growth
(%)
BV/Share
(INR)
RoE (%)
RoCE (%)
P/E (x)
P/BV (X)
2014 2015E 2016E
1,732
570
264
31.0
9.9
199
16.6
14.6
12.1
1.9
1,881
632
301
34.8
14.2
221
16.6
14.3
10.9
1.7
2,032
752
348
40.2
15.6
247
17.2
14.9
9.3
1.5
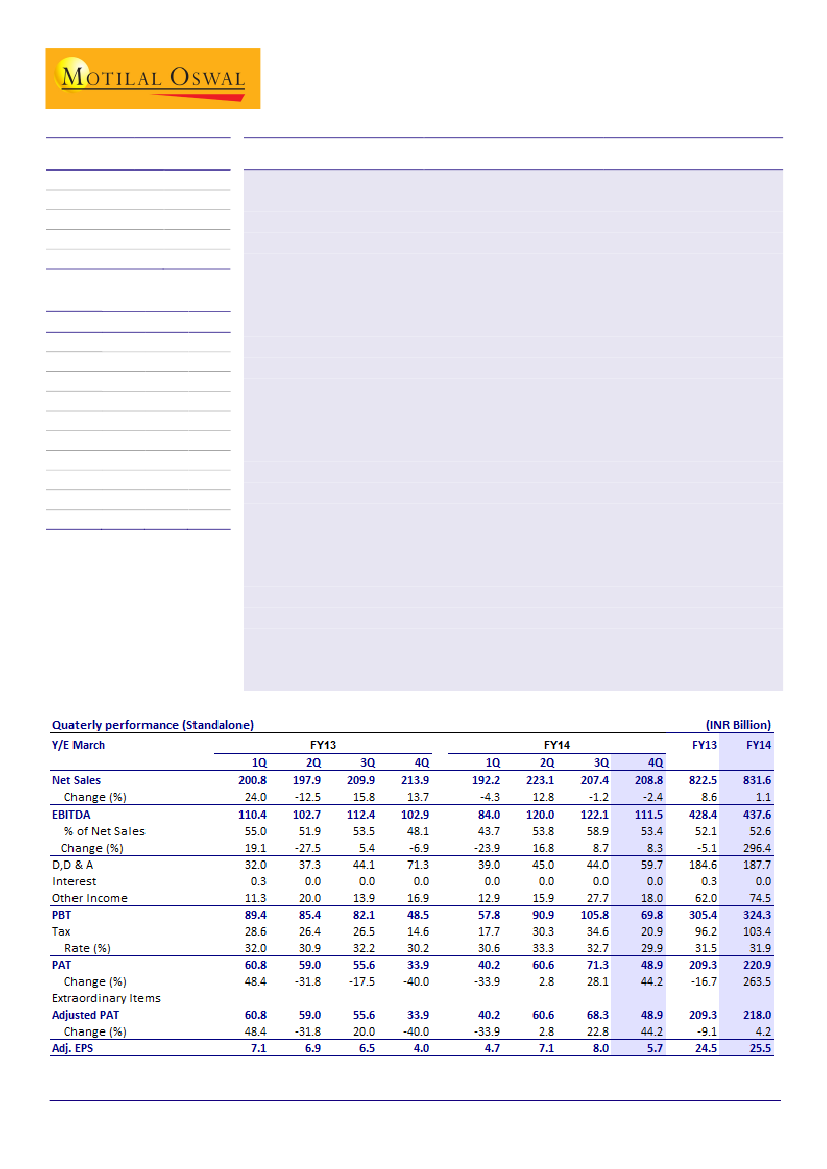
ONGC’s reported largely in-line EBITDA at INR111b (+8% YoY, -9% QoQ) despite higher
subsidy at INR162b (est INR141b) due to (a) lower opex at INR33b (est INR43b; -30%
YoY) and (b) higher oil and gas revenues by INR8b and (c) lower staff cost at INR4.5b
(est. INR6b, -38% YoY). Difference at PAT level increased due to higher D,D&A at
INR59.7b (est. INR51b) partly compensated by higher other income at INR18b (est
INR15.6b).
Full year standalone (SA) PAT stands at INR221b and EPS at INR25.8 (+5% YoY) and
adj. consolidated PAT at INR264b and EPS at INR30.8 (+9% YoY). Higher
consolidated EPS growth is led by OVL and MRPL returning back to black.
4QFY14 net realization at USD32.8/bbl:
4QFY14 gross realization stood at
USD107/bbl (-6% YoY and -1% QoQ) and post the subsidy stood of USD73.9/bbl
net realization stood at USD32.8/bbl (-36% YoY, -29% QoQ).
Expect under recoveries to halve by FY16 v/s FY14:
We expect gross under
recoveries to reduce by ~48% by FY16 to INR729b. We expect government to first
take benefit of lower subsidy and hence model upstream subsidy reduction of only
27% by FY16.
Maintain Buy:
We remain positive on ONGC due to (1) likely increase in net
realization due to lower subsidy driven by continued diesel price hikes, (2)
significant beneficiary of scheduled gas price hike in FY15, (3) attractive valuations.
Upside potential to our FY15 gas price assumption:
We model gas price of
USD6.3/mmbtu from FY15 v/s likely new gas price of USD8.4/mmbtu, to factor in
likely subsidy towards power/fertilizer sector. However, if the full gas price benefit
is passed to Oil India then FY15E EPS will further increase by 16%.
Implied dividend yield at ~3% on FY15E. The stock trades at 9.3x FY16 EPS of
INR40.2. Our SOTP-based target price for ONGC stands at INR435/sh. Buy.
Harshad Borawake
(HarshadBorawake@MotilalOswal.com); +91 22 3982 5432
Nitish Rathi
(Nitish.Rathi@motilaloswal.com); +91 22 3982 5558
Investors are advised to refer through disclosures made at the end of the Research Report.

ONGC
ONGC: Quarterly performance snapshot
Source: Company, MOSL
4QFY14 subsidy payout of INR162b; net realization at USD32.8/bbl
ONGC’s subsidy payout stood at INR162b (v/s INR123b in 4QFY13 and
INR138b in 3QFY14).
Gross realization in 4QFY14 was at USD106.7/bbl, while the subsidy payout
was at USD73.9/bbl resulting in net realization of USD32.8/bbl, down 6%
YoY and up 1% QoQ.
We model upstream subsidy sharing at INR645/488b for upstream for
FY15/FY16.
4QFY14 subsidy at INR162b; @USD74/bbl subsidy (INRb)
162
121 120
55
30
42
57
125
142 123
123
124 123
138
138
ONGC: 4QFY14 Net realization at USD32.8/bbl (USD/bbl)
Net Realization
Subsidy Burden
126
1Q 2Q 3Q 4Q 1Q 2Q 3Q 4Q 1Q 2Q 3Q 4Q 1Q 2Q 3Q 4Q
FY11
FY12
FY13
FY14
FY11
FY12
FY13
FY14
Source: Company, MOSL
29 May 2014
Source: Company, MOSL
2

ONGC
Conservatively model 27% decline in upstream subsidy by FY16 to INR488b as against 48%
decline in gross under recoveries bt FY16 to INR729b (INR b)
Source: PPAC, MoPNG, MOSL
D,D&A surprises again; up 36% QoQ and down 16% YoY
ONGC’s D,D&A expenses in 3QFY14 stood at INR44b (v/s est. of INR45.6b);
flat YoY and down 2% QoQ.
Historically it has been observed that the D,D&A charges are normally
higher during second half of the year as ONGC typically charges the well
write-offs at the end of the year when it reviews its exploration
performance.
D,D&A (incl. write-off) again up on QoQ basis but down on YoY basis to INR60b (INRb)
Depletion
80
60
40
20
0
1Q 2Q 3Q 4Q 1Q 2Q 3Q 4Q 1Q 2Q 3Q 4Q 1Q 2Q 3Q 4Q 1Q 2Q 3Q 4Q
FY10
FY11
FY12
FY13
FY14
Depreciation
Dry Wells
Survey
Others
Average
Source: Company, MOSL
29 May 2014
3

ONGC
D&A charge are typically higher in 2H; 2HFY14 was no exception as expected (INRb)
115
91
52
33
54
37
61
71
50
75
55
84
94
74
65
84
104
41
Source: Company, MOSL
4QFY14 operational highlights
Oil production (excl. JV) stood at 5.53mmt (-1.6% YoY and -0.7% QoQ); sales
(excl. JV) were at 4.72mmt (-1.4% YoY and -0.4% QoQ).
Gas production (excl. JV) stood at 5.81bcm (flat YoY, -1.2% QoQ); sales (excl.
JV) were at 4.56bcm (-1.3% YoY, flat QoQ).
JV oil production was 0.94mmt (+10% YoY, -4% QoQ), while JV gas
production was 0.36bcm (-7% YoY, -10% QoQ); gas fall led by PMT.
Oil sales down 1.4% YoY and 0.4% QoQ (mmt)
JV
ONGC
Total
Total
Oil standalone (excl. JV) production down 1.6% YoY (mmt)
JV
ONGC
FY11
FY12
FY13
FY14
FY11
FY12
FY13
FY14
*Oil Production trend
Source: Company, MOSL
*Oil Sales trend
Source: Company, MOSL
JV gas production down 7% YoY and 10% QoQ (bcm)
JV
ONGC
Total
Gas sales (incl. JV) down 1.8% YoY and 1% QoQ (bcm)
JV
ONGC
Total
FY11
FY12
FY13
FY14
FY11
FY12
FY13
FY14
*Gas Production trend
Source: Company, MOSL
*Gas Sales trend
Source: Company, MOSL
29 May 2014
4

ONGC
Oil + Gas Production down 1.5% QoQ (mmtoe)
Gas (bcm)
Oil (mmt)
Total
Oil + Gas Sales down 1% QoQ (mmtoe)
Gas (bcm)
Oil (mmt)
Total (mmtoe)
FY11
FY12
FY13
FY14
FY11
FY12
FY13
FY14
*Oil + Gas Production trend
Source: Company, MOSL
*Oil + Gas Sales trend
Source: Company, MOSL
OVL Production Update
ONGC Videsh production reported FY14 PAT at INR44.5b (+13% YoY) led by
net sales increase of 22% to INR218b.
OVL’s EPS stood at INR5.2, implying 17% contribution to consolidated EPS.
FY14 oil production stood at 5.49mmt (+26% YoY) and gas production at
2.87bcm (-2% YoY)
OVL’s contribution to ONGC’s consolidated EPS at 17% and in production at 14%
Net Sales
PAT
EPS (INR/sh)
4.6
3.0
3.2
226
26
FY11
27
FY12
5.2
2.4
152
21
FY10
185
178
39
FY13
218
44
FY14
Source: Company, MOSL
OVL’s Oil and Gas Production up 1.1mmt (15%) YoY led by Azerbaijan, ACG acuiqition which contributed 0.98mmtoe
10
8
6
4
2
0
FY08
FY09
FY10
FY11
FY12
FY13
FY14
8.80
8.36
8.87
9.45
8.75
7.26
8.36
A1 & A3 Myanmar
Imperial Energy
BC-10 Brazil
ACG
Venezuela - Carabobo
Venezuela
Colombia
Block 24, Syria
AFPC, Syria
5A Sudan
GNOP, Sudan
Sakhalin-1
06.1, Vietnam
Source: Company, MOSL
29 May 2014
5

ONGC
Valuation and view
We remain positive on ONGC due to (1) likely increase in net realization due
to lower subsidy driven by continued diesel price hikes, (2) significant
beneficiary of scheduled gas price hike in FY15, (3) attractive valuations.
Key things to watch: (1) Continuance of diesel reforms, (2) Clarity on benefit
of gas price hike, (3) Subsidy sharing and (4) Visibility on production growth.
Upside potential to our FY15 gas price assumption: We model gas price of
USD6.3/mmbtu from FY15 v/s likely new gas price of USD8.4/mmbtu, to
factor in likely subsidy towards power/fertilizer sector. However, if the full
gas price benefit is passed to Oil India then FY15E EPS will further increase
by 16%.
Timely execution of diesel reforms and passing on of benefits of gas price
hike could lead to stock's re-rating.
We are increasing our DCF based target price to INR435/sh to factor in long
term net realization of INR65/bbl (v/s USD60/bbl) from FY18 v/s
USD41.8/bbl in FY15 and USD58.1/bbl in FY16.
Implied dividend yield of FY15E dividend stands at ~3%. The stock trades at
9.3xx FY16 EPS of INR40.2. Our SOTP-based target price for ONGC stands at
INR435/sh. Buy.
Valuation Summary
ONGC Domestic
OVL
Cairn India
Net (Debt) / Cash
Mozambique Block
Listed Investments
Target Price
USDB
41
17
2
-6
4
2
60
INRB
2,516
1,026
131
-369
269
154
3,725
INR/sh
294
120
15
-43
31
18
435
Source: MOSL
Valuation method
DCF Based, WACC of 11.5%
2P reserves @ USD5/boe (same as ONGC)
DCF based; 25% discount
At investment value
MRPL, IOC, GAIL & Petronet LNG; 25%
discount to our target/market price
ONGC: Key Assumptions
Source: Company, MOSL
29 May 2014
6

ONGC
ONGC: Story in charts
Despite ad-hoc subsidy, last 10 yr EPS CAGR at ~10% (INR)
EPS (Standalone)
EPS (MRPL & Others)
30.4
23.1
3.3
18.9
22.7
2.4
19.6
24.5
3.0
20.4
26.8
3.2
EPS (OVL)
EPS (Consolidated)
40.2
28.3
4.6
24.5
31.0
5.2
25.8
34.8
5.3
6.0
Impressive RRR of >1 in last eight years
28.4
32.8
FY09
FY10
FY11
FY12
FY13
FY14
FY15E FY16E
Source: Company, MOSL
Expect Production increase in FY15 led by development
projects
Expect Production increase in FY15 led by IOR /
redevelopment projects
Source: Company, MOSL
Expect domestic production uptick in coming years (mmt)
Oil Prodn (mmt)
Gas Prodn (bcm)
Total (mmtoe)
53.4 53.5 51.2 52.8 53.1 52.6 52.1 52.6 52.4 51.5 51.0 53.6 55.2
25.7 25.4 25.0 24.9 25.1 25.4 25.6 25.3 25.5 25.3 24.9 26.4 27.0
27.7 28.1 26.2 27.9 27.9 27.1 26.5 27.3 26.9 26.1 26.1 27.2 28.1
FY04
FY06
FY08
FY10
FY12
FY14
FY16E
Recent acquisitions to lead OVL to next growth phase (mmt)
Source: Company, MOSL
29 May 2014
7

ONGC
Source: Company, MOSL
ONGC: Story in charts
Expect under recoveries to halve by FY16E (INRb)
Under recoveries
in INR b
Diesel
Kerosene
1,385
1,033
773
400 494
461
780
LPG
1,610
1,399
831
60
729
17
42
FY06
66
33
22
44
53
40
86 88
72
16
56
Petrol
Total
Leading to increase in net realization (USD/bbl)
Net
Upstream Discount
117
89
62
36
63
66
64
48
Gross
111 108 106 106
48
54
56
48
42
FY14E
42
58
FY06 FY07 FY08 FY09 FY10 FY11 FY12 FY13 FY14 FY15EFY16E
FY08
FY10
FY12
FY16E
Source: Company, MOSL
Domestic gas price sensitivity to FY15E EPS and SOTP
34.0
34.8
36.7
39.4
42.3
Healthy Oil to Gas reserve ratio (mmtoe)
29.0
31.2
4.2
5.0
6.0
6.3
7.0
Gas Price (USD/mmbtu)
8.0
9.0
Source: Company, MOSL
ONGC 1 Yr Fwd P/E Chart
15
12
9.7
9
6
7.2
9.4
PE (x)
Median(x)
Peak(x)
Min(x)
Avg(x)
13.5
11.6
ONGC 1 Yr Fwd P/B Chart
PB (x)
Median(x)
3.4
2.6
1.8
1.0
2.2
2.0
1.9
Peak(x)
Min(x)
Avg(x)
3.1
1.2
Source: Company, MOSL
29 May 2014
8

ONGC
ONGC: an investment profile
Company description
ONGC, a Fortune 500 company, is an eminent
exploration and production (E&P) company in India.
With over 300 discoveries, it has established in-place
reserves of 6.9b ton of oil equivalent (btoe), with
ultimate reserves of 2.4btoe. It currently accounts for
~68% of India's domestic oil and gas production.
Through its 100% subsidiary ONGC Videsh Limited
(OVL), it has equity investments in E&P blocks in 16
countries. Downstream presence is marked through its
subsidiary (71.6% stake), MRPL.
however we expect volume growth in long term led
by IOR/EOR, marginal fields and monetization of the
discovered fields. Increased capex in the large
unexplored NELP acreage could result in significant
reserve accretion in future.
Key investment risks
Key investment arguments
Diesel reforms to lead to significant cut in under
recoveries: Recently announced diesel reforms (a)
increasing diesel prices by INR 0.5/ltr every month
and (b) Market pricing for bulk buyers; would lead to
a significant cut in under recoveries (~40% reduction
in under recoveries in FY15 over FY13).
Gas price hike could add significantly to ONGC’s
earnings: Recently CCEA has approved Rangarajan
committee formula’s implying ~USD8/mmbtu for
domestically produced gas from FY15. This could add
significantly to ONGC’s earnings if the benefits are
passed on to the company.
Increased capex, IOR/EOR projects to provide
production growth: Impressive RRR>1 for last 6
years. Production likely to be flat in short-term,
Ad-hocism
in subsidy sharing. Delay
in
implementation of announced diesel reforms.
Acquisition of overseas assets at high valuations
against stiff competition from China.
Slowdown in deep water development due to
technological barriers.
Recent developments
Government, through Cabinet Committee on
Economic Affairs (CCEA) approved the Rangarajan
Committee’s gas price formula implying new gas
price at USD8.4/mmbtu applicable from FY15 and will
be valid for 5 years.
Valuation and view
The stock trades at 9.3xx FY16 EPS of INR40.2. Our
SOTP-based target price for ONGC stands at
INR435/sh.
Buy.
Target price and recommendation
Current
Price (INR)
375
Target
Price (INR)
435
Upside
(%)
16
Reco
Buy
EPS: MOSL forecast v/s consensus (INR)
MOSL
Forecast
34.8
40.2
Consensus
Forecast
38.1
41.1
Variation
(%)
-8.7
-2.2
FY15
FY16
Shareholding pattern (%)
Promoter
Domestic Inst
Foreign
Others
Mar-14
68.9
10.9
6.7
13.5
Dec-13
69.2
10.5
6.8
13.5
Mar-14
69.2
10.8
6.3
13.6
Stock performance (1-year)
29 May 2014
9

ONGC
Financials and valuation
29 May 2014
10

ONGC
NOTES
29 May 2014
11

Disclosures
This report is for personal information of the authorized recipient and does not construe to be any investment, legal or taxation advice to you. This research report does not constitute an offer, invitation or
inducement to invest in securities or other investments and Motilal Oswal Securities Limited (hereinafter referred as MOSt) is not soliciting any action based upon it. This report is not for public distribution
and has been furnished to you solely for your information and should not be reproduced or redistributed to any other person in any form.
Unauthorized disclosure, use, dissemination or copying (either whole or partial) of this information, is prohibited. The person accessing this information specifically agrees to exempt MOSt or any of its
affiliates or employees from, any and all responsibility/liability arising from such misuse and agrees not to hold MOSt or any of its affiliates or employees responsible for any such misuse and further agrees
to hold MOSt or any of its affiliates or employees free and harmless from all losses, costs, damages, expenses that may be suffered by the person accessing this information due to any errors and delays.
The information contained herein is based on publicly available data or other sources believed to be reliable. While we would endeavour to update the information herein on reasonable basis, MOSt and/or
its affiliates are under no obligation to update the information. Also there may be regulatory, compliance, or other reasons that may prevent MOSt and/or its affiliates from doing so. MOSt or any of its
affiliates or employees shall not be in any way responsible and liable for any loss or damage that may arise to any person from any inadvertent error in the information contained in this report. MOSt or any
of its affiliates or employees do not provide, at any time, any express or implied warranty of any kind, regarding any matter pertaining to this report, including without limitation the implied warranties of
merchantability, fitness for a particular purpose, and non-infringement. The recipients of this report should rely on their own investigations.
ONGC
This report is intended for distribution to institutional investors. Recipients who are not institutional investors should seek advice of their independent financial advisor prior to taking any investment decision
based on this report or for any necessary explanation of its contents.
MOSt and/or its affiliates and/or employees may have interests/positions, financial or otherwise in the securities mentioned in this report. To enhance transparency, MOSt has incorporated a Disclosure of
Interest Statement in this document. This should, however, not be treated as endorsement of the views expressed in the report.
Disclosure of Interest Statement
1. Analyst ownership of the stock
2. Group/Directors ownership of the stock
3. Broking relationship with company covered
4. Investment Banking relationship with company covered
OIL & NATURAL GAS CORP LTD
No
No
No
No
Analyst Certification
The views expressed in this research report accurately reflect the personal views of the analyst(s) about the subject securities or issues, and no part of the compensation of the research analyst(s) was, is,
or will be directly or indirectly related to the specific recommendations and views expressed by research analyst(s) in this report. The research analysts, strategists, or research associates principally
responsible for preparation of MOSt research receive compensation based upon various factors, including quality of research, investor client feedback, stock picking, competitive factors and firm revenues.
This report is not directed or intended for distribution to or use by any person or entity resident in a state, country or any jurisdiction, where such distribution, publication, availability or use would be contrary
to law, regulation or which would subject MOSt & its group companies to registration or licensing requirements within such jurisdictions.
Regional Disclosures (outside India)
This report is intended for distribution only to persons having professional experience in matters relating to investments as described in Article 19 of the Financial Services and Markets Act 2000 (Financial
Promotion) Order 2005 (referred to as "investment professionals"). This document must not be acted on or relied on by persons who are not investment professionals. Any investment or investment activity
to which this document relates is only available to investment professionals and will be engaged in only with such persons.
For U.K.
Motilal Oswal Securities Limited (MOSL) is not a registered broker - dealer under the U.S. Securities Exchange Act of 1934, as amended (the"1934 act") and under applicable state laws in the United
States. In addition MOSL is not a registered investment adviser under the U.S. Investment Advisers Act of 1940, as amended (the "Advisers Act" and together with the 1934 Act, the "Acts), and under
applicable state laws in the United States. Accordingly, in the absence of specific exemption under the Acts, any brokerage and investment services provided by MOSL, including the products and services
described herein are not available to or intended for U.S. persons.
This report is intended for distribution only to "Major Institutional Investors" as defined by Rule 15a-6(b)(4) of the Exchange Act and interpretations thereof by SEC (henceforth referred to as "major
institutional investors"). This document must not be acted on or relied on by persons who are not major institutional investors. Any investment or investment activity to which this document relates is only
available to major institutional investors and will be engaged in only with major institutional investors. In reliance on the exemption from registration provided by Rule 15a-6 of the U.S. Securities Exchange
Act of 1934, as amended (the "Exchange Act") and interpretations thereof by the U.S. Securities and Exchange Commission ("SEC") in order to conduct business with Institutional Investors based in the
U.S., MOSL has entered into a chaperoning agreement with a U.S. registered broker-dealer, Motilal Oswal Securities International Private Limited. ("MOSIPL"). Any business interaction pursuant to this
report will have to be executed within the provisions of this chaperoning agreement.
The Research Analysts contributing to the report may not be registered /qualified as research analyst with FINRA. Such research analyst may not be associated persons of the U.S. registered broker-
dealer, MOSIPL, and therefore, may not be subject to NASD rule 2711 and NYSE Rule 472 restrictions on communication with a subject company, public appearances and trading securities held by a
research analyst account.
For U.S.
Motilal Oswal Capital Markets Singapore Pte Limited is acting as an exempt financial advisor under section 23(1)(f) of the Financial Advisers Act(FAA) read with regulation 17(1)(d) of the Financial
Advisors Regulations and is a subsidiary of Motilal Oswal Securities Limited in India. This research is distributed in Singapore by Motilal Oswal Capital Markets Singapore Pte Limited and it is only directed
in Singapore to accredited investors, as defined in the Financial Advisers Regulations and the Securities and Futures Act (Chapter 289), as amended from time to time.
In respect of any matter arising from or in connection with the research you could contact the following representatives of Motilal Oswal Capital Markets Singapore Pte Limited:
Anosh Koppikar
Kadambari Balachandran
Email:anosh.Koppikar@motilaloswal.com
Email : kadambari.balachandran@motilaloswal.com
Contact(+65)68189232
Contact: (+65) 68189233 / 65249115
Office Address:21 (Suite 31),16 Collyer Quay,Singapore 04931
For Singapore
Motilal Oswal Securities Ltd
29 May 2014
Motilal Oswal Tower, Level 9, Sayani Road, Prabhadevi, Mumbai 400 025
Phone: +91 22 3982 5500 E-mail: reports@motilaloswal.com
12