20 June 2014
WABCO India
spotlight
The Idea Junction
Stock Info
Bloomberg
CMP (INR)
Equity Shares (m)
52-Week Range (INR)
1, 6, 12 Rel. Per (%)
M.Cap. (INR b)
M.Cap. (USD b)
WIL IN
3,076
19.0
3,234/1,510
34/46/50
58.3
1.0
Dominant player in technology intensive braking systems
Multiple growth drivers: Mandatory ABS regulation, CV recovery, exports
With over 85% share in OEM MHCV braking systems, WIL would be a key beneficiary of
(a) mandatory adoption of ABS for wider categories of MHCVs, effective October 2015,
(b) expected revival in MHCV cycle from 2HFY14, and (c) increasing content per vehicle,
as the CV industry evolves. We expect 20.6% CAGR in domestic revenues over FY14-17.
WIL is emerging as an export hub for its parent, thanks to its effective India-based cost
structure. Over FY11-14, its export revenues have grown 3.5x to INR4.1b, contributing
39% of revenues. We expect 20% CAGR in export revenues over FY14-17.
Dominant market position in a technology intensive and critical component ensures
strong pricing power, resulting in stable margins across cycles (average EBITDA margin
of 17.9% over FY10-14).
We expect revenues, EBITDA and PAT to grow at a CAGR of 30.3%, 43%, 41.9%,
respectively, supported by robust return ratios (average RoCE of 30%) and strong FCF
(INR3b over FY14-17). Expect premium valuation to sustain on attractive growth and
strong competitive positioning.
Key risks include delay in adoption of ABS and increase in royalty by parent.
Financials & Valuations (INR b)
Y/E March
Sales
EBITDA
NP
EPS (INR)
EPS Gr. (%)
BV/Sh. (INR)
RoE (%)
RoCE (%)
P/E (x)
P/BV (x)
EV/EBITDA (x)
EV/Sales (x)
2015E 2016E 2017E
12.4
1.9
1.2
64.5
4.1
456.9
15.1
21.3
47.7
6.7
29.0
4.5
17.3
3.3
2.1
79.9
22.7
32.0
26.5
5.4
16.8
3.2
24.6
4.9
3.3
52.7
27.1
38.4
17.4
4.2
10.9
2.2
116.0 177.1
567.1 738.4
WABCO India (WIL) is a 75% subsidiary of Wabco Holdings Inc, a global leader in
anti-lock braking systems (ABS) for MHCVs. WIL pioneered air brake systems for
CVs in India and currently enjoys a dominant market position, with over 85%
share in braking systems, supported by superior R&D capabilities and strong
technology parentage. WIL's performance has been resilient to the cyclicality in
the CV industry, led by strong growth in exports, replacement demand, and
increasing content per vehicle. Over FY09-14, its revenue, EBITDA and PAT grew
at a CAGR of 21%, 25% and 27%, respectively, with average RoCE at 38.5%.
Shareholding pattern (%)
As on
Mar-14 Dec-13 Mar-13
Promoter
75.0
75.0
75.0
Dom. Inst
8.7
9.4
8.7
Foreign
2.7
2.2
2.6
Others
13.6
13.4
13.8
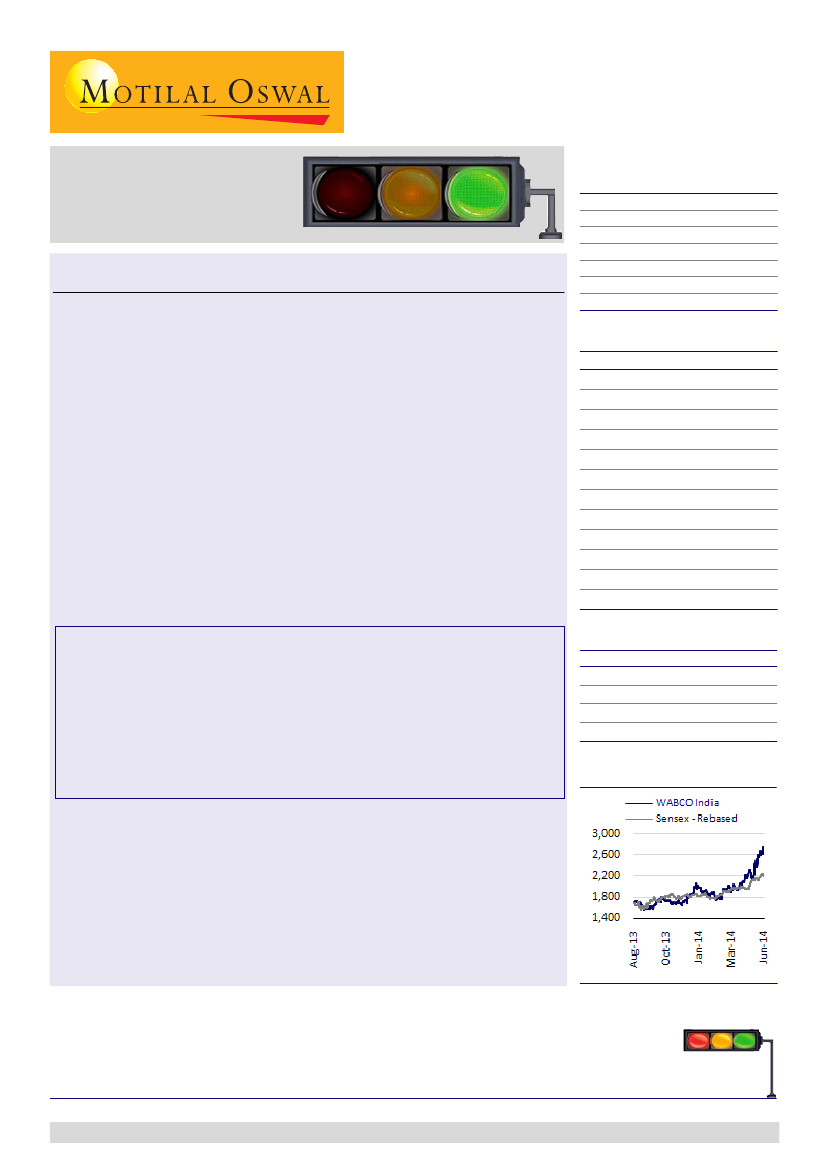
Stock performance (1 year)
Key beneficiary of mandatory ABS adoption, MHCV up-cycle, increasing
content per vehicle
Following several emerging market trends towards tightening safety
regulations, Indian regulators have issued final notification of adoption of ABS
for wider categories of MHCVs (above 12T for goods, 5T for buses), effective
October 2015.
With over 85% share in OEM MHCV braking systems, WIL is likely to be a key
beneficiary of mandatory adoption of ABS.
Spotlight
is a new offering from the Research team at Motilal Oswal. While our Coverage Universe
is a wide representation of investment opportunities in India, there are many emerging names in the
Mid Cap Universe that are not under coverage. Spotlight is an attempt to feature such mid cap stocks
by visiting such companies. We are not including these stocks under our active coverage at this point
in time. Motilal Oswal Research may or may not follow up on stocks under Spotlight.
Jinesh Gandhi
(Jinesh@MotilalOswal.com); 91 22 3982 5416
Chirag Jain
(Chirag.Jain@MotilalOswal.com); +91 22 3982 5418
Investors are advised to refer through disclosures made at the end of the Research Report.
RED: Caution
AMBER: In transition
GREEN: Interesting
1

spotlight
| WABCO India
Expected revival in the MHCV cycle also augurs well, considering its market dominance and 40%
revenue contribution from OEMs.
The content per vehicle in India is one of the lowest in the world (less than USD300/vehicle
v/s USD3,000/vehicle in Western Europe and USD1,000/vehicle in North America). There is a
significant opportunity to fill the big technology gap between MHCVs from India and other
developed countries, which may slightly bridge the gap in content per vehicle.
We expect 20.6% CAGR in domestic revenues over FY14-17.
Emerging as export hub for parent, given frugal engineering and cost effective structure
Wabco Holdings is increasing the share of sourcing from low cost countries (41% in CY13 v/s
36% in CY07), with an eye on cost rationalization and diversification of sourcing.
It has identified India for its frugal engineering capabilities and cost effective cost structure.
This gives us comfort on strong and steady growth in exports.
Over FY11-14, WIL's export revenues have grown 3.5x to INR4.1b, contributing 39% of
revenues.
Strong export potential lends an additional revenue growth opportunity. Moreover, it also
aids in early localization of technologies awaiting implementation in India.
We expect WIL's exports (~39% of FY14 revenues) to register a CAGR of 20% over FY14-17.
Dominant player in technology intensive braking systems
WIL enjoys the benefits of its global parent's strong technology dominance among OEMs
globally.
High technological barriers to entry, and long gestation involved in building OEM relationships
and network, supported by its long experience and large scale have given WIL market
dominance.
This lends strong pricing power, resulting in stable margins across cycles (average EBITDA
margin of 17.9% over FY10-14), healthy return ratios, robust cash flows, and strong balance
sheet.
Globally, Wabco Holdings faces competition from Knorr, Haldex and a few smaller competitors.
Yet, it has managed to establish strong tie-ups with Daimler and Volvo. In India, WIL enjoys
near monopoly, with Knorr-Bremse being the distant 2nd largest player.
Premium valuations to sustain on attractive growth, strong competitive positioning
We expect revenue CAGR of 30.3% over FY14-17, driven by MHCV demand recovery, mandatory
implementation of ABS effective October 2015, and increasing content per vehicle as the
Indian CV industry evolves with the entry of global majors like Diamler and Volvo.
Increase in capacity utilization and demand recovery in high margin OEM business should
drive 340bp EBITDA margin expansion to 18.4% by FY17.
We estimate 41.9% PAT CAGR over FY14-17, reflecting strong EBITDA growth. Return ratios
would remain strong, with average RoCE of 30% and robust FCF of INR3b over FY14-17.
Key risks include delay in adoption of ABS and increase in royalty by parent.
20 June 2014
2

spotlight |WABCO
India
Mandatory ABS adoption for wider MHCV categories a
key trigger
MHCV upcycle, increasing content per vehicle additional growth drivers
"ABS is obviously the major
contributor to safety on the
road for commercial
vehicles. It has been proven
that way in different areas
of the world so far. In India,
it is taking shape.”
Mr Jacques Esculier,
Chairman and CEO, Wabco
Holdings Inc.
The government has issued final notification on adoption of ABS for wider categories
of MHCVs (above 12T for goods, above 5T for buses), effective October 2015.
ABS penetration for MHCVs in India is less than 10%, according to industry estimates.
The government made fitment of ABS mandatory for CVs carrying hazardous goods in
October 2006 and for tractor-trailers and buses with national permits in October 2007.
With 85% share in OEM MHCV braking systems, WIL would be a key beneficiary of
mandatory adoption of ABS, as the content per vehicle would increase by over 50%.
Moreover, with the entry of global majors like Daimler and Volvo, competition
amongst CV OEMs is intensifying, resulting in an accelerated phase of standardization
of technology, safety and reliability. This would further drive content per vehicle in
India (currently one of the lowest in the world at less than USD300/vehicle).
…on mandatory implementation, driving higher penetration
ABS Penetration (%)
80
ABS to register strong growth in FY16/17…
ABS (INR m)
Growth (%)
413.6
152.0
(22.7)
421
FY12
(9.4)
382
FY13
38.1
527
FY14
0.6
530
FY15E
2,724
FY16E
6,863
FY17E
FY14
FY15E
10
10
40
FY16E
FY17E
Source: Company, MOSL
Anti-lock braking systems (ABS) help maintain control and directional stability of an
automobile in case of extreme braking circumstances. Its usage prevents locking of a
vehicle’s wheels following excessive actuation of the service braking system. It
prevents wheel locking during sudden braking to ensure steerability and stability
(prevents skidding).
“The entry of new players
has accelerated the phase of
standardization of
technology, safety, and
reliability. While foreign
players are eyeing the local
market, Indian players
looking to become globally
competitive.”
. Mr Jacques Esculier,
Chairman and CEO, Wabco
Holdings Inc
Higher competition amongst OEMs to drive content per vehicle
Content per vehicle one of the lowest globally:
The content per vehicle in India
is one of the lowest in the world, given the prevalence of relatively low priced
CVs and lack of awareness about safety. The estimated ABS content is less than
USD300/vehicle, much lower than USD3,000/vehicle in Western Europe and
USD1,000/vehicle in North America. Even in Eastern Europe, the content per
vehicle is USD500. There is a significant opportunity to fill the big technology
gap between MHCVs from India and other developed countries, which may
slightly bridge the gap in content per vehicle.
New product offerings:
WIL is a technology-driven product company. It has
been consistently introducing new value-added products, helping it to grow its
market share. In May 2014, WIL introduced automated manual transmission
3
20 June 2014

spotlight |WABCO
India
“Commercial vehicles
produced in emerging
markets currently adopt
only one tenth to one fifth
of the technology that we
typically apply on heavy
duty vehicles in Europe. Our
market is USD3,000 of
product and systems in
Europe. It goes down to just
a few hundred dollars in
India. So that gives you the
room to progressively bring
those technologies to
India.” – Mr Jacques
Esculier, Chairman and CEO,
Wabco Holdings Inc.
(AMT OptiDrive). This equipment automates clutch and gear shifting to optimal
conditions, improving fuel efficiency by up to 8% through improved driving
conditions. Considering the shortage of seasoned drivers, AMT would help
reduce the abuse of mechanical systems, resulting in lower maintenance cost.
MNC OEMs driving usage of safety measures, newer technologies:
MNC OEMs
like Volvo and Daimler are likely to be the early adopters of new technologies or
in bringing higher safety measures for Indian markets, as is the case in
developed markets. Similarly, Indian players are looking to become globally
competitive and are working/already offering latest and differentiated products.
We expect this trend to help increase product penetration for WIL.
Snapshots of new products, where WIL enjoys deep technology moat
Most products that can be introduced in India would be related to safety and fuel
efficiency. Higher competitive pressures and the need to differentiate amongst
OEMs would drive higher acceptance of the following products, thereby driving
content per vehicle:
AMT OptiDrive:
By optimizing the gear shifting process, OptiDrive improves
vehicle control and enhances comfort. It also significantly contributes to lower
average fuel consumption by shifting at the most effective speed, a major cost
saving over the vehicle’s lifetime.
Lift axle control valve:
It is used for lifting and lowering the axle depending
upon the vehicle’s load condition. It operates through the pneumatic load
sensed by the load detection valve. It automatically lowers the axle during
ignition ‘off’ condition to prevent theft of the wheels. The driver can also
manually override the function to lift the axle.
Clutch servo:
It enables the driver to disengage and engage the clutch with
minimum clutch pedal effort. It is a pneumatically assisted hydraulic clutch
actuating device. It also features a mechanical wear indicator, which shows the
wear of the clutch. Clutch servo is self-adjusted to accommodate clutch wear
and perform even under extreme temperature conditions.
20 June 2014
4

spotlight |WABCO
India
85% share in air brakes; to be a major beneficiary of CV
up-cycle
Signs of bottoming out visible; past MHCV cycle suggests 23% volume CAGR
Freight rates have increased 5-6% in CY14-YTD, the sharpest in two years. Our industry
interactions indicate that MHCV demand is bottoming out and sales should be higher
in FY15.
During the last two major CV cycles, MHCV volumes clocked a CAGR of ~23% from the
bottom of the cycle to the top. Interestingly, even after assuming 20% CAGR in MHCV
volumes on the base of FY14, FY17 volumes would be marginally lower than FY12
levels.
With ~85% market share in OEM CV braking systems, revival in the CV cycle should
translate into higher volumes for WIL. As such, WIL offers a proxy play on the CV cycle
recovery.
Signs of CV cycle bottoming out visible; freight rates improving
Freight rates have increased 5-6% in CY14-YTD, the sharpest in two years. Our
industry interactions indicate that MHCV demand is in the process of bottoming out,
with FY15 sales expected to be higher than FY14. De-growth in MHCV volumes has
been moderating over the past few quarters, as well (in line with bottoming out of
IIP).
IIP appears to have bottomed-out…
IIP Gr. (%)
20.0
15.0
10.0
5.0
0.0
Dom. MHCVs Gr. (%)
60
40
20
0
-20
-40
…driving moderation of decline in MHCVs as well
3m moving MHCV sales growth (%)
20
0
-20
-40
-60
Source: Company, MOSL
Past cycles suggest 23% MHCV volume CAGR from bottom to top
During the last two major CV cycles, MHCV volumes clocked a CAGR of ~23% from
the bottom of the cycle to the top. Interestingly, even after assuming 20% CAGR in
MHCV volumes on the base of FY14, FY17 volumes would be marginally lower than
FY12 levels.
20 June 2014
5

spotlight |WABCO
India
During the last two major cycles, MHCV volumes posted 23% CAGR from the bottom to the
top
Dom. MHCVs ('000 units)
400
300
200
100
0
Volumes went up
by 20.9% CAGR
Volumes went up
by 23.3%. CAGR
Volumes to grow
at 20% CAGR
Source: Company, MOSL
Key beneficiary of MHCV up-cycle, with 85% share in OEM CV braking
systems
With ~85% market share in OEM CV braking systems, revival in the CV cycle should
translate into higher volumes for WIL. As such, WIL offers a proxy play on the CV
cycle recovery as well.
Share of OEM revenues has declined over last two years (%)
Air assist systems
6.2
13.5
15.9
4.2
14.7
14.4
Spares
4.2
21.7
18.4
Exports
ABS
5.0
39.0
16.3
64.3
66.6
55.8
39.7
(16.1)
17.1
MHCV recovery to drive strong growth in revenues
Domestic Revenues (INR m)
22.4
Growth (%)
22.5
(11.2)
FY14
FY15E
FY16E
FY17E
FY11
FY12
FY13
FY14
FY13
Source: Company, MOSL
20 June 2014
6

spotlight |WABCO
India
Emerging as an export hub for parent; aids early localization
Over FY11-14, exports have grown by 3.5x to ~40% of revenues
Outside of the US and
Europe, the only
engineering research center
the company has is in
Chennai, India. The Chennai
research center works very
closely with the research
center in Hannover,
Germany in the
development of products
and systems for all of
Wabco’s plants around the
world.
Wabco Holdings is increasing the share of sourcing from low cost countries (41% in
CY13 v/s 36% in CY07), with an eye on cost rationalization and diversification of
sourcing.
It has identified India for its frugal engineering capabilities and cost effective cost
structure. This gives us comfort on strong and steady growth in exports.
Over FY11-14, WIL’s export revenues have grown 3.5x to INR4.1b, contributing 39% of
revenues.
Strong export potential lends an additional revenue growth opportunity. Moreover, it
also aids in early localization of technologies awaiting implementation in India.
We expect WIL’s exports (~39% of FY14 revenues) to register a CAGR of 20% over
FY14-17.
Wabco India’s role in Wabco Holdings Inc
Engineering
capabilities
Local souring
for global
needs
Cost effective
manufacturing
New capacity drives strong export growth in FY14
Exports (INR m)
105
5,869
4,076
26
1,481
FY12
34
1,988
20
20
20
4,891
Growth (%)
7,043
Wabco raising share of sourcing from best cost countries (%)
41
10
FY13
FY14
FY15E
FY16E
FY17E
CY99
CY13
Source: Company, MOSL
20 June 2014
7

spotlight |WABCO
India
Dominant player in technology intensive braking systems
High technology barriers and long gestation time give dominance
Globally, Wabco Holdings
faces competition from
Knorr, Haldex and a few
smaller competitors. Yet, it
has managed to establish
strong tie-ups with Daimler
and Volvo. In India, WIL
enjoys near monopoly, with
Knorr getting a fifth of Tata
Motors’ business via the
Knorr-Tata Autocomp JV..
WIL enjoys the benefits of its global parent’s strong technology dominance among
OEMs globally.
High technological barriers to entry, and long gestation involved in building OEM
relationships and network, supported by its long experience and large scale have given
WIL market dominance.
This lends strong pricing power, resulting in stable margins across cycles (average
EBITDA margin of 17.9% over FY10-14), healthy return ratios, robust cash flows, and
strong balance sheet.
Globally, Wabco Holdings faces competition from Knorr, Haldex and a few smaller
competitors. Yet, it has managed to establish strong tie-ups with Daimler and Volvo. In
nd
India, WIL enjoys near monopoly, with Knorr being the distant 2 largest player.
Source: Wabco Presentation
Margins to bounce back on higher utilization, OEM revenues
EBITDA (INR m)
20.9
17.8
15.9
15.0
15.6
EBITDA (%)
18.8
19.8
Globally as well, Wabco makes healthy margins
EBITDA (USD m)
16.0
EBITDA Margins (%)
16.2
15.3
13.8
5.0
75
FY11
FY12
FY13
FY14
FY15E
FY16E
FY17E
FY09
301
FY10
448
FY11
401
FY12
417
FY13
Source: Company, MOSL
20 June 2014
8

spotlight |WABCO
India
Expect robust EPS growth, strong return ratios
Premium valuation justified considering growth, competitive positioning
We expect revenue CAGR of 30.3% over FY14-17, driven by MHCV demand recovery,
mandatory implementation of ABS effective October 2015, and increasing content per
vehicle as the Indian CV industry evolves with the entry of global majors like Diamler
and Volvo.
Increase in capacity utilization and demand recovery in high margin OEM business
should drive 340bp EBITDA margin expansion to 18.4% by FY17.
We estimate 41.9% PAT CAGR over FY14-17, reflecting strong EBITDA growth. Return
ratios would remain strong, with average RoCE of 30% and robust FCF of INR3b over
FY14-17.
Key risks include delay in adoption of ABS and increase in royalty by parent.
OEM recovery, mandatory ABS to drive 30.3% revenue CAGR
Net sales (INR m)
Growth (%)
40.1
14.9
21.1
11.3
42.0
Margins to bounce back on higher utilization, OEM revenues
EBITDA (INR m)
20.9
17.8
15.9
15.0
15.6
EBITDA (%)
18.8
19.8
-8.7
FY12
FY13
FY14
FY15E
FY16E
FY17E
FY11
FY12
FY13
FY14
FY15E
FY16E
FY17E
Source: Company, MOSL
Robust PAT growth of 42% FY14-17E
PAT (INR m)
Growth (%)
79.9
42.9
2.5
-26.6
FY12
FY13
FY14
FY15E
FY16E
FY17E
4.1
52.7
CFO to remain strong at INR4.9b FY17E
CFO
Capex
FCF
FY12
FY13
FY14
FY15E
FY16E
FY17E
Source: Company, MOSL
20 June 2014
9

spotlight |WABCO
India
Healthy net debt position
Net debt (INR m)
FY12
-1,033
FY13
-1,246
-2,056
-2,993
-4,063
-5,820
FY14
FY15E
FY16E
FY17E
Robust return ratios with avg. CAGR of 30% FY14-17E (%)
RoCE
38.3
32.0
24.5
23.1
14.0
23.0
16.7
21.3
15.1
22.7
RoE
38.4
27.1
FY12
FY13
FY14
FY15E
FY16E
FY17E
Source: Company, MOSL
Wabco India P/E multiple
50
40
30
20
10
0
P/E (x)
5 Yrs Avg(x)
39.6
Source: Company, MOSL
20 June 2014
10

spotlight |WABCO
India
Risk & concerns
Continued slowdown in domestic demand from OEMs:
WIL has continued to
outperform in terms of revenues even as the overall MHCV industry has been under
severe stress. However, continued weakness in OEMs impacts WIL’s revenues, given
its high dependence. However, its superior product offerings coupled with
regulatory requirement would help it to weather the slowdown.
Upward revision of royalty rates could impact margins:
A number of MNCs (like
Unilever, Holcim) have gradually raised their royalty rates. A similar move by Wabco
Holdings is possible. Currently, royalty payment stands at 1% of domestic sales. An
increase in royalty rates could impact WIL’s margins, if it is unable to pass on the
increase. However, given the strong bargaining power WIL enjoys, this does not
appear to be a major problem.
Delay in ABS implementation:
Another risk to our estimates would be delay in
implementation of ABS in India. India is already behind on international safety
norms. As such, we do not envisage any major delays. Nevertheless, any delays
would impact our FY16/17 earnings estimates for WIL.
20 June 2014
11

spotlight |WABCO
India
About Wabco Holdings Inc
Wabco Holdings Inc is a leading global supplier of technologies and control systems
for the safety and efficiency of commercial vehicles. Founded over 140 years ago,
Wabco Holdings continues to pioneer breakthrough mechanical, mechatronic and
electronic technologies for braking, stability and transmission automation systems
supplied to the world’s leading commercial truck, bus and trailer manufacturers.
With USD2.8b in sales in CY13, ~10,000 employees in 31 countries and 20
manufacturing locations in four continents, Wabco Holdings is a formidable
technology player, with products and systems catering to top OEMs like CNHTC,
Daimler, Volvo, Scania, etc, in the truck segment, and Audi, BMW, GM, Chrysler, etc,
in the car segment.
Geography wise sales mix (CY13)
3%
7%
11%
18%
Europe
Asia
North America
61%
South America
Other
25%
62%
Trailer
Products
Car Products
9%
Major end market sales mix (CY13)
4%
Truck and Bus
products
Aftermarket
Source: Company, MOSL
WABCO: Key product groups
Acutator
Air Compressor and Air Processing
/Air Management System
Foundation Brake
Anti-Lock Braking System
Conventional Braking System
Electronic Braking Systems
Electronic and Conventional Air
Suspension Systems
Transmission Automation
Vehicle Electronic Architecture
Vehicle Electronic Stability Control
and Roll Stability Support
Converts energy stored in compressed air into mechanical force
applied to foundation brake to slow or stop commercial vehicle
Provides compressed dried air for braking, suspension and
other pneumatic systems on trucks, buses and trailers
Trasmits braking force to a disc or drum to slow,
stop or hold vehicle
Prevents wheel locking during braking to ensure steerability and
stabilty
Mechanical and pneumatic devices for control of braking systems in
commercial vehicles
Electronic Control of braking systems for commercial vehicles
Level control of Air springs in Trucks,Buses, Trailers and Cars
Automates Transmission gear shifting for Trucks and Buses
Central electronic modules integrating multiple vehicle control
functions
Enhances driving stability
Source: Company, MOSL
20 June 2014
12

spotlight |WABCO
India
Financials and valuations
Income statement
Y/E March
Net Sales
Change (%)
EBITDA
EBITDA Margin (%)
Depreciation
EBIT
Interest
Other Income
Extraordinary items
PBT
Tax
Tax Rate (%)
Reported PAT
Adjusted PAT
Change (%)
2012
10,456
17.2
2,199
21.0
156
2,043
1
121
-19
2,182
628
28.8
1,553
1,528
20.3
2013
9,659
-7.6
1,941
20.1
217
1,723
0
126
0
1,850
542
29.3
1,308
1,308
-14.4
2014
11,107
15.0
1,662
15.0
322
1,340
1
272
0
1,611
436
27.1
1,175
1,175
-10.2
2015E
12,363
11.3
1,925
15.6
499
1,426
0
303
0
1,729
506
29.3
1,223
1,223
4.1
(INR Million)
2016E
17,323
40.1
3,252
18.8
506
2,746
0
364
0
3,110
911
29.3
2,199
2,199
79.9
2017E
24,593
42.0
4,863
19.8
568
4,294
0
455
0
4,749
1,391
29.3
3,359
3,359
52.7
Balance sheet
Y/E March
Share Capital
Reserves
Net Worth
Debt
Deferred Tax
Total Capital Employed
Gross Fixed Assets
Less: Acc Depreciation
Net Fixed Assets
Capital WIP
Investments
Current Assets
Inventory
Debtors
Cash & Bank
Loans & Adv, Others
Curr Liabs & Provns
Curr. Liabilities
Provisions
Net Current Assets
Total Assets
2012
95
5,196
5,291
9
179
5,479
3,440
1,138
2,302
128
232
4,116
1,158
1,575
810
574
1,369
1,106
263
2,747
5,479
2013
95
6,393
6,488
0
117
6,605
3,982
1,347
2,635
254
255
4,788
1,356
1,898
991
542
1,326
1,055
271
3,461
6,605
2014
95
7,457
7,552
0
161
7,713
4,691
1,668
3,023
153
502
5,800
1,124
2,315
1,554
807
1,765
1,470
294
4,036
7,713
2015E
95
8,569
8,664
0
161
8,825
5,291
2,167
3,124
124
502
7,215
1,249
2,577
2,491
898
2,140
1,634
506
5,075
8,825
(INR Million)
2016E
2017E
95
95
10,657
13,905
10,752
13,999
0
0
161
161
10,913
14,161
5,951
6,677
2,673
3,241
3,278
3,436
139
123
502
502
10,128
14,619
1,698
2,389
3,610
5,125
3,561
5,318
1,259
1,787
3,134
4,519
2,223
3,128
911
1,391
6,994
10,100
10,913
14,161
E: MOSL Estimates
20 June 2014
13

spotlight |WABCO
India
Financials and valuations
Ratios
Y/E March
Basic (INR)
EPS
Cash EPS
Book Value
DPS
Payout (incl. Div. Tax.)
Valuation(x)
P/E
Cash P/E
Price / Book Value
EV/Sales
EV/EBITDA
Dividend Yield (%)
Profitability Ratios (%)
RoE
RoCE
Turnover Ratios (%)
Asset Turnover (x)
Debtors (No. of Days)
Inventory (No. of Days)
Creditors (No. of Days)
Leverage Ratios (%)
Net Debt/Equity (x)
2012
80.6
88.9
279.1
5.0
7.3
2013
69.0
80.4
342.2
5.0
8.5
2014
62.0
78.9
398.3
5.0
9.4
49.6
39.0
7.7
5.1
34.2
0.2
33.4
47.2
1.9
0.0
40.4
47.7
0.0
22.2
31.4
1.5
0.0
51.2
48.5
0.0
16.7
23.0
1.4
0.0
37.0
54.9
0.0
2015E
64.5
90.8
456.9
5.0
9.1
47.7
33.9
6.7
4.5
29.0
0.2
15.1
21.3
1.4
0.0
36.9
55.2
0.0
2016E
116.0
142.7
567.1
5.0
5.0
26.5
21.6
5.4
3.2
16.8
0.2
22.7
32.0
1.6
0.0
35.8
55.6
0.0
2017E
177.1
207.1
738.4
5.0
3.3
17.4
14.9
4.2
2.2
10.9
0.2
27.1
38.4
1.7
0.0
35.5
55.8
0.0
Cash flow statement
Y/E March
NP/(Loss) bef. Tax and EO Items
Depreciation
Interest & Finance Charges
Direct Taxes Paid
(Inc)/Dec in WC
CF from Operations
Others
CF from Operating incl EO
(inc)/dec in FA
(Pur)/Sale of Investments
Others
CF from Investments
Interest Paid
Dividend Paid
Others
CF from Fin. Activity
Inc/Dec of Cash
Add: Beginning Balance
Closing Balance
2012
2,162
156
-22
-644
-63
1,590
-36
1,554
-683
-96
23
-755
-1
-110
0
-111
687
123
810
2013
1,850
217
-72
-499
-582
914
-12
902
-677
-5
72
-610
0
-110
0
-110
181
810
991
2014
1,611
322
-271
-436
-12
1,214
0
1,214
-608
248
272
-88
-1
-111
-451
-563
562
991
1,554
2015E
1,729
499
-303
-506
-102
1,317
0
1,317
-571
0
303
-268
0
-111
0
-111
937
1,554
2,491
(INR Million)
2016E
2017E
3,110
4,749
506
568
-364
-455
-911
-1,391
-849
-1,349
1,492
2,123
0
0
1,492
2,123
-675
-710
0
0
364
455
-311
-255
0
0
-111
-111
0
0
-111
-111
1,070
1,757
2,491
3,561
3,561
5,318
E: MOSL Estimates
20 June 2014
14

spotlight |WABCO
India
NOTES
20 June 2014
15

Disclosures
This report is for personal information of the authorized recipient and does not construe to be any investment, legal or taxation advice to you. This research report does not constitute an offer, invitation or
inducement to invest in securities or other investments and Motilal Oswal Securities Limited (hereinafter referred as MOSt) is not soliciting any action based upon it. This report is not for public distribution
and has been furnished to you solely for your information and should not be reproduced or redistributed to any other person in any form.
Unauthorized disclosure, use, dissemination or copying (either whole or partial) of this information, is prohibited. The person accessing this information specifically agrees to exempt MOSt or any of its
affiliates or employees from, any and all responsibility/liability arising from such misuse and agrees not to hold MOSt or any of its affiliates or employees responsible for any such misuse and further agrees
to hold MOSt or any of its affiliates or employees free and harmless from all losses, costs, damages, expenses that may be suffered by the person accessing this information due to any errors and delays.
The information contained herein is based on publicly available data or other sources believed to be reliable. While we would endeavour to update the information herein on reasonable basis, MOSt and/or
its affiliates are under no obligation to update the information. Also there may be regulatory, compliance, or other reasons that may prevent MOSt and/or its affiliates from doing so. MOSt or any of its
affiliates or employees shall not be in any way responsible and liable for any loss or damage that may arise to any person from any inadvertent error in the information contained in this report. MOSt or any
of its affiliates or employees do not provide, at any time, any express or implied warranty of any kind, regarding any matter pertaining to this report, including without limitation the implied warranties of
merchantability, fitness for a particular purpose, and non-infringement. The recipients of this report should rely on their own investigations.
spotlight |WABCO
India
This report is intended for distribution to institutional investors. Recipients who are not institutional investors should seek advice of their independent financial advisor prior to taking any investment decision
based on this report or for any necessary explanation of its contents.
MOSt and/or its affiliates and/or employees may have interests/positions, financial or otherwise in the securities mentioned in this report. To enhance transparency, MOSt has incorporated a Disclosure of
Interest Statement in this document. This should, however, not be treated as endorsement of the views expressed in the report.
Disclosure of Interest Statement
1. Analyst ownership of the stock
2. Group/Directors ownership of the stock
3. Broking relationship with company covered
4. Investment Banking relationship with company covered
WABCO INDIA LTD
No
No
No
No
Analyst Certification
The views expressed in this research report accurately reflect the personal views of the analyst(s) about the subject securities or issues, and no part of the compensation of the research analyst(s) was, is,
or will be directly or indirectly related to the specific recommendations and views expressed by research analyst(s) in this report. The research analysts, strategists, or research associates principally
responsible for preparation of MOSt research receive compensation based upon various factors, including quality of research, investor client feedback, stock picking, competitive factors and firm revenues.
This report is not directed or intended for distribution to or use by any person or entity resident in a state, country or any jurisdiction, where such distribution, publication, availability or use would be contrary
to law, regulation or which would subject MOSt & its group companies to registration or licensing requirements within such jurisdictions.
Regional Disclosures (outside India)
This report is intended for distribution only to persons having professional experience in matters relating to investments as described in Article 19 of the Financial Services and Markets Act 2000 (Financial
Promotion) Order 2005 (referred to as "investment professionals"). This document must not be acted on or relied on by persons who are not investment professionals. Any investment or investment activity
to which this document relates is only available to investment professionals and will be engaged in only with such persons.
For U.K.
Motilal Oswal Securities Limited (MOSL) is not a registered broker - dealer under the U.S. Securities Exchange Act of 1934, as amended (the"1934 act") and under applicable state laws in the United
States. In addition MOSL is not a registered investment adviser under the U.S. Investment Advisers Act of 1940, as amended (the "Advisers Act" and together with the 1934 Act, the "Acts), and under
applicable state laws in the United States. Accordingly, in the absence of specific exemption under the Acts, any brokerage and investment services provided by MOSL, including the products and services
described herein are not available to or intended for U.S. persons.
This report is intended for distribution only to "Major Institutional Investors" as defined by Rule 15a-6(b)(4) of the Exchange Act and interpretations thereof by SEC (henceforth referred to as "major
institutional investors"). This document must not be acted on or relied on by persons who are not major institutional investors. Any investment or investment activity to which this document relates is only
available to major institutional investors and will be engaged in only with major institutional investors. In reliance on the exemption from registration provided by Rule 15a-6 of the U.S. Securities Exchange
Act of 1934, as amended (the "Exchange Act") and interpretations thereof by the U.S. Securities and Exchange Commission ("SEC") in order to conduct business with Institutional Investors based in the
U.S., MOSL has entered into a chaperoning agreement with a U.S. registered broker-dealer, Motilal Oswal Securities International Private Limited. ("MOSIPL"). Any business interaction pursuant to this
report will have to be executed within the provisions of this chaperoning agreement.
The Research Analysts contributing to the report may not be registered /qualified as research analyst with FINRA. Such research analyst may not be associated persons of the U.S. registered broker-
dealer, MOSIPL, and therefore, may not be subject to NASD rule 2711 and NYSE Rule 472 restrictions on communication with a subject company, public appearances and trading securities held by a
research analyst account.
For U.S.
Motilal Oswal Capital Markets Singapore Pte Limited is acting as an exempt financial advisor under section 23(1)(f) of the Financial Advisers Act(FAA) read with regulation 17(1)(d) of the Financial
Advisors Regulations and is a subsidiary of Motilal Oswal Securities Limited in India. This research is distributed in Singapore by Motilal Oswal Capital Markets Singapore Pte Limited and it is only directed
in Singapore to accredited investors, as defined in the Financial Advisers Regulations and the Securities and Futures Act (Chapter 289), as amended from time to time.
In respect of any matter arising from or in connection with the research you could contact the following representatives of Motilal Oswal Capital Markets Singapore Pte Limited:
Anosh Koppikar
Kadambari Balachandran
Email:anosh.Koppikar@motilaloswal.com
Email : kadambari.balachandran@motilaloswal.com
Contact(+65)68189232
Contact: (+65) 68189233 / 65249115
Office Address:21 (Suite 31),16 Collyer Quay,Singapore 04931
For Singapore
Motilal Oswal Securities Ltd
20 June 2014
Motilal Oswal Tower, Level 9, Sayani Road, Prabhadevi, Mumbai 400 025
Phone: +91 22 3982 5500 E-mail: reports@motilaloswal.com
16