21 July 2014
1QFY15 Results Update | Sector:
Real Estate
Oberoi Realty
BSE SENSEX
25,642
Bloomberg
Equity Shares (m)
M.Cap. (INR b) / (USD b)
52-Week Range (INR)
1, 6, 12 Rel. Per (%)
S&P CNX
7,664
OBER IN
328.2
78.8/1.3
276/154
-8/-7/-6
CMP: INR240
TP: INR297
Buy
Financials & Valuation (INR m)
Y/E Mar
Net Sales
EBITDA
Adj PAT
EPS (INR)
Gr. (%)
RoE (%)
RoCE (%)
P/E (x)
P/BV (X)
2015E 2016E 2017E
11,584 19,388 28,610
6,297 11,071 16,687
3,979
12.1
27.9
8.7
11.4
19.8
1.7
6,962 10,969
21.2
75.0
162.6
13.8
17.8
11.3
1.5
33.4
57.6
192.5
18.8
24.7
7.2
1.2
BV/Sh. INR 143.7
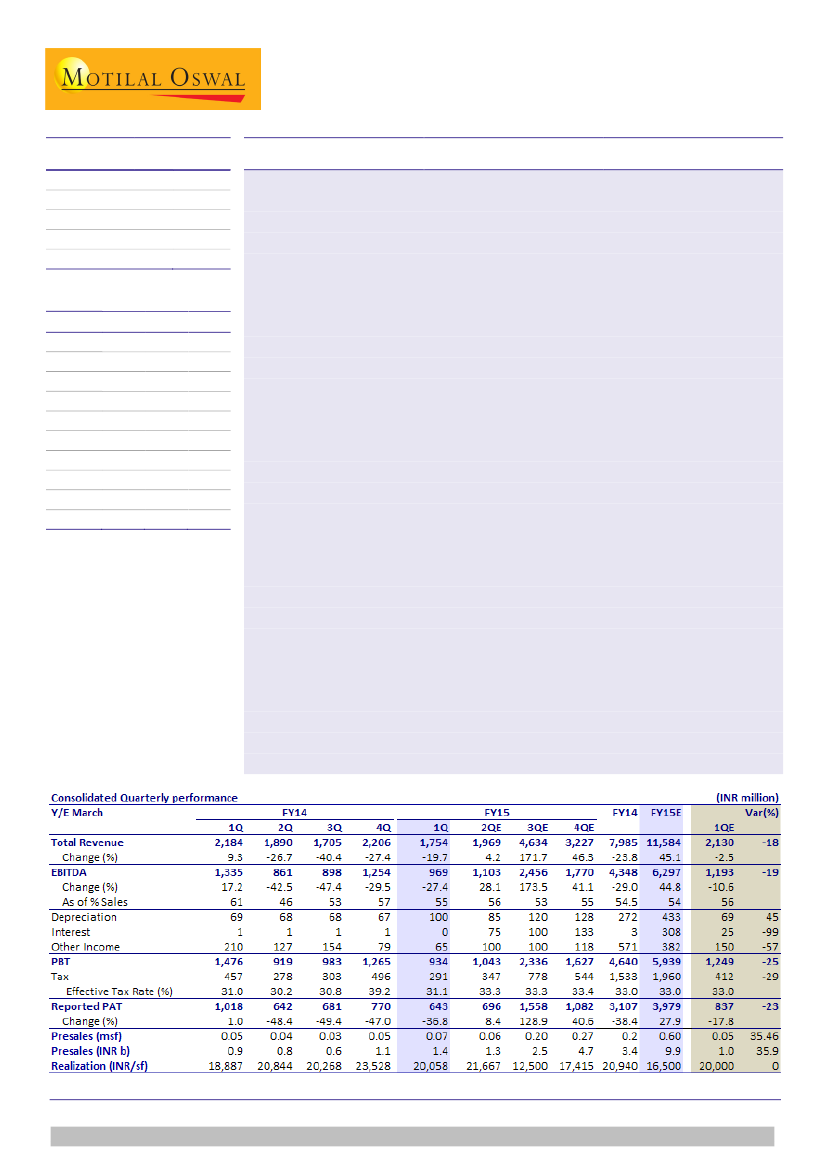
Revenue below estimates, margin in line:
Oberoi Realty (OBER)’s 1QFY15 revenue
de-grew 19.7% YoY (-20% QoQ) to INR1.8b (v/s est. of INR2.1b). EBITDA de-grew
27% YoY (-23% QoQ) to INR0.97b (v/s est of INR1.2b), translating into margin of
55% (-2pp QoQ). Residential revenue was entirely contributed by Exquisite. Lower
revenue trickled down to PAT, which de-grew 37% YoY to INR643m, led by higher
depreciation (impact of schedule 11 of companies act) and lower other income.
Seasonally weaker hotel operations dent annuity business:
Annuity revenue was
down 3% QoQ (grew 6% YoY) on account of seasonally weaker contribution from
hotel operations (-10% QoQ). QoQ weakness in margin was also attributable to ~
INR40mof prior period property tax provision in hotel operations, which dent its
margin to 13% in 1QFY15 (v/s 33.4% in 4QFY14 and 30.8% in 1QFY14).
Presales improve QoQ:
Presales was at 0.07msf (INR1.4b) v/s 0.05msf (INR1.1b) in
4Q and est of INR1b. Blended realization declined QoQ 15% (+6% YoY) to
INR20,058/sf. Entire presales was accounted by Exquisite and Esquire.
Collections up QoQ, Payment on Borivali land led net FCFE –ve of INR10.8b:
Broadly, we calculate, inflow of INR1.9b in 1QFY15 including (a) INR1.4b
collections (v/s INR1b in 4QFY14), and (b) INR0.4b rentals EBITDA. These were
largely spent in ~INR2b in ongoing constructions/capex, (b) INR10.2b of balance
payment to Borivali deal, and (c) tax & admin of INR0.4b. Consequently net FCFE is
–ve at INR10.8, leading to net debt of INR6b (net DER of 0.13x) on B/S (v/s net
cash of INR4.7b in 4QFY14).
Operations near bottom, overhangs diluted, maintain Buy:
Key overhangs viz.
Mulund MoEF, Worli hotel operator, JVLR project conversion approval, and new
land acquisition (at Borivali) etc was addressed to a meaningful extent. It should
pave the way for a new monetization cycle and better cash flows 2HFY15 onwards.
Seamless execution over last 2 years should benefit its cash flow with ready assets
once demand turns favorable in Mumbai. It trades at 11.3x FY16E EPS, 1.5x FY16E
BV.
Buy
with a target price of INR297. Await further clarity in concall scheduled at
4 PM July 21, 2014. DIAL IN +91 22 3960 0645/+91 22 6746 5845.
Sandipan Pal
(Sandipan.Pal@MotilalOswal.com); +91 22 3982 5436
Investors are advised to refer through disclosures made at the end of the Research Report.

Oberoi Realty
Revenue below est.; margin in line; hotel profitability dip on property tax
Revenue de-grew 19.7% YoY (-20% QoQ) to INR1.8b (v/s est. of INR2.1b).
EBITDA de-grew 27% YoY (-23% QoQ) to INR0.97b (v/s est of INR1.2b),
translating into margin of 55% (in line, -2pp QoQ).
Residential revenue was entirely contributed by Exquisite, while annuity
revenue was down 3% QoQ (grew 6% YoY) on account of seasonally weaker
contribution from hotel operations (-10% QoQ).
QoQ weakness in margin was also attributable to ~INR40mof prior period
property tax provision in hotel operations, which dent its margin to 13% in
1QFY15 (v/s 33.4% in 4QFY14 and 30.8% in 1QFY14).
Lower revenue trickled down to PAT, which de-grew 37% YoY to INR643m,
impacted by higher depreciation (owing to impact of schedule 11 of new
companies act) and lower other income.
Presales improve QoQ and beats estimates
New launches are yet to take place and slowdown in broader market continues
to impact overall presales, albeit 1QFY15 performance improves QoQ.
Presales was at 0.07msf (INR1.4b) v/s 0.05msf (INR1.1b) in 4Q and est. of INR1b.
Blended realization declined QoQ 15% (+6% YoY) to INR20,058/sf. Entire
presales was accounted by Exquisite and Esquire.
We estimates (a) presales of 0.6msf (INR 9.9b) in FY15 with assumption of
launch of Mulund and Oasis (Worli) in 2HFY15, and (b) annuity revenue of
INR2.6b/INR3.5b on the back of gradual leasing in Commerz II.
Customer collections up QoQ (INR m)
Sales value (INR b)
Pre-sales improves in 1QFY15
2.8
1.8
2.1
Sales volume (msf)
2.2
2.2
2.2
1.1
0.6
1.4
0.9
0.8
Source: Company, MOSL
Collections up QoQ, Payment on Borivali land led net FCFE –ve of INR10.8b
Broadly, we calculate, inflow of INR1.9b in 1QFY15 including (a) INR1.4b
collections (v/s INR1b in 4QFY14), and (b) INR0.4b rentals EBITDA.
These were largely spent in ~INR2b in ongoing constructions/capex, (b)
INR10.2b of balance payment to Borivali deal, and (c) tax & admin of INR0.4b.
Consequently net FCFE is –ve at INR10.8, leading to net debt of INR6b (net DER
of 0.13x) on B/S (v/s net cash of INR4.7b in 4QFY14).
21 July 2014
2

Oberoi Realty
Trend in Annuity income (INR m)
Asset wise break up of annuity income (INR m)
Oberoi Mall (INR m)
Commerz (INR m)
Westin (INR m)
Source: Company, MOSL
Pro-forma calculation of 1QFY15 (INR b)
Particulars
(+) Collections
(+) Rental EBITDA
(+) Other income
(+) Worli advances
Inflow
(-) Constructions
(-) Fungible FSI/land/others etc
(-) Capex
(-) Tax
(-) Admin expense
(-) Borivali land (10% + bid deposits)
(-) Dividend
Outflow
Net cash flow
12.64
-10.78
1.86
1.75
0.14
0.08
0.29
0.18
10.20
1QFY15
1.41
0.38
0.07
Source: Company, MOSL
FY14
3.5
1.7
0.6
2.3
8.1
7.9
1.26
0.55
1.46
0.7
1.36
0.8
14.00
-5.99
Core operations bottoming out; new launches, re-leveraging and cash
deployment should to restore high RoCE; maintain Buy
Key overhangs viz. Mulund MoEF, Worli hotel operator, JVLR project conversion
approval, and new land acquisition (at Borivali) etc was addressed to a
meaningful extent.
It should pave the way for start of a new monetization cycle. Improving macro
sentiment and new launches should drive presales and cash flow 2HFY15
onwards. Seamless execution (despite weak presales or leasing) over last 2 years
should benefit its cash flow hereon as demand turns favorable with ready
assets.
The stock trades at 11.3x FY16E EPS, 1.5x FY16E BV. Buy with target price of
INR297.
21 July 2014
3

Oberoi Realty
Story in charts
Commerz II leasing key levers to growth in rentals (INR b)
3.5
2.5
2.7
8.9
6.5
9.1
9.6
8.7
3.8
FY09
FY10
FY11
FY12
FY13
FY14
FY15E FY16E
FY11
FY12
FY13
FY14
FY15E
FY16E
7.8
3.5
New operating cycle to trigger growth in presales and CF
Presales (INR b)
Collections (INR b)
16.0
9.9
7.0
13.0
1.8
0.7
0.8
2.1
2.2
Source: Company, MOSL
Re-leveraging of B/S on land buying (INR b) Trend in net debt Re-leveraging and new launch to improve return ratios (%)
5.0
RoE
3.0
27.6
-2.3
-2.9
-1.7
19.0
-4.4
-14.6
-12.9
-10.7
-4.8
23.3
15.9
28.9
19.1
27.7
18.9
23.6
17.1 17.3
19.9
13.1
12.8
7.3
10.7 12.2
13.8
8.7
18.3
RoCE
Source: Company, MOSL
Estimate FY16 NAV at INR297
Particulars
Residential
(+) Commercial (Lease)
(+) Commercial (Sale)
(+) Retail (Lease)
(+) Retail (Sale)
(+) Hotels
Gross Asset Value
(+) Cash
(-) Other Op Exp
(-) Tax
Net Asset Value
(+) Borivali land NAV
NAV
(Rs m)
72,023
24,265
13,948
9,438
2,767
6,439
128,880
5,078
11,599
32,220
90,139
7,270
97,409
NAV/share
219
74
42
29
8
20
393
15
35
98
275
22
297
% GAV
56
19
11
7
2
5
100
4
9
25
70
76
Source: Company, MOSL
21 July 2014
4

Oberoi Realty
Oberoi Realty: an investment profile
Company description
Oberoi Realty Limited is a Mumbai-based real estate
developer. It was incorporated in May 1998 as Kingston
Properties Private Ltd. ORL's primary focus is to develop
residential property but it has diversified into retail,
commercial, hospitality and social infrastructure
projects. ORL has undertaken ~5msf of RE development
across 35 projects so far.
Recent developments
Acquisition of new land parcel at Borivali
(Mumbai) for INR11.55b.
Tied up with Ritz Carton as hotel operator in
Worli.
Valuation and view
Key investment arguments
ORL has a strong brand in Mumbai's RE market due
to its (1) diversified products, (2) superior product
quality and (3) management goodwill, which enable
it to command a pricing premium over peers.
ORL is expected to successfully monetize its land
bank over 8-10 years as its healthy cash position
and hassle-free land imply certainty of execution.
This provides high cash flow visibility.
ORL enjoys steady cash flow from its annuity assets,
which insulates it from vagaries of the RE cycle.
Key overhangs viz. Mulund MoEF, Worli hotel
operator, JVLR project conversion approval, and
new land acquisition (at Barivali) etc was
addressed to a meaningful extent.
It should pave the way for start of a new
monetization cycle. Improving macro sentiment
and new launches should drive presales and cash
flow 2HFY15 onwards. Seamless execution
(despite weak presales or leasing) over last 2
years should benefit its cash flow hereon as
demand turns favorable with ready assets.
The stock trades at 11.3x FY16E EPS, 1.5x FY16E
BV. Buy with target price of INR297.
Key investment risks
Delayed recovery in Mumbai market.
Approval hurdles.
Comparative valuations
P/E (x)
P/BV (x)
EV/Sales (x)
EV/EBITDA (x)
FY15E
FY16E
FY15E
FY16E
FY15E
FY16E
FY15E
FY16E
Oberoi
18.1
11.3
1.7
1.5
6.9
4.4
12.5
7.7
Sobha
18.2
14.1
2.1
2.0
2.8
2.6
10.1
9.4
Prestige
21.1
14.7
2.5
2.2
3.6
3.0
12.5
9.5
EPS: MOSL forecast v/s consensus (INR)
MOSL
Forecast
FY15
FY16
12.1
21.2
Consensus
Forecast
11.0
16.4
Variation
(%)
9.6
29.5
Target price and recommendation
Current
Price (INR)
240
Target
Price (INR)
297
Upside
(%)
23.8
Reco.
Buy
Shareholding pattern (%)
Mar-14
Promoter
DII
FII
Others
75.0
0.8
15.9
8.3
Dec-13
75.0
0.2
13.6
11.2
Mar-13
78.5
0.7
10.0
10.8
Stock performance (1-year)
21 July 2014
5

Oberoi Realty
Financials and valuation
Income statement
Y/E March
Net Sales
Change (%)
EBITDA
EBITDA Margin (%)
Depreciation
EBIT
Interest
Other Income
Extraordinary items
PBT
Tax
Tax Rate (%)
Reported PAT
Adjusted PAT
Change (%)
Adj Cons PAT
2014
7,985
-23.8
4,348
54.5
272
4,076
3
571
0
4,644
1,533
33.0
3,111
3,111
-38.4
3,111
2015E
11,584
45.1
6,297
54.4
433
5,865
308
382
0
5,939
1,960
33.0
3,979
3,979
27.9
3,979
(INR Million)
2016E
19,388
67.4
11,071
57.1
547
10,524
438
305
0
10,391
3,429
33.0
6,962
6,962
75.0
6,962
2017E
28,610
47.6
16,687
58.3
602
16,085
405
692
0
16,372
5,403
33.0
10,969
10,969
57.6
10,969
Ratios
Y/E March
Basic (INR)
EPS
Cash EPS
Book Value
DPS
Payout (incl. Div. Tax.)
Valuation(x)
P/E
Cash P/E
Price / Book Value
EV/Sales
EV/EBITDA
Dividend Yield (%)
Profitability Ratios (%)
RoE
RoCE
Turnover Ratios (%)
Asset Turnover (x)
Debtors (No. of Days)
Inventory (No. of Days)
Creditors (No. of Days)
Leverage Ratios (%)
Net Debt/Equity (x)
2014
9.5
10.3
133.9
0.0
24.7
25.3
23.3
1.8
9.3
17.1
0.0
7.3
9.4
0.2
39.4
753.9
917.1
0.0
2015E
12.1
13.4
143.7
0.0
19.3
19.8
17.9
1.7
7.3
13.4
0.0
8.7
11.4
0.2
28.5
774.6
318.2
0.2
2016E
21.2
22.9
162.6
0.0
11.0
11.3
10.5
1.5
4.2
7.4
0.0
13.8
17.8
0.3
17.9
557.8
510.6
0.1
2017E
33.4
35.3
192.5
0.0
10.5
7.2
6.8
1.2
2.7
4.6
0.0
18.8
24.7
0.4
12.7
365.0
525.5
0.1
Balance sheet
Y/E March
Share Capital
Reserves
Net Worth
Debt
Deferred Tax
Total Capital Employed
Gross Fixed Assets
Less: Acc Depreciation
Net Fixed Assets
Capital WIP
Investments
Current Assets
Inventory
Debtors
Cash & Bank
Loans & Adv, Others
Curr Liabs & Provns
Curr. Liabilities
Provisions
Net Current Assets
Total Assets
2014
3,282
40,682
43,964
761
220
44,944
8,290
1,201
7,089
3,906
496
40,806
16,491
862
5,078
18,375
10,007
9,138
869
30,799
44,944
2015E
3,282
43,893
47,175
10,261
220
57,655
10,940
1,634
9,307
1,316
496
49,447
24,584
905
4,780
19,178
5,565
4,609
956
43,882
57,655
(INR Million)
2016E
2017E
3,282
3,282
50,087 59,904
53,369 63,186
7,261
6,250
220
220
60,849 69,656
10,940 10,940
2,181
2,399
8,760
8,542
1,952
3,287
496
242
59,672 73,255
29,629 28,610
950
998
3,811
8,650
25,281 34,997
12,684 18,323
11,633 17,166
1,051
1,157
46,988 54,932
60,849 69,657
E: MOSL Estimates
Cash flow statement
Y/E March
OP/(Loss) before Tax
Depreciation
Others
Interest
Direct Taxes Paid
(Inc)/Dec in Wkg Cap
CF from Op. Activity
(Inc)/Dec in FA & CWIP
(Pur)/Sale of Invt
Others
CF from Inv. Activity
Inc/(Dec) in Net Worth
Inc / (Dec) in Debt
Interest Paid
Divd Paid (incl Tax)
CF from Fin. Activity
Inc/(Dec) in Cash
Add: Opening Balance
Closing Balance
2014
4,644
272
0
3
1,533
8,045
-4,660
-552
-496
0
-1,048
0
761
3
768
-83
-5,791
10,725
4,933
2015E
5,939
433
0
308
1,960
13,381
-8,661
-61
0
0
-61
0
9,500
308
768
8,424
-298
5,078
4,780
(INR Million)
2016E
10,391
547
0
438
3,429
4,075
3,872
-636
0
0
-636
0
-3,000
438
768
-4,206
-969
4,780
3,811
2017E
16,372
602
0
405
5,403
3,105
8,487
-1,335
255
0
-1,080
0
-1,011
405
1,152
-2,568
4,839
3,811
8,649
21 July 2014
6

Oberoi Realty
NOTES
21 July 2014
7

This research report has been prepared by MOSt to provide information about the company(ies) and sector(s), if any, covered in the report and may be distributed by it and/or its affiliated company(ies). This
report is for personal information of the select recipient and does not construe to be any investment, legal or taxation advice to you. This research report does not constitute an offer, invitation or inducement to
invest in securities or other investments and Motilal Oswal Securities Limited (hereinafter referred as MOSt) is not soliciting any action based upon it. This report is not for public distribution and has been
furnished to you solely for your general information and should not be reproduced or redistributed to any other person in any form. This report does not constitute a personal recommendation or take into
account the particular investment objectives, financial situations, or needs of individual clients. Before acting on any advice or recommendation in this material, investors should consider whether it is suitable
for their particular circumstances and, if necessary, seek professional advice. The price and value of the investments referred to in this material and the income from them may go down as well as up, and
investors may realize losses on any investments. Past performance is not a guide for future performance, future returns are not guaranteed and a loss of original capital may occur.
MOSt and its affiliates are a full-service, integrated investment banking, investment management, brokerage and financing group. We and our affiliates have investment banking and other business
relationships with a significant percentage of the companies covered by our Research Department Our research professionals provide important input into our investment banking and other business selection
processes. Investors should assume that MOSt and/or its affiliates are seeking or will seek investment banking or other business from the company or companies that are the subject of this material and that
the research professionals who were involved in preparing this material may participate in the solicitation of such business. The research professionals responsible for the preparation of this document may
interact with trading desk personnel, sales personnel and other parties for the purpose of gathering, applying and interpreting market information. Our research professionals are paid in part based on the
profitability of MOSt which include earnings from investment banking and other business. MOSt generally prohibits its analysts, persons reporting to analysts, and members of their households from
maintaining a financial interest in the securities or derivatives of any companies that the analysts cover. Additionally, MOSt generally prohibits its analysts and persons reporting to analysts from serving as an
officer, director, or advisory board member of any companies that the analysts cover. Our salespeople, traders, and other professionals or affiliates may provide oral or written market commentary or trading
strategies to our clients that reflect opinions that are contrary to the opinions expressed herein, and our proprietary trading and investing businesses may make investment decisions that are inconsistent with
the recommendations expressed herein. In reviewing these materials, you should be aware that any or all o the foregoing, among other things, may give rise to real or potential conflicts of interest . MOSt and
its affiliated company(ies), their directors and employees may; (a) from time to time, have a long or short position in, and buy or sell the securities of the company(ies) mentioned herein or (b) be engaged in
any other transaction involving such securities and earn brokerage or other compensation or act as a market maker in the financial instruments of the company(ies) discussed herein or act as an advisor or
lender/borrower to such company(ies) or may have any other potential conflict of interests with respect to any recommendation and other related information and opinions.
Unauthorized disclosure, use, dissemination or copying (either whole or partial) of this information, is prohibited. The person accessing this information specifically agrees to exempt MOSt or any of its
affiliates or employees from, any and all responsibility/liability arising from such misuse and agrees not to hold MOSt or any of its affiliates or employees responsible for any such misuse and further agrees to
hold MOSt or any of its affiliates or employees free and harmless from all losses, costs, damages, expenses that may be suffered by the person accessing this information due to any errors and delays. The
information contained herein is based on publicly available data or other sources believed to be reliable. Any statements contained in this report attributed to a third party represent MOSt’s interpretation of the
data, information and/or opinions provided by that third party either publicly or through a subscription service, and such use and interpretation have not been reviewed by the third party. This Report is not
intended to be a complete statement or summary of the securities, markets or developments referred to in the document. While we would endeavor to update the information herein on reasonable basis, MOSt
and/or its affiliates are under no obligation to update the information. Also there may be regulatory, compliance, or other reasons that may prevent MOSt and/or its affiliates from doing so. MOSt or any of its
affiliates or employees shall not be in any way responsible and liable for any loss or damage that may arise to any person from any inadvertent error in the information contained in this report. MOSt or any of
its affiliates or employees do not provide, at any time, any express or implied warranty of any kind, regarding any matter pertaining to this report, including without limitation the implied warranties of
merchantability, fitness for a particular purpose, and non-infringement. The recipients of this report should rely on their own investigations.
Recipients who are not institutional investors should seek advice of their independent financial advisor prior to taking any investment decision based on this report or for any necessary explanation of its
contents.
MOSt and/or its affiliates and/or employees may have interests/positions, financial or otherwise in the securities mentioned in this report. To enhance transparency, MOSt has incorporated a Disclosure of
Interest Statement in this document. This should, however, not be treated as endorsement of the views expressed in the report.
Disclosure of Interest Statement
Analyst ownership of the stock
Oberoi Realty
No
Disclosures
Oberoi Realty
Analyst Certification
The views expressed in this research report accurately reflect the personal views of the analyst(s) about the subject securities or issues, and no part of the compensation of the research analyst(s) was, is, or
will be directly or indirectly related to the specific recommendations and views expressed by research analyst(s) in this report. The research analysts, strategists, or research associates principally responsible
for preparation of MOSt research receive compensation based upon various factors, including quality of research, investor client feedback, stock picking, competitive factors and firm revenues.
Regional Disclosures (outside India)
For U.K.
This report is not directed or intended for distribution to or use by any person or entity resident in a state, country or any jurisdiction, where such distribution, publication, availability or use would be contrary to
law, regulation or which would subject MOSt & its group companies to registration or licensing requirements within such jurisdictions.
This report is intended for distribution only to persons having professional experience in matters relating to investments as described in Article 19 of the Financial Services and Markets Act 2000 (Financial
Promotion) Order 2005 (referred to as "investment professionals"). This document must not be acted on or relied on by persons who are not investment professionals. Any investment or investment activity to
which this document relates is only available to investment professionals and will be engaged in only with such persons.
For U.S.
Motilal Oswal Securities Limited (MOSL) is not a registered broker - dealer under the U.S. Securities Exchange Act of 1934, as amended (the"1934 act") and under applicable state laws in the United States.
In addition MOSL is not a registered investment adviser under the U.S. Investment Advisers Act of 1940, as amended (the "Advisers Act" and together with the 1934 Act, the "Acts), and under applicable state
laws in the United States. Accordingly, in the absence of specific exemption under the Acts, any brokerage and investment services provided by MOSL, including the products and services described herein
are not available to or intended for U.S. persons.
This report is intended for distribution only to "Major Institutional Investors" as defined by Rule 15a-6(b)(4) of the Exchange Act and interpretations thereof by SEC (henceforth referred to as "major institutional
investors"). This document must not be acted on or relied on by persons who are not major institutional investors. Any investment or investment activity to which this document relates is only available to major
institutional investors and will be engaged in only with major institutional investors. In reliance on the exemption from registration provided by Rule 15a-6 of the U.S. Securities Exchange Act of 1934, as
amended (the "Exchange Act") and interpretations thereof by the U.S. Securities and Exchange Commission ("SEC") in order to conduct business with Institutional Investors based in the U.S., MOSL has
entered into a chaperoning agreement with a U.S. registered broker-dealer, Motilal Oswal Securities International Private Limited. ("MOSIPL"). Any business interaction pursuant to this report will have to be
executed within the provisions of this chaperoning agreement.
The Research Analysts contributing to the report may not be registered /qualified as research analyst with FINRA. Such research analyst may not be associated persons of the U.S. registered broker-dealer,
MOSIPL, and therefore, may not be subject to NASD rule 2711 and NYSE Rule 472 restrictions on communication with a subject company, public appearances and trading securities held by a research
analyst account.
Motilal Oswal Capital Markets Singapore Pte Limited is acting as an exempt financial advisor under section 23(1)(f) of the Financial Advisers Act(FAA) read with regulation 17(1)(d) of the Financial Advisors
Regulations and is a subsidiary of Motilal Oswal Securities Limited in India. This research is distributed in Singapore by Motilal Oswal Capital Markets Singapore Pte Limited and it is only directed in Singapore
to accredited investors, as defined in the Financial Advisers Regulations and the Securities and Futures Act (Chapter 289), as amended from time to time.
In respect of any matter arising from or in connection with the research you could contact the following representatives of Motilal Oswal Capital Markets Singapore Pte Limited:
Anosh Koppikar
Kadambari Balachandran
Email : anosh.Koppikar@motilaloswal.com
Email : kadambari.balachandran@motilaloswal.com
Contact : (+65)68189232
Contact : (+65) 68189233 / 65249115
Office Address : 21 (Suite 31),16 Collyer Quay,Singapore 04931
For Singapore
21 July 2014
Motilal Oswal Securities Ltd
Motilal Oswal Tower, Level 9, Sayani Road, Prabhadevi, Mumbai 400 025
Phone: +91 22 3982 5500 E-mail: reports@motilaloswal.com
8