28 July 2014
1QFY15 Results Update | Sector:
Technology
Persistent Systems
BSE SENSEX
25,991
Bloomberg
Equity Shares (m)
M.Cap. (INR b) / (USD b)
52-Week Range (INR)
1, 6, 12 Rel. Per (%)
S&P CNX
7,749
PSYS IN
40.0
51.4/0.9
1,400/504
16/6/119
CMP: INR1,313
TP: INR1,350
Buy
Financials & Valuation (INR Billion)
Y/E Mar
Sales
EBITDA
Adj. PAT
Adj. EPS
(INR)
EPS Gr. (%)
BV/Sh.(INR)
RoE (%)
RoCE (%)
P/E (x)
EV/EBITDA
( )
2015E 2016E 2017E
18.8
4.4
3.0
74.7
19.8
370.7
22.4
18.1
17.6
9.7
21.8
5.4
3.7
93.2
24.8
438.3
23.7
18.5
14.1
7.6
25.8
6.5
4.7
117.5
26.1
531.0
25.0
19.3
11.2
5.8
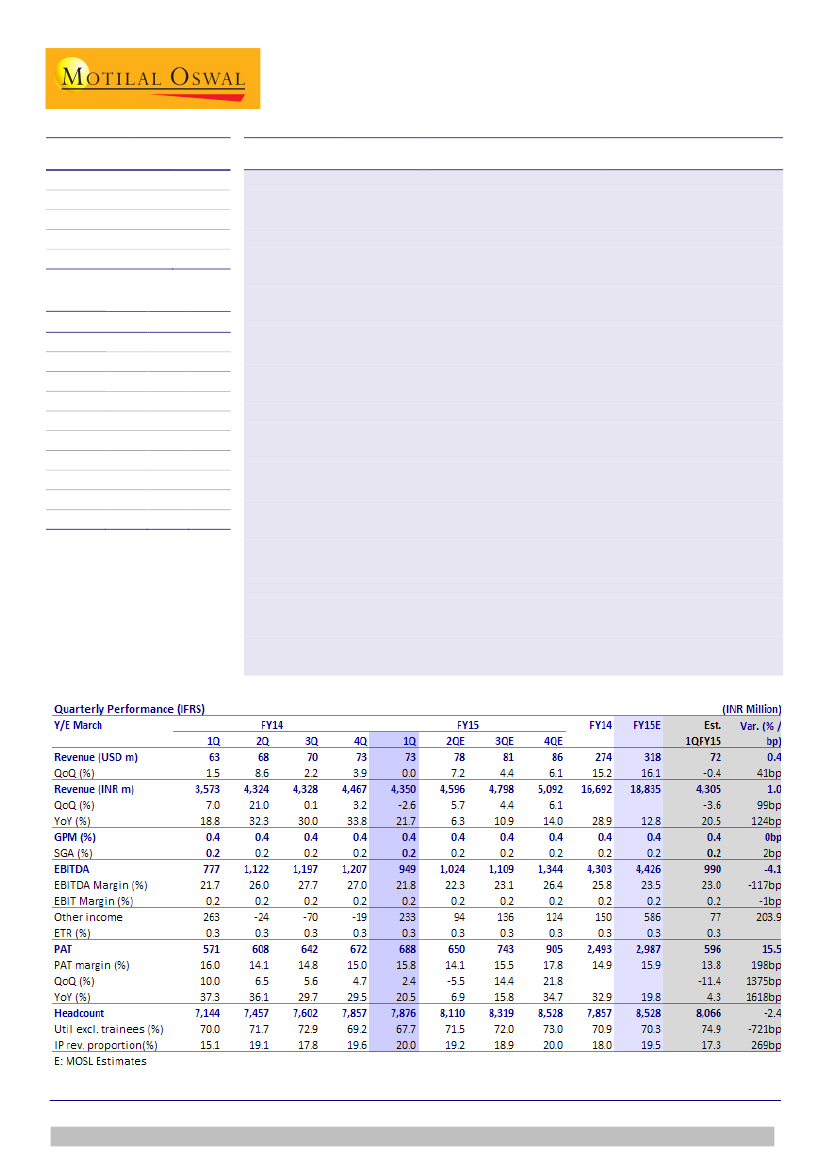
Revenues in line PAT above estimate:
PSYS’ 1QFY15 revenue was USD72.7m, flat
QoQ. EBITDA margin was 21.8%, -520bp QoQ, below our est. of 23% (-400bp
QoQ), on higher SGA (18.3% v/s estimate of 17.4%). Significantly higher other
income and forex drove PAT of INR688m, well above our estimate of INR596m.
IP-led revenues grow contrary to expectations:
The revenue mix was different as
IP-led revenues grew 2% QoQ to USD14.5m, v/s our est. of USD12.5m (-12%
QoQ).While linear revenues declined marginally to USD58.1m, v/s our est. of
USD59.8m.
Reiterates sanguine outlook for FY15:
PSYS has changed its go-to-market strategy
into three areas: [1] account [2] platform and [3] product / IP. PSYS is seeing a
healthy deal pipeline in all the three areas and is confident of achieving better
growth in FY15 compared to FY14’s 15.2% YoY. EBITDA margins faces headwinds
of ~250bp from salary hikes in the coming quarter. PSYS expects absence of visa
cost (150bp impact) and improvement in utilization to facilitate improving margin
trajectory through the remainder of the year. In FY14 EBITDA margins in 1Q were
21.7% while full year margins were 25.8%.
Adjusting our margin estimates for higher G&A:
We expect slightly better growth
in IP-led business, while moderating our expectations in the linear revenues. We
have revised our FY15 EBITDA margin downwards to 22.9%, 180bp lower,
following 1Q miss. Consequently, our EPS estimate for FY15 is lower by 2.4%.
Right place, right time; maintain Buy:
We believe PSYS is one of the few Tier-II IT
companies with the potential to grow revenues at or above 20%, given its focus on
the fast-growing SMAC business, multi-year relationships with marquee clientele
in the ISV space. Valuations offer limited upside in near term, but we remain
confident on company’s long term business fundamentals. Maintain
Buy
with a
target price of INR1,350.
Ashish Chopra
(Ashish.Chopra@MotilalOswal.com); +91 22 3982 5424
Siddharth Vora
(Siddharth.Vora@MotilalOswal.com); +91 22 3982 5585
Investors are advised to refer through disclosures made at the end of the Research Report.

Persistent Systems
1QFY15: Revenue in line; but IP-led revenues above estimate; offset
sluggish linear business
PSYS’ 1QFY15 revenue was USD72.7m, flat QoQ, in line with our estimate.
However, the revenue mix was different v/s our expectations, as IP-led revenues
grew 2% QoQ to USD14.5m, v/s our estimate of USD12.5m (-12% QoQ). On the
other hand, linear revenues declined marginally to USD58.1m (-0.5% QoQ), v/s
our estimate of USD59.8m (+2.5% QoQ).
USD revenue in line with estimate but with a different revenue mix
Source: Company, MOSL
Also, volumes in the linear business declined 2.3% QoQ, but the revenue impact
was curtailed due to 230bp onsite mix shift during the quarter (to 28.9%). Onsite
billing rates are 3.5x that at offshore for PSYS. Onsite pricing improved 3.8%
QoQ to USD14,905 per person month (PPM) while offshore pricing declined
0.5% to USD4,219 PPM.
In Rupee terms, revenue was INR4.35b, -2.6% QoQ, in line with our estimate of
INR4.31b. Average realized currency rate during the quarter was INR59.9, v/s
our estimate of INR59.5.
IP-led revenues grew during the quarter contrary to our expectation of a decline
Source: Company, MOSL
EBITDA margin was 21.8%, -520bp QoQ, below our estimate of 23% (-400bp
QoQ). However, gross margin declined 270bp QoQ to 40.1%, in line with our
estimate of 40.4%. G&A increased 190bp QoQ to 10% of revenues (v/s our
estimate of 8.5%). S&M increased 130bp QoQ to 8.9% of revenues, v/s our
estimate of 8.4%. Bad debt provision was 77bp tailwind during the quarter
(65bp positive delta to our estimate).
2
28 July 2014

Persistent Systems
EBITDA margin below our estimate due to higher SGA expense and bad debt provision
Source: Company, MOSL
Offshore utilization declined 180bp QoQ to 65.9%, contrary to our estimate of
200bp expansion. Onsite utilization was 88% v/s estimate of 89%. In-line gross
margin despite significantly lower offshore utilization in our opinion was a
function of revenue mix – with higher proportion of revenues from IP, at 20%,
v/s our estimate of 17.3%.
Offshore utilization declined 180bp QoQ v/s our estimate of 200bp expansion
Source: Company, MOSL
Forex gains during the quarter were INR133m, well above our estimate of
INR7m. Even excluding forex, other income was INR99.5m, above our estimate
of INR69.5m. Significantly higher other income and forex drove PAT of INR688m,
well above our estimate of INR596m.
Segment-wise performance: Infrastructure and Systems continues to drive
growth; North America remains the region of focus
Telecom & Wireless vertical grew the fastest during the quarter at 20.9% QoQ
post 11.7% decline in last quarter. PSYS started providing breakup of Financial
Services revenues which was previously classified under Infrastructure Systems.
Infrastructure Systems was 54.6% of revenues while Financial Services made up
13.8% of total revenues.
28 July 2014
3

Persistent Systems
Telecom & Wireless grew post last quarter’s 11.7% decline
Verticals
Infra. Sys. & Financial Services
Telecom & Wireless
Healthcare & LS
Contri. to
Rev. (%)
68.4
18.5
13.1
Growth -
QoQ (%)
4 Qtr
CQGR (%)
(4.4)
3.3
20.9
0.8
0.0
10.3
Source: Company, MOSL
Europe grew at 6.6% QoQ which was offset by decline in RoW (-0.6% QoQ);
North America was flattish in line with company average. The 4-quarter CQGR
has been very healthy for Europe at 11.6%, albeit on a small base.
North America remained flattish due to lack of visas
Geographies
North America
Europe
RoW
Contri. To
Rev. (%)
85.9
6.5
7.6
Growth –
QoQ (%)
4 Qtr
CQGR (%)
0.6
3.1
6.6
11.8
(10.6)
3.6
Source: Company, MOSL
Top 5 clients were flattish during the quarter post very strong performance in
the last quarter while Top 6-10 grew at a healthy rate post decline in last
quarter.
Top 5 clients were flattish for the quarter
Client Metrics
Top Client
Top 2-5 Clients (%)
Top 6-10 Clients (%)
Contri. To
Rev. (%)
20.8
17.9
10.3
Growth –
4 Qtr
QoQ (%)
CQGR (%)
(1.4)
3.1
(2.2)
7.9
13.2
2.2
Source: Company, MOSL
Takeaways from management commentary
Reclassification contributed towards Sales and Business headcount surge:
There was a significant addition to S&M headcount, which increased ~35% QoQ
to 202. PSYS’ S&M headcount has now more than doubled in the span of last 5
quarters (v/s only 99 in 4QFY13). However, there were 18 new S&M employee
additions while 34 employees where shifted from technical offshore roles to
account manager, front end sales and business development roles.
SMAC causing mainstream disruptions:
Cloud computing is increasingly
becoming mainstream, customers want to leverage the cloud and mobile
devices for next-gen applications. Cloud-led disruption is of two forms: [1] to
migrate their existing applications to cloud for cost efficiencies and [2]leveraging
cloud, analytics, mobility and social to provide a better experience to customer
and clients. PSYS has been exposed to new customers and businesses with new
challenges. PSYS had anticipated these challenges and have built capabilities
around the same.
Outlook for healthy FY15 with new go-to-market structure:
PSYS has changed
its go-to-market organization structure into three: [1] account-led [2] platform
led and [3] product / IP-led. PSYS is seeing a healthy deal pipeline in all the three
4
28 July 2014

Persistent Systems
areas and is confident of achieving better growth in FY15 compared to FY14’s
15.2% YoY.
Margin to improve gradually over FY15:
EBITDA margins declined 520bps
during the quarter and faces headwinds of ~250bp from salary hikes in the
coming quarter. PSYS expects absence of visa cost (150bp impact) and
improvement in utilization will help in gradually improving margins over FY15. In
FY14 EBITDA margins in 1Q were 21.7% while full year margins were 25.8%.
Change in estimates
Our USD revenue estimates remain unchanged post in line performance on the
top-line in 1QFY15. However, we expect slightly better growth in IP-led business,
while moderating our expectations in the linear revenues, adjusting for the
trend in 1QFY15.
We have revised our FY15 EBITDA margin downwards to 22.9%, 180bp lower,
following 1Q miss. While the uptick in utilization should help regain some lost
ground on 1Q margins, significant investments in the S&M headcount contribute
120bp of the overall decline, and G&A contribute towards majority of the
remainder.
Consequently, our EPS estimate for FY15 is lower by 2.4% in FY15 to INR 73 and
FY16E EPS is unchanged at INR94.4.
Change in estimates
Revised
FY15E
FY16E
59.2
58.0
318.2
376.7
16.1
18.4
23.5
24.5
27.2
26.0
74.7
93.2
Earlier
FY15E
59.1
318.1
16.1
24.7
26.6
74.7
FY16E
58.0
381.7
20.0
25.3
26.0
94.6
Change
FY15E
FY16E
0.1%
0.0%
0.0%
-1.3%
-120bp
-80bp
60bp
0bp
-0.1%
-1.5%
Source: Company, MOSL
INR/USD
USD Revenue - m
USD revenue gr. (%)
EBITDA Margin (%)
Tax Rate (%)
EPS - INR
Valuation and view: In the right place at the right time
In Tier-II IT, we prefer PSYS, given the following factors:
1. One of the few Tier-II companies with the potential to grow revenues at or
above 20%
2. Unlikelihood of obsolescence in its chosen segments over the medium to
long term
3. Multi-year relationships, with marquee clientele in the ISV space
4. Credible experience in agile product development and iterative approach to
Product Engineering – two very relevant trends in today’s market
5. Healthy profitability, with EBITDA margin in the top quartile of the industry
Fruition of client mining and Product Engineering for Enterprises could drive
overall USD revenue growth beyond 20%. We expect PSYS’ USD revenue to grow
at a CAGR of 17.2% and EPS at a CAGR of 22.3% over FY14-16. Our current target
price of INR1,350 discounts FY16E EPS by 14x, offering little upside in the stock.
While the stock may see some correction over the near term on rich valuations,
we remain positive on the long-term business fundamentals for the company.
28 July 2014
5

Persistent Systems
Other result highlights
260 Clients in the Product Engineering and Platform business (v/s 261 in
4QFY14) and 347 clients (v/s 358 clients in 3QFY14) in the IP-driven business
Number of USD1-3m clients increased by 2 to 38 whileUSD3m+ clients declined
by 1 to 14.
Cash and cash equivalents at the end of the quarter were INR6.63b (v/s
INR6.31b in 4QFY14).
Repeat business accounted for 86.7% of revenues, v/s 85.2% in the previous
quarter.
Offshore revenues as a proportion of services revenue declined by 210bp to
56.9%; Proportion of IP led revenues in total revenues increased by 40bp to
20%.
Attrition rate increased 60bp to 14% from 13.4% in 4QFY14.
Receivables increased by 6 days QoQ to 69.
Blended Utilization during the quarter decreased 150 bp QoQ to 67.7%.
28 July 2014
6

Persistent Systems
Story in charts
Aggressive foray in IP-led revenues...
… and strong traction in Platforms business…
Source: Company, MOSL
…have offset sluggish linear services (ex-platform, ~60% rev)
Access to market is key to scale-hiring actively on front end
Source: Company, MOSL
Turnaround in linear revenues is key to 20%+ growth…
…and continued IP traction will ensure profitability is intact
Source: Company, MOSL
28 July 2014
7

Persistent Systems
Operating Metrics
1QFY13
Verticals (%)
Telecom & Wireless
Infrastructure & Systems
Life Sciences & Healthcare
Geography (%)
North America
Europe
RoW
Revenue Mix (%)
Services: Onsite
Services: Offshore
IP Led
Client Metrics (%)
Top Client
Top 2-5 Clients
Top 6-10 Clients
Clients billed
Prod. Eng. & Platforms
IP Led
Customer Engagement Size
USD3m+
USD1-3m
Repeat Business
Employee Metrics
Technical People
Sales & BD
Others
Total
Billable Person Months
- Onsite
- Offshore
Linear Utilization %
Onsite Utilization %
Offshore Utilization %
Attrition (%)
DSO
IP Led Person Months
Yield (USD/p.p.m)
Billing Rates (USD/p.p.m)
Onsite
Offshore
24.2
64.3
11.5
2QFY13
28.0
62.4
9.6
3QFY13
26.1
63.4
10.5
4QFY13
22.8
66.5
10.7
1QFY14
20.7
69.1
10.2
2QFY14
17.6
69.2
13.2
3QFY14
18.0
68.9
13.2
4QFY14
15.3
71.6
13.1
1QFY15
18.5
54.6
13.1
84.4
6.9
8.7
84.6
7.4
8.0
85.2
6.1
8.8
85.1
5.7
9.2
87.6
4.8
7.6
84.6
4.4
11.0
83.1
6.0
10.9
85.4
6.1
8.5
85.9
6.5
7.6
19.3
66.7
13.9
17.6
63.5
18.9
17.0
64.8
18.2
18.8
63.7
17.5
21.2
63.7
15.1
20.6
60.3
19.1
20.5
61.7
17.8
21.4
59.0
19.6
23.1
56.9
20.0
17.8
15.7
11.8
20.7
15.6
10.7
21.1
16.2
12.1
21.6
15.1
11.2
21.2
15.2
10.9
22.5
15.2
9.5
19.8
17.1
10.3
21.1
18.3
9.1
20.8
17.9
10.3
254
76
254
80
264
394
279
418
253
387
243
388
253
380
261
358
260
347
13
35
90.3
15
32
81.7
14
29
81.4
15
29
78.2
15
30
83.0
16
32
82.2
16
34
82.7
15
36
85.2
14
38
86.7
6,132
94
310
6,536
14,104
5,956
99
315
6,370
13,655
906
12,749
75.2
90.7
74.1
16.9
64
2,254
3,775
6,287
101
331
6,719
13,570
915
12,655
77.3
88.5
76.5
16.0
67
2,257
3,838
6,540
99
331
6,970
14,212
967
13,245
72.5
86
71.5
14.4
65
2,267
3,769
6,689
119
336
7,144
15,161
1,081
14,080
70.0
84.9
68.8
14.2
65
2,335
3,602
6,982
128
347
7,457
15,258
1,106
14,152
71.7
89.4
70.3
14.0
62
2,210
3,919
7,109
139
354
7,602
15,517
1,152
14,365
72.9
85.9
71.8
13.2
63
2,260
3,934
7,349
150
358
7,857
16,155
1,246
14,909
69.2
86.9
67.7
13.4
63
2,343
3,927
7,271
202
403
7,876
16,139
1,283
14,856
67.7
88
65.9
14.0
69
2,419
3,915
74.1
18.9
68
2,196
3,369
12,789
3,898
12,863
3,978
12,778
4,068
14,014
4,176
14,538
4,147
14,277
4,146
14,510
14,355
14,905
4,179
4,241
4,219
Source: Company, MOSL
28 July 2014
8

Persistent Systems
Persistent Systems: an investment profile
Company description
Persistent is a global company specializing in software
product and technology innovation, partnering with
pioneering start-ups, innovative enterprises and the
world’s largest technology brands. The company staffs
over 7,850 employees and clocked revenues of
USD274m (FY14). It has a clear focus on new initiatives
that are witnessing greater demand and will drive the
next wave of growth in technology - Cloud, Mobility,
Data Analytics and Collaboration.
Recent developments
Roshini Bakshi joined as Independent Director.
Acquired assets of Hoopz Planet Info. Pvt. Ltd., a
Pune based Web Discovery Solution Provider.
Inaugurated a new building in Goa that doubled
capacity to 600 seats.
We expect PSYS to grow its revenues at a CAGR of
17.2% and an EPS CAGR of 22.3% over FY14-16.
The stock trades at 17.6x FY15E and 14.1x FY16E
EPS. Maintain
Buy,
with a TP INR1,350 (14xFY16
EPS).
With strengthening demand in the US and large
deals traction in traditional services in Europe,
industry growth in FY15 should be better than
FY14.
Digital technologies/SMAC may not be a needle
mover right now but are increasingly seeing
traction and can potentially drive downstream
opportunity.
We see better risk-reward in Tier-I v/s Tier-II.
Currency is a key risk to valuations, and Tier-II has
a higher sensitivity to the same v/s Tier-I
MOSL
Forecast
FY15
FY16
74.7
93.2
Consensus
Forecast
77.7
90.8
Variation
(%)
-3.9
2.6
Valuation and view
Key investment arguments
PSYS is an early entrant and has marquee clientele
in cutting-edge technologies around cloud, mobility,
collaboration and analytics; witnessing faster
growth.
The company’s foray into IP-driven businesses by
acquiring assets has helped improved its margin
profile.
Increasing thrust on expanding IP-led revenue share
introduces greater volatility and higher risk in the
business model.
Sensitivity of margins to currency fluctuations is
higher.
PSYS
P / E (x)
P / BV(x)
EV / Sales (x)
EV / EBITDA (x)
FY15E
FY16E
FY15E
FY16E
FY15E
FY16E
FY15E
FY16E
17.6
14.1
3.5
3.0
2.3
1.9
9.7
7.6
MTCL
16.7
13.8
4.3
3.4
2.2
1.8
10.8
8.4
NITEC
10.9
10.2
2.4
2.0
1.2
0.9
7.2
5.7
Sector view
Key investment risks
Comparative valuations
EPS: MOSL forecast v/s consensus (INR)
Target price and recommendation
Current
Price (INR)
1,313
Target
Price (INR)
1,350
Upside
(%)
2.8
Reco
Buy
Stock performance (1-year)
Shareholding pattern (%)
Jun-14
Promoter
DII
FII
Others
39.0
10.3
26.9
23.8
Mar-14
39.0
15.9
20.2
25.0
Jun-13
39.0
19.8
14.4
26.9
Note: FII Includes depository receipts
28 July 2014
9

Persistent Systems
Financials and valuations
28 July 2014
10

Persistent Systems
NOTES
28 July 2014
11

Disclosures
This research report has been prepared by MOSt to provide information about the company(ies) and sector(s), if any, covered in the report and may be distributed by it and/or its affiliated company(ies). This
Persistent Systems
report is for personal information of the select recipient and does not construe to be any investment, legal or taxation advice to you. This research report does not constitute an offer, invitation or inducement to
invest in securities or other investments and Motilal Oswal Securities Limited (hereinafter referred as MOSt) is not soliciting any action based upon it. This report is not for public distribution and has been
furnished to you solely for your general information and should not be reproduced or redistributed to any other person in any form. This report does not constitute a personal recommendation or take into
account the particular investment objectives, financial situations, or needs of individual clients. Before acting on any advice or recommendation in this material, investors should consider whether it is suitable
for their particular circumstances and, if necessary, seek professional advice. The price and value of the investments referred to in this material and the income from them may go down as well as up, and
investors may realize losses on any investments. Past performance is not a guide for future performance, future returns are not guaranteed and a loss of original capital may occur.
MOSt and its affiliates are a full-service, integrated investment banking, investment management, brokerage and financing group. We and our affiliates have investment banking and other business
relationships with a significant percentage of the companies covered by our Research Department Our research professionals provide important input into our investment banking and other business selection
processes. Investors should assume that MOSt and/or its affiliates are seeking or will seek investment banking or other business from the company or companies that are the subject of this material and that
the research professionals who were involved in preparing this material may participate in the solicitation of such business. The research professionals responsible for the preparation of this document may
interact with trading desk personnel, sales personnel and other parties for the purpose of gathering, applying and interpreting market information. Our research professionals are paid in part based on the
profitability of MOSt which include earnings from investment banking and other business. MOSt generally prohibits its analysts, persons reporting to analysts, and members of their households from
maintaining a financial interest in the securities or derivatives of any companies that the analysts cover. Additionally, MOSt generally prohibits its analysts and persons reporting to analysts from serving as an
officer, director, or advisory board member of any companies that the analysts cover. Our salespeople, traders, and other professionals or affiliates may provide oral or written market commentary or trading
strategies to our clients that reflect opinions that are contrary to the opinions expressed herein, and our proprietary trading and investing businesses may make investment decisions that are inconsistent with
the recommendations expressed herein. In reviewing these materials, you should be aware that any or all o the foregoing, among other things, may give rise to real or potential conflicts of interest . MOSt and
its affiliated company(ies), their directors and employees may; (a) from time to time, have a long or short position in, and buy or sell the securities of the company(ies) mentioned herein or (b) be engaged in
any other transaction involving such securities and earn brokerage or other compensation or act as a market maker in the financial instruments of the company(ies) discussed herein or act as an advisor or
lender/borrower to such company(ies) or may have any other potential conflict of interests with respect to any recommendation and other related information and opinions.
Unauthorized disclosure, use, dissemination or copying (either whole or partial) of this information, is prohibited. The person accessing this information specifically agrees to exempt MOSt or any of its
affiliates or employees from, any and all responsibility/liability arising from such misuse and agrees not to hold MOSt or any of its affiliates or employees responsible for any such misuse and further agrees to
hold MOSt or any of its affiliates or employees free and harmless from all losses, costs, damages, expenses that may be suffered by the person accessing this information due to any errors and delays. The
information contained herein is based on publicly available data or other sources believed to be reliable. Any statements contained in this report attributed to a third party represent MOSt’s interpretation of the
data, information and/or opinions provided by that third party either publicly or through a subscription service, and such use and interpretation have not been reviewed by the third party. This Report is not
intended to be a complete statement or summary of the securities, markets or developments referred to in the document. While we would endeavor to update the information herein on reasonable basis, MOSt
and/or its affiliates are under no obligation to update the information. Also there may be regulatory, compliance, or other reasons that may prevent MOSt and/or its affiliates from doing so. MOSt or any of its
affiliates or employees shall not be in any way responsible and liable for any loss or damage that may arise to any person from any inadvertent error in the information contained in this report. MOSt or any of
its affiliates or employees do not provide, at any time, any express or implied warranty of any kind, regarding any matter pertaining to this report, including without limitation the implied warranties of
merchantability, fitness for a particular purpose, and non-infringement. The recipients of this report should rely on their own investigations.
Recipients who are not institutional investors should seek advice of their independent financial advisor prior to taking any investment decision based on this report or for any necessary explanation of its
contents.
MOSt and/or its affiliates and/or employees may have interests/positions, financial or otherwise in the securities mentioned in this report. To enhance transparency, MOSt has incorporated a Disclosure of
Interest Statement in this document. This should, however, not be treated as endorsement of the views expressed in the report.
Disclosure of Interest Statement
Analyst ownership of the stock
PERSISTENT SYSTEMS LTD
No
Analyst Certification
The views expressed in this research report accurately reflect the personal views of the analyst(s) about the subject securities or issues, and no part of the compensation of the research analyst(s) was, is, or
will be directly or indirectly related to the specific recommendations and views expressed by research analyst(s) in this report. The research analysts, strategists, or research associates principally responsible
for preparation of MOSt research receive compensation based upon various factors, including quality of research, investor client feedback, stock picking, competitive factors and firm revenues.
Regional Disclosures (outside India)
For U.K.
This report is not directed or intended for distribution to or use by any person or entity resident in a state, country or any jurisdiction, where such distribution, publication, availability or use would be contrary to
law, regulation or which would subject MOSt & its group companies to registration or licensing requirements within such jurisdictions.
This report is intended for distribution only to persons having professional experience in matters relating to investments as described in Article 19 of the Financial Services and Markets Act 2000 (Financial
Promotion) Order 2005 (referred to as "investment professionals"). This document must not be acted on or relied on by persons who are not investment professionals. Any investment or investment activity to
which this document relates is only available to investment professionals and will be engaged in only with such persons.
Motilal Oswal Securities Limited (MOSL) is not a registered broker - dealer under the U.S. Securities Exchange Act of 1934, as amended (the"1934 act") and under applicable state laws in the United States.
In addition MOSL is not a registered investment adviser under the U.S. Investment Advisers Act of 1940, as amended (the "Advisers Act" and together with the 1934 Act, the "Acts), and under applicable state
laws in the United States. Accordingly, in the absence of specific exemption under the Acts, any brokerage and investment services provided by MOSL, including the products and services described herein
are not available to or intended for U.S. persons.
This report is intended for distribution only to "Major Institutional Investors" as defined by Rule 15a-6(b)(4) of the Exchange Act and interpretations thereof by SEC (henceforth referred to as "major institutional
investors"). This document must not be acted on or relied on by persons who are not major institutional investors. Any investment or investment activity to which this document relates is only available to major
institutional investors and will be engaged in only with major institutional investors. In reliance on the exemption from registration provided by Rule 15a-6 of the U.S. Securities Exchange Act of 1934, as
amended (the "Exchange Act") and interpretations thereof by the U.S. Securities and Exchange Commission ("SEC") in order to conduct business with Institutional Investors based in the U.S., MOSL has
entered into a chaperoning agreement with a U.S. registered broker-dealer, Motilal Oswal Securities International Private Limited. ("MOSIPL"). Any business interaction pursuant to this report will have to be
executed within the provisions of this chaperoning agreement.
The Research Analysts contributing to the report may not be registered /qualified as research analyst with FINRA. Such research analyst may not be associated persons of the U.S. registered broker-dealer,
MOSIPL, and therefore, may not be subject to NASD rule 2711 and NYSE Rule 472 restrictions on communication with a subject company, public appearances and trading securities held by a research
analyst account.
Motilal Oswal Capital Markets Singapore Pte Limited is acting as an exempt financial advisor under section 23(1)(f) of the Financial Advisers Act(FAA) read with regulation 17(1)(d) of the Financial Advisors
Regulations and is a subsidiary of Motilal Oswal Securities Limited in India. This research is distributed in Singapore by Motilal Oswal Capital Markets Singapore Pte Limited and it is only directed in Singapore
to accredited investors, as defined in the Financial Advisers Regulations and the Securities and Futures Act (Chapter 289), as amended from time to time.
In respect of any matter arising from or in connection with the research you could contact the following representatives of Motilal Oswal Capital Markets Singapore Pte Limited:
Anosh Koppikar
Kadambari Balachandran
Email:anosh.Koppikar@motilaloswal.com
Email : kadambari.balachandran@motilaloswal.com
Contact(+65)68189232
Contact: (+65) 68189233 / 65249115
Office Address:21 (Suite 31),16 Collyer Quay,Singapore 04931
For U.S.
For Singapore
Motilal Oswal Securities Ltd
28 July 2014
Motilal Oswal Tower, Level 9, Sayani Road, Prabhadevi, Mumbai 400 025
Phone: +91 22 3982 5500 E-mail: reports@motilaloswal.com
12