31 July 2014
1QFY15 Results Update | Sector:
Consumer
Bajaj Electricals
BSE SENSEX
25,895
Bloomberg
Equity Shares (m)
M.Cap. (INR b)/(USD b)
52-Week Range (INR)
1, 6, 12 Rel. Per (%)
S&P CNX
7,721
BJE IN
100.3
28.7/0.5
385/150
-18/10/40
CMP: INR287
TP: INR350
Buy
Financials & Valuation (INR Million)
Y/E Mar
2015E 2016E 2017E
Net Sales
EBITDA
Adj PAT
EPS (INR)
Gr. (%)
BV/Sh(INR)
RoE (%)
RoCE (%)
P/E (x)
P/BV (x)
46,649 54,243 62,853
2,939
1,234
12.3
-2,424
78.6
16.5
26.0
23.2
3.6
4,068
1,910
19.1
54.8
90.7
22.6
34.1
15.0
3.2
4,903
2,397
24.0
25.5
107.7
24.2
37.2
12.0
2.7
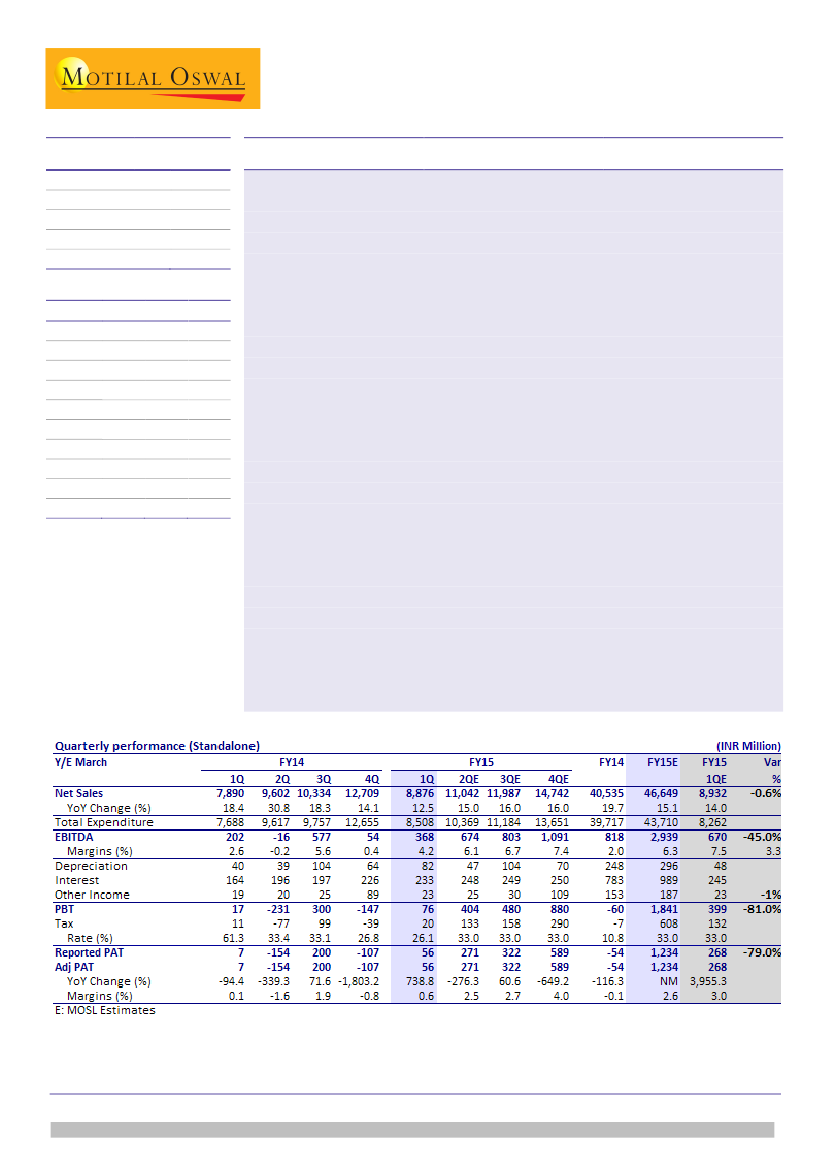
Growth in line; margins below expectation:
Bajaj Electricals (BJE) reported
revenue of INR8.9b (est. of INR8.9b), compared to INR7.8b in 1QFY14, marking a
YoY growth of 12.5%. Consumer Durables reported strong 16% growth, while
Lighting and E&P division’s growth was weak this quarter at 7.2% and 7.4%
respectively. EBITDA margin for 1QFY15 stood at 4.2% (est. 7.5%), against 2.6% in
1QFY14. While E&P reported better margins at -2.8%, against -13.7% in 1QFY14
(-4.7% 4QFY14), margins were below expectations due to unfavorable operating
leverage. Margins for Lighting (1.5% v/s 4.9%) were weak due to a sharp decline in
CFL business, which de-grew by 13% this quarter. Consumer Durables margins
recovered on a QoQ basis (6.9% v/s 3.6%), though on a YoY basis were weak (6.9%
v/s 9.2%) due to competitive pressure faced in Fans and Morphy Richards.
E&P turnaround on track:
BJE’s management maintained its guidance of 25%
growth in E&P business for FY15, with each of the next three quarters witnessing
progressive growth. Management expects 2Q revenue at INR3b, 3Q revenue at
INR4b and 4Q revenue at INR6b respectively. Similarly, it is confident of posting
6% EBIT margin (est 4%) in E&P division for FY15 and RoCE of 20%.
Consumer Durables outlook strong, Lighting segment to remain subdued:
We
believe BJE’s Consumer Durables division will continue to report robust growth in
FY15 and expect 15% revenue growth from the same. Lighting segment is
expected to remain under pressure due to accelerated shift from CFL (erstwhile
high growth, high margin for BJE) to LED (where it has negligible market share).
We expect Lighting to post 10% revenue growth in FY15E with stable margins YoY.
Valuation and view:
With the expected turnaround of E&P business, we believe
BJE’s valuation gap with peers will narrow down. We cut the EPS estimates for
FY15E and FY16E by 33% and 15% respectively to factor lower margins. We value
BJE at 18x FY16E EPS of INR19 and arrive at a target price of INR350. Maintain
Buy.
Atul Mehra
(Atul.Mehra@MotilalOswal.com); +91 22 3982 5417
Niket Shah
(Niket.Shah@MotilalOswal.com); +91 22 3982 5426
Investors are advised to refer through disclosures made at the end of the Research Report.

Bajaj Electricals
Revenue growth in line
BJE reported revenues of INR8.9b (est of INR8.9b) as compared to INR7.8b in
1QFY14, marking a YoY growth of 12.5%.
Lighting business grew by 7% YoY to INR1.68b, while consumer durables grew by
16% to INR5.05b. E&P business grew by 13% YoY to INR2.14b
EBITDA stood at INR368m (est INR670m) as against INR202m in 1QFY14,
marking a YoY growth of 82%. EBITDA margins for 1QFY15 stood at 4.2% (est
7.5%) against 2.6% in 1QFY14.
Margins for the lighting division stood at 1.5% as against 4.9% in 1QFY14, while
consumer durable margins stood at 6.9% as against 9.2% in 1QFY14. E&P posted
a turn-around with margins for the quarter standing at -2.8% as against -13.7%
in 1QFY14 (however lower than management guidance of +5% EBIT margins).
Capital employed as of 1QFY15 stood at INR8.3b as against INR7.6b in 1QFY14
marking a YoY growth of 10%. On a YoY basis, capital employed grew by -13% in
lighting division and stood at INR796m, grew by -60% in consumer durables
division and stood at INR700m and grew 40% in E&P division and stood at
INR5137m.
PAT for 1QFY15 stood at INR56m (est INR268m) as compared to INR7m in
1QFY14.
Capex for FY15 expected at INR900m including INR500m for R&D centre.
Revenue growth at 12.5%
Source: Company, MOSL
EBITDA growth subdued led by lower margins
EBITDA (INR m)
5.2
3.4
1.2
350
246
382
132
202
4.4
2.6
-0.2
-16
577
0.4
54
368
EBITDA Margin (%)
5.6
4.2
PAT muted due to E&P losses
PAT (INR m)
3.7
1.9
1.8
120
270
1.3
117
6
7
-154
200
-107
0.6
56
PAT Margin (%)
0.1
0.1
(1.6)
(0.8)
Source: Company, MOSL
31 July 2014
2

Bajaj Electricals
Lighting and Luminaires business margins worsen further
Lighting and Luminaires business revenues grew by 7% YoY to INR3b.
While lighting posted 0.3% growth, Luminaires grew by 17% YoY.
Margins for the lighting division stood at 1.5% as against 4.9% in 1QFY14.
Lighting reported 0% margin, Luminaires margins stood at 7%.
Lighting segment is expected to remain under pressure due to accelerated shift
from CFL (erstwhile high growth, high margin segment for BJE) to LED (where
BJE has negligible market share).
We expect lighting to post 10% revenue growth in FY15 and stable margins.
1QFY15 saw weak revenue growth for lighting division
Revenues (INR m)
Growth (YoY) %
24.4
19.7
14.9
10.7
6.6
1,525
1QFY13
2,018
2QFY13
2,216
3QFY13
2,847
4QFY13
3.2
1,574
1QFY14
2,509
2QFY14
11.6
4.5
2,975
2,472
3QFY14
4QFY14
7.2
1,686
1QFY15
Source: Company, MOSL
Margins stood at 1.5% as against 4.9%, decline 340bp YoY
EBIT (INR m)
7.0
7.9
4.9
EBIT Margin (%)
7.6
5.2
3.0
1.5
74
1QFY13
130
2QFY13
156
3QFY13
224
4QFY13
77
1QFY14
191
2QFY14
129
3QFY14
89
4QFY14
25
1QFY15
6.5
4.8
Source: Company, MOSL
RoCE profile deteriorates due to decline in margins
Capital Employed (INR m)
RoCE (%)
159.0
96.7
47.0
627
1QFY13
538
2QFY13
604
3QFY13
732
4QFY13
103.5
122.5
114.6
88.4
33.7
911
1QFY14
668
2QFY14
323
3QFY14
402
4QFY14
796
12.5
1QFY15
Source: Company, MOSL
31 July 2014
3

Bajaj Electricals
Consumer durables growth bounces back; margins yet to fully recover
Consumer durables (CD) business revenues grew by 16% YoY to INR5.0b.
Growth was led by Kitchen Appliances Division (KAP) which posted 18% growth
YoY. Domestic Appliances Division (DAP) posted 9.1% growth during the quarter.
Fans business grew by 19% during the quarter while Morphy Richards (MR)
witnessed 7% growth during the quarter.
Margins for the CD division stood at 6.9% as against 9.2% in 1QFY14.
Margins were impacted due to higher competitive pressure in MR and Fans.
Management expects margins at 8% levels for FY15.
1QFY15 saw revenue growth bounce back for consumer durable division
Revenues (INR m)
28.9
17.5
22.0
22.4
11.7
13.8
2.9
3,908
1QFY13
3,988
2QFY13
5,046
3QFY13
5,436
4QFY13
4,366
1QFY14
4,539
2QFY14
5,192
3QFY14
15.6
Growth (YoY) %
5,330
(2.0) 5,046
4QFY14
1QFY15
Source: Company, MOSL
Margins stood at 6.9% as against 9.2%, decline 240bp YoY, improve 330bp QoQ
EBIT (INR m)
12.1
8.4
9.3
8.0
9.2
EBIT Margin (%)
8.5
9.6
6.9
3.6
328
1QFY13
369
2QFY13
609
3QFY13
438
4QFY13
403
1QFY14
386
2QFY14
500
3QFY14
191
4QFY14
346
1QFY15
Source: Company, MOSL
RoCE improves significantly YoY; as capital employed declines by 60% YoY
Capital Employed (INR m)
RoCE (%)
106.2
80.3
56.6
40.9
23.4
804
1QFY13
1,577
2QFY13
759
3QFY13
32.2
1,359
4QFY13
22.8
1,770
1QFY14
29.2
1,321
2QFY14
884
3QFY14
717
4QFY14
700
1QFY15
49.5
Source: Company, MOSL
31 July 2014
4

Bajaj Electricals
Bajaj Electricals has a huge mass market product portfolio
Segment
Sub-
Segment
Lighting
Lighting
Luminaries
25,000
Mkt Size
(INR m)
50,000
Organized Mkt Share
Description
Competition
(%)
(%)
GLS lamps, fluorescent tube lights, compact
Philips, Crompton,
65%
8%
fluorescent lamps, domestic luminaries, ballasts &
Surya, Havells, etc
starters, LED torches
Industrial, commercial, decorative, street light,
floodlight, LED, lighting electronics, lighting control, Phillips, Crompton,
65%
5%
Wipro, Thorn
HID Lamps: Mercury & sodium vapor lamps,
halogen lamps, metal halide & fluorescent lamps
Ceiling, table, pedestal & wall mounted fans,
Crompton, Usha,
personal fans, Bajaj-Disney children’s fans,
65%
17%
Orient, Khaitan,
Industrial exhaust fans, commercial air industrial
Polar, Havells
fans, circulators, cooler kits and pumps
Mixers grinders, juicers, food processors, water
heaters, air coolers, iron, ovens toasters grillers
Philips, Kenstar,
(OTG), room heaters, toasters & S/W makers, hand Usha, Maharaja,
70%
20%
blenders, water filters microwave ovens gas stove Preeti, Prestige,
purifiers & filters, ovens, stoves, electric kettles,
Kenwood
coffee/tea makers
Source: Company, MOSL
Fans
Consumer Durables
Appliances
35,000
68,000
Bajaj has a strong retail network
Retail Network
400,000
45,000
86,000
Appliances
Fans
Lighting
Source: Company, MOSL
BJE has the highest reach as
compared to peers like Havells
and TTK Prestige
Bajaj leads the distribution game…
Channel
Retail Network
EBOs
Bajaj Electricals
4,00,000
Havells
> 1,00,000
TTK Prestige
25,000
Source: Company, MOSL
103 'Bajaj World' Stores 210 'Havells Galaxy' Stores 500 'Prestige Smart Kitchen' Stores
Bajaj World Stores to be expanded aggressively
BJE has aggressively grown Bajaj World Stores from 40 in FY13 to 103 in FY14.
Management is confident of doubling store count to 200 by FY15.
Bajaj World Stores to improve brand visibility and loyalty.
Bajaj World Stores
250
200
Bajaj World Stores to be significantly expanded
103
40
FY13
FY14
FY15E
FY16E
Source: Company, MOSL
31 July 2014
5

Bajaj Electricals
Engineering and Projects turnaround on track
Revenues for the E&P division grew by 7.4% to INR2.1b during the quarter.
Margins for the division improved from -13.7% to -2.8% on a YoY basis. On a
sequential basis, margins improved by 200bp from -4.7% to -2.8%.
BJE has an outstanding order book amounting to INR23b in E&P.
BJE’s management has maintained its guidance of 25% growth in E&P business
for FY15 with each of the next three quarters witnessing progressive growth.
Management expects 2Q revenues at INR3b, 3Q revenues at INR4b and 4Q
revenues at INR6b.
Management maintains that margins for the division will be 6% in FY15.
Management is targeting to maintain capital employed at current levels of
INR6b, even as business will expand by more than 20% annually over FY14-16.
Consequently, asset turnover is expected to improve to 2.5x and RoCE for the
division is expected to improve to 20%.
E&P division grows by 7.4% YoY
Source: Company, MOSL
E&P turnaround on track as profitability continues to improve
EBIT (INR m)
1QFY13
-71
-5.7
-13.7
-20.2
-27.1
-17.8
-17.0
2QFY13
-268
3QFY13
-398
4QFY13
-507
1QFY14
-259
EBIT Margin (%)
2QFY14
-433
3QFY14
-135
-5.1
4QFY14
-205
-4.7
-2.8
1QFY15
-59
Source: Company, MOSL
31 July 2014
6

Bajaj Electricals
Legacy contracts resulting in losses and sub-optimal return profile
Capital Employed (INR m)
-1.3
-4.5
-6.9
-10.7
5,625
1QFY13
5,918
2QFY13
5,731
3QFY13
4,752
4QFY13
4,892
1QFY14
5,137
2QFY14
5,950
3QFY14
-5.3
-8.4
6,309
-13.0 6,858
4QFY14
1QFY15
RoCE (%)
-2.3
-0.9
Source: Company, MOSL
Management is targeting 20% RoCE, led by 2.5x asset turn and 8% EBIT margin
Asset Turnover (x)
23%
1.9
19%
15%
1.7
11%
1.6
9%
1.6
5%
3%
-26%
FY09
FY10
FY11
FY12
FY13
1.4
1.4
-13%
13%
-18%
-9%
FY14
FY15
FY16
8%
8%
EBIT Margins (%)
RoCE (%)
2.5
20%
2.5
20%
Source: Company, MOSL
31 July 2014
7

Bajaj Electricals
Story in charts
Revenue Contribution (%)
Segment Profitability (%)
128%
Engineering
&
Projects, 20
Lighting, 25
Segment RoCE (%)
80%
Consumer
Durables, 50
-26%
Consumer Durables
Lighting
E&P
Source: MOSL, Company
E&P segment a drag on overall profitability
11%
E&P division's contibution to operating profits (%)
27%
21%
Management changes to ensure turnaround
E&P EBIT (INR m)
3.2%
Margin
4.0%
6.0%
265
(1,243)
-114%
FY12
FY13
-110%
FY14
FY15E
FY16E
FY12
-18.1%
FY13
(1,032)
-9.0%
552
994
FY14
FY15E
FY16E
Source: MOSL, Company
Earnings to expand
PAT
1,938
1,179
329
1,243
Bajaj Electricals reports strong overall capital efficiency
RoCE (%)
35
29
26
13
(53)
FY14
FY15E
FY16E
7
FY12
FY13
FY12
FY13
FY14
FY15E
FY16E
Source: MOSL, Company
31 July 2014
8

Bajaj Electricals
Bajaj Electricals: an investment profile
Company description
BJE operates largely in three segments – Lighting &
Luminaires (LL), Consumer Durables (CD) and
Engineering & Projects (E&P). The CD segment
contributes ~55% to revenues, while the LL segment
contributes ~25% to revenues. Together, Consumer-
facing Appliances and Lighting businesses, for which
BJE is known for, contribute ~80% to revenues. The
E&P segment contributes ~20% to revenues.
BJE has a wide distribution reach, with over 4,100
dealers and a 400k strong retail network for Lighting,
86k dealers for Fans and 45k dealers for Appliances
across India. Manufacturing is entirely outsourced to
80 different vendors across India, leaving the
management free to focus on innovation, brand
building and distribution.
We expect the E&P business to witness a sharp
turnaround in FY15 led by key initiatives undertaken
over the last 12 months.
Consolidated earnings are set to quadruple over
FY14-16, driven by the expected turnaround in E&P
and continued robust performance in Consumer-
facing businesses. The stock should see a re-rating,
as overall performance improves.
Key investments risks
Key investments arguments
BJE’s import content (includes 40% of Morphy
Richards, 20% of Appliances, 10% each of Lighting
and Fans) contributes ~15% of its revenues. INR
depreciation could put pressure on near-term
margins.
Contrary to our expectations, if the E&P business
does not recover, the stock price may be adversely
impacted.
Bajaj Electricals (BJE) enjoys enviable consumer
franchise, with market leadership in Small
Appliances. Given its asset-light model, large
product portfolio and wide distribution network,
the performance of its Consumer-facing businesses
remains robust.
BJE’s Engineering & Projects (E&P) business,
however, has been burning cash, impacting
consolidated financials and stock performance.
Valuation and view
With the expected turnaround of E&P business,
we believe BJE’s valuation gap with peers will
narrow down. We cut the EPS estimates for FY15E
and FY16E by 33% and 15% respectively to factor
lower margins. We value BJE at 18x FY16E EPS of
INR19 and arrive at a target price of INR350.
Maintain
Buy.
Target price and recommendation
Current
Price (INR)
287
Target
Price (INR)
350
Upside
(%)
22.0
Reco
Buy
EPS: MOSL forecast v/s consensus (INR)
MOSL
Forecast
FY15
FY16
12.3
19.1
Consensus
Forecast
17.5
22.6
Variation
(%)
-29.7
-15.5
Shareholding pattern (%)
Jun-14
Promoter
DII
FII
Others
65.9
3.9
16.3
14.0
Mar-14
66.1
3.8
14.7
15.4
Jun-13
66.1
5.9
10.9
17.2
Stock performance (1-year)
Note: FII Includes depository receipts
31 July 2014
9

Bajaj Electricals
Financials and valuations
Income statement
Y/E March
Net Sales
Change (%)
EBITDA
EBITDA Margin (%)
Depreciation
EBIT
Interest
Other Income
Extraordinary items
PBT
Tax
Tax Rate (%)
Reported PAT
Adjusted PAT
Change (%)
Min. Int. & Assoc. Share
Adj Cons PAT
2014
2015E
40,298 46,649
19.0
15.8
818
2,939
2.0
6.3
247
296
571
2,643
783
989
153
187
0
0
-60
1,841
-7
608
11.0
33.0
-53
1,234
-53
1,234
-116.2 -2,423.8
0
0
-53
1,234
(INR Million)
2016E
54,243
16.3
4,068
7.5
345
3,723
1,073
244
0
2,894
984
34.0
1,910
1,910
54.8
0
1,910
2017E
62,853
15.9
4,903
7.8
381
4,522
1,173
283
0
3,631
1,235
34.0
2,397
2,397
25.5
0
2,397
Ratios
Y/E March
Basic (INR)
EPS
Cash EPS
Book Value
DPS
Payout (incl. Div. Tax.)
Valuation(x)
P/E
Cash P/E
Price / Book Value
EV/Sales
EV/EBITDA
Dividend Yield (%)
Profitability Ratios (%)
RoE
RoCE
Turnover Ratios (%)
Asset Turnover (x)
Debtors (No. of Days)
Inventory (No. of Days)
Creditors (No. of Days)
Leverage Ratios (%)
Net Debt/Equity (x)
2014
-0.5
1.9
71.0
1.5
-330.5
-539.8
147.4
4.0
0.8
38.6
0.5
-0.7
7.4
3.9
111.6
40.5
50.5
0.5
2015E
12.3
15.3
78.6
4.0
37.9
23.2
18.7
3.6
0.7
10.7
1.4
16.5
26.0
4.3
89.2
43.7
49.9
0.4
2016E
19.1
22.6
90.7
6.0
36.7
15.0
12.7
3.2
0.6
7.7
2.1
22.6
34.1
4.6
89.2
43.0
49.7
0.3
2017E
24.0
27.8
107.7
6.0
29.3
12.0
10.3
2.7
0.5
6.3
2.1
24.2
37.2
4.7
89.2
42.8
49.7
0.3
Balance sheet
Y/E March
Share Capital
Reserves
Net Worth
Debt
Deferred Tax
Total Capital Employed
Gross Fixed Assets
Less: Acc Depreciation
Net Fixed Assets
Capital WIP
Investments
Current Assets
Inventory
Debtors
Cash & Bank
Loans & Adv, Others
Curr Liabs & Provns
Curr. Liabilities
Provisions
Net Current Assets
Total Assets
2014
200
6,896
7,096
3,484
-253
10,327
3,723
1,231
2,492
26
673
23,482
4,467
12,427
544
6,045
16,346
15,421
925
7,136
10,327
2015E
200
7,662
7,862
3,284
-253
10,893
4,623
1,526
3,096
0
673
24,576
5,583
11,502
494
6,997
17,453
16,080
1,373
7,123
10,893
(INR Million)
2016E
2017E
200
200
8,870 10,565
9,070 10,765
3,084
2,884
-253
-253
11,901 13,396
5,123
5,623
1,872
2,252
3,251
3,370
0
0
673
673
28,355 32,868
6,389
7,373
13,375 15,498
455
569
8,136
9,428
20,378 23,515
18,588 21,506
1,791
2,009
7,977
9,352
11,901 13,396
E: MOSL Estimates
Cash flow statement
Y/E March
OP/(Loss) before Tax
Depreciation
Others
Interest
Direct Taxes Paid
(Inc)/Dec in Wkg Cap
CF from Op. Activity
(Inc)/Dec in FA & CWIP
(Pur)/Sale of Invt
Others
CF from Inv. Activity
Inc/(Dec) in Net Worth
Inc / (Dec) in Debt
Interest Paid
Divd Paid (incl Tax)
CF from Fin. Activity
Inc/(Dec) in Cash
Add: Opening Balance
Closing Balance
2014
-60
247
0
728
302
-1,294
-65
-500
-376
111
-765
0
1,813
-688
-234
891
62
483
544
2015E
1,841
296
0
802
608
-37
2,294
-874
0
187
-688
0
-200
-989
-468
-1,656
-50
544
494
(INR Million)
2016E
2,894
345
0
829
984
-892
2,192
-500
0
244
-256
0
-200
-1,073
-702
-1,975
-39
494
455
2017E
3,631
381
0
890
1,235
-1,262
2,406
-500
0
283
-217
0
-200
-1,173
-702
-2,075
114
455
569
31 July 2014
10

Bajaj Electricals
NOTES
31 July 2014
11

Disclosures
This research report has been prepared by MOSt to provide information about the company(ies) and sector(s), if any, covered in the report and may be distributed by it and/or its affiliated company(ies). This
Bajaj Electricals
report is for personal information of the select recipient and does not construe to be any investment, legal or taxation advice to you. This research report does not constitute an offer, invitation or inducement to
invest in securities or other investments and Motilal Oswal Securities Limited (hereinafter referred as MOSt) is not soliciting any action based upon it. This report is not for public distribution and has been
furnished to you solely for your general information and should not be reproduced or redistributed to any other person in any form. This report does not constitute a personal recommendation or take into
account the particular investment objectives, financial situations, or needs of individual clients. Before acting on any advice or recommendation in this material, investors should consider whether it is suitable
for their particular circumstances and, if necessary, seek professional advice. The price and value of the investments referred to in this material and the income from them may go down as well as up, and
investors may realize losses on any investments. Past performance is not a guide for future performance, future returns are not guaranteed and a loss of original capital may occur.
MOSt and its affiliates are a full-service, integrated investment banking, investment management, brokerage and financing group. We and our affiliates have investment banking and other business
relationships with a significant percentage of the companies covered by our Research Department Our research professionals provide important input into our investment banking and other business selection
processes. Investors should assume that MOSt and/or its affiliates are seeking or will seek investment banking or other business from the company or companies that are the subject of this material and that
the research professionals who were involved in preparing this material may participate in the solicitation of such business. The research professionals responsible for the preparation of this document may
interact with trading desk personnel, sales personnel and other parties for the purpose of gathering, applying and interpreting market information. Our research professionals are paid in part based on the
profitability of MOSt which include earnings from investment banking and other business. MOSt generally prohibits its analysts, persons reporting to analysts, and members of their households from
maintaining a financial interest in the securities or derivatives of any companies that the analysts cover. Additionally, MOSt generally prohibits its analysts and persons reporting to analysts from serving as an
officer, director, or advisory board member of any companies that the analysts cover. Our salespeople, traders, and other professionals or affiliates may provide oral or written market commentary or trading
strategies to our clients that reflect opinions that are contrary to the opinions expressed herein, and our proprietary trading and investing businesses may make investment decisions that are inconsistent with
the recommendations expressed herein. In reviewing these materials, you should be aware that any or all o the foregoing, among other things, may give rise to real or potential conflicts of interest . MOSt and
its affiliated company(ies), their directors and employees may; (a) from time to time, have a long or short position in, and buy or sell the securities of the company(ies) mentioned herein or (b) be engaged in
any other transaction involving such securities and earn brokerage or other compensation or act as a market maker in the financial instruments of the company(ies) discussed herein or act as an advisor or
lender/borrower to such company(ies) or may have any other potential conflict of interests with respect to any recommendation and other related information and opinions.
Unauthorized disclosure, use, dissemination or copying (either whole or partial) of this information, is prohibited. The person accessing this information specifically agrees to exempt MOSt or any of its
affiliates or employees from, any and all responsibility/liability arising from such misuse and agrees not to hold MOSt or any of its affiliates or employees responsible for any such misuse and further agrees to
hold MOSt or any of its affiliates or employees free and harmless from all losses, costs, damages, expenses that may be suffered by the person accessing this information due to any errors and delays. The
information contained herein is based on publicly available data or other sources believed to be reliable. Any statements contained in this report attributed to a third party represent MOSt’s interpretation of the
data, information and/or opinions provided by that third party either publicly or through a subscription service, and such use and interpretation have not been reviewed by the third party. This Report is not
intended to be a complete statement or summary of the securities, markets or developments referred to in the document. While we would endeavor to update the information herein on reasonable basis, MOSt
and/or its affiliates are under no obligation to update the information. Also there may be regulatory, compliance, or other reasons that may prevent MOSt and/or its affiliates from doing so. MOSt or any of its
affiliates or employees shall not be in any way responsible and liable for any loss or damage that may arise to any person from any inadvertent error in the information contained in this report. MOSt or any of
its affiliates or employees do not provide, at any time, any express or implied warranty of any kind, regarding any matter pertaining to this report, including without limitation the implied warranties of
merchantability, fitness for a particular purpose, and non-infringement. The recipients of this report should rely on their own investigations.
Recipients who are not institutional investors should seek advice of their independent financial advisor prior to taking any investment decision based on this report or for any necessary explanation of its
contents.
MOSt and/or its affiliates and/or employees may have interests/positions, financial or otherwise in the securities mentioned in this report. To enhance transparency, MOSt has incorporated a Disclosure of
Interest Statement in this document. This should, however, not be treated as endorsement of the views expressed in the report.
Disclosure of Interest Statement
Analyst ownership of the stock
BAJAJ ELECTRICALS LTD
No
Analyst Certification
The views expressed in this research report accurately reflect the personal views of the analyst(s) about the subject securities or issues, and no part of the compensation of the research analyst(s) was, is, or
will be directly or indirectly related to the specific recommendations and views expressed by research analyst(s) in this report. The research analysts, strategists, or research associates principally responsible
for preparation of MOSt research receive compensation based upon various factors, including quality of research, investor client feedback, stock picking, competitive factors and firm revenues.
Regional Disclosures (outside India)
For U.K.
This report is not directed or intended for distribution to or use by any person or entity resident in a state, country or any jurisdiction, where such distribution, publication, availability or use would be contrary to
law, regulation or which would subject MOSt & its group companies to registration or licensing requirements within such jurisdictions.
This report is intended for distribution only to persons having professional experience in matters relating to investments as described in Article 19 of the Financial Services and Markets Act 2000 (Financial
Promotion) Order 2005 (referred to as "investment professionals"). This document must not be acted on or relied on by persons who are not investment professionals. Any investment or investment activity to
which this document relates is only available to investment professionals and will be engaged in only with such persons.
Motilal Oswal Securities Limited (MOSL) is not a registered broker - dealer under the U.S. Securities Exchange Act of 1934, as amended (the"1934 act") and under applicable state laws in the United States.
In addition MOSL is not a registered investment adviser under the U.S. Investment Advisers Act of 1940, as amended (the "Advisers Act" and together with the 1934 Act, the "Acts), and under applicable state
laws in the United States. Accordingly, in the absence of specific exemption under the Acts, any brokerage and investment services provided by MOSL, including the products and services described herein
are not available to or intended for U.S. persons.
This report is intended for distribution only to "Major Institutional Investors" as defined by Rule 15a-6(b)(4) of the Exchange Act and interpretations thereof by SEC (henceforth referred to as "major institutional
investors"). This document must not be acted on or relied on by persons who are not major institutional investors. Any investment or investment activity to which this document relates is only available to major
institutional investors and will be engaged in only with major institutional investors. In reliance on the exemption from registration provided by Rule 15a-6 of the U.S. Securities Exchange Act of 1934, as
amended (the "Exchange Act") and interpretations thereof by the U.S. Securities and Exchange Commission ("SEC") in order to conduct business with Institutional Investors based in the U.S., MOSL has
entered into a chaperoning agreement with a U.S. registered broker-dealer, Motilal Oswal Securities International Private Limited. ("MOSIPL"). Any business interaction pursuant to this report will have to be
executed within the provisions of this chaperoning agreement.
The Research Analysts contributing to the report may not be registered /qualified as research analyst with FINRA. Such research analyst may not be associated persons of the U.S. registered broker-dealer,
MOSIPL, and therefore, may not be subject to NASD rule 2711 and NYSE Rule 472 restrictions on communication with a subject company, public appearances and trading securities held by a research
analyst account.
Motilal Oswal Capital Markets Singapore Pte Limited is acting as an exempt financial advisor under section 23(1)(f) of the Financial Advisers Act(FAA) read with regulation 17(1)(d) of the Financial Advisors
Regulations and is a subsidiary of Motilal Oswal Securities Limited in India. This research is distributed in Singapore by Motilal Oswal Capital Markets Singapore Pte Limited and it is only directed in Singapore
to accredited investors, as defined in the Financial Advisers Regulations and the Securities and Futures Act (Chapter 289), as amended from time to time.
In respect of any matter arising from or in connection with the research you could contact the following representatives of Motilal Oswal Capital Markets Singapore Pte Limited:
Anosh Koppikar
Kadambari Balachandran
Email:anosh.Koppikar@motilaloswal.com
Email : kadambari.balachandran@motilaloswal.com
Contact(+65)68189232
Contact: (+65) 68189233 / 65249115
Office Address:21 (Suite 31),16 Collyer Quay,Singapore 04931
For U.S.
For Singapore
Motilal Oswal Securities Ltd
31 July 2014
Motilal Oswal Tower, Level 9, Sayani Road, Prabhadevi, Mumbai 400 025
Phone: +91 22 3982 5500 E-mail: reports@motilaloswal.com
12