31 July 2014
1QFY15 Results Update | Sector:
Technology
HCL Technologies
BSE SENSEX
25,895
Bloomberg
S&P CNX
7,721
HCLT IN
CMP: INR1,555
TP: INR1,750
Buy
Equity Shares (m)
700.1
M.Cap. (INR b) / (USD 1,129.0/18.8
b)
52-Week Range (INR)
1,624/838
1, 6, 12 Rel. Per (%)
2/-20/32
Financials & Valuation (INR Billion)
Y/E June
Sales
EBITDA
PAT
EPS (INR)
EPS Gr. (%)
BV/Sh.(INR)
RoE (%)
RoCE (%)
P/E (x)
EV/EBITDA
2015E 2016E 2017E
363.2
91.4
71.5
100.5
11.5
370.1
35.6
30.2
15.5
10.4
412.7
101.4
81.7
114.1
13.5
458.2
31.4
27.6
13.6
8.9
461.7
109.1
88.8
123.8
8.5
556.1
27.5
24.6
12.6
7.7
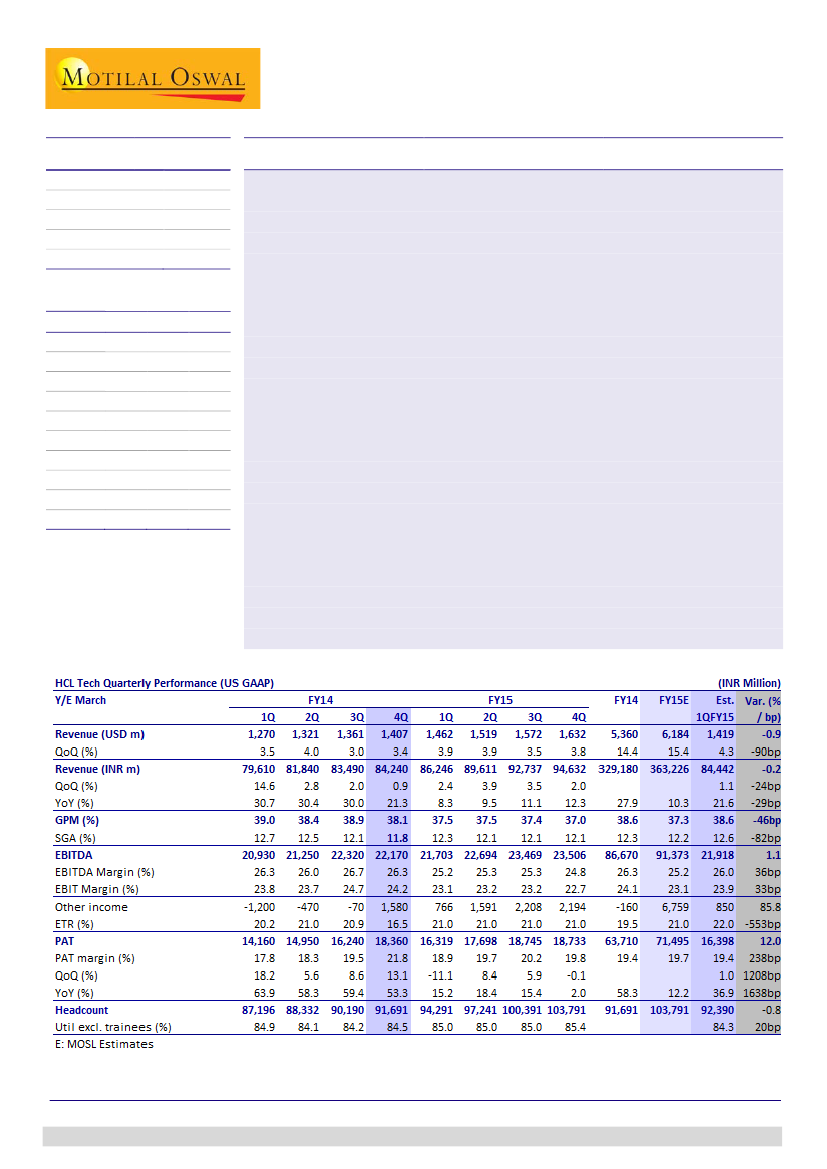
Revenue below estimate on lower IMS growth:
HCL Tech’s 4QFY14 USD revenues
grew 3.4% QoQ to USD1,407m (marginally below estimate of 4.3% QoQ growth to
USD1,419m). In constant currency, revenue grew 2.8% QoQ, v/s estimate of 3.8%
QoQ. EBITDA margin was 26.3%, -40bp QoQ (in line with estimate of 26%, -70bp
QoQ) – as lower gross margin (38.1% v/s estimate of 38.6%) was offset by SGA (at
11.8% v/s estimate of 12.6%). PAT at INR18.34b grew 13.1% QoQ, above estimate
of INR16.4b, +1% QoQ), due to lower tax rate of 16.5%, v/s estimate of 22%, and
also higher other income (INR1.6b including forex loss, v/s estimate of INR0.85b).
Healthy growth in deal signings YoY:
HCLT has signed 50+ transformational
engagements totaling over USD 5b in TCV in FY14. This compares with USD3b+ in
FY13, lending healthy visibility on revenue growth acceleration.
Peers catch up on IMS growth, expect Software Services growth to improve:
Acceleration at peers and deceleration at HCLT in IMS have meant that the growth
rates are now similar (QE June 2014 YoY – TCS: +24%, INFO: +21%, HCLT: +26%).
However, HCLT guided for software services growth to get stronger in FY15
facilitated by ramp ups in the deals won during the year.
Growth visibility intact, Maintain BUY:
We retain our estimates post the results,
and expect HCLT to accelerate growth on the back of continued traction in deal
wins. While the profitability for the company may cool off going forward, our
FY16E EBIT margin estimate of 22.4% is 170bp lower than FY14, building cushion
for multiple headwinds. We expect HCLT to grow its USD revenues at a CAGR of
15% over FY14-16E and EPS at a CAGR of 13% during this period. Our target price
of INR1,750 discounts FY16E by 15x. Buy.
Ashish Chopra
(Ashish.Chopra@MotilalOswal.com); +91 22 3982 5424
Siddharth Vora
(Siddharth.Vora@MotilalOswal.com); +91 22 3982 5585
Investors are advised to refer through disclosures made at the end of the Research Report.

HCL Technologies
4QFY14: Revenue below estimate on lower IMS growth
HCL Tech’s 3QFY14 USD revenues grew 3.4% QoQ to USD 1,407m below our
estimate of USD1,419m; 4.3% QoQ. In CC terms revenue grew 2.8% QoQ v/s our
estimate of 3.8% QoQ.
Revenues in software services grew to USD850m, +2.2%% (v/s estimate of 3.0%
QoQ growth to USD857m). This was third consecutive quarter of 2%+ sequential
growth in Software Services.
IMS grew 3.7% QoQ to USD485m (v/s estimate of +6.6% QoQ growth to
USD499m). Growth in IMS decelerated for the third consecutive quarter.
BPO business was up 17.7% QoQ to USD72m (v/s estimate of 2.6% QoQ growth
to USD62.3m)
Growth in BPO was a surprise while IMS was below estimate
Revenues grew 3.4% below our estimate of 4.3%
Source: Company, MOSL
EBITDA margin was 26.3%, -40bp QoQ (v/s estimate of 26%, -70bp QoQ). This
was primarily due to SGA at 11.8%, -30bp QoQ (v/s our estimate of 12.6%,
+50bp QoQ). Gross margin was 38.1% (-80bp QoQ), below our estimate of
38.6%
Highest quarterly gross addition since 1QFY12
Reduction in SG&A continue to help margin in 26% range
Source: Company, MOSL
PAT was INR18.34b, +13.1% QoQ, above our estimate of INR16.4b. PAT beat was on
account of lower tax rate of 16.5%, v/s our estimate of 22%, and also lower forex
loss of INR530m v/s estimated loss of INR751m.
31 July 2014
2

HCL Technologies
Segment-wise performance: BFSI, Telecom/Media, Europe and BPO drive
growth
Growth was the highest in BPO during the quarter at 17.7% QoQ and 16.8% in
CC terms. While IMS continued to grow at a healthy rate it was not the
dominating growth driver, it has now seen a growth deceleration for the third
consecutive quarter. It grew at 3.7% QoQ and 3.1% in CC terms.
BPO supported growth on lower than expected IMS performance
Services
EAS
Engg and R&D Services
ADM
IMS
BPO
Contr. to
rev. (%)
16.8
27.4
16.2
34.5
5.1
QoQ
Gr. (%)
0.5
3.8
2.2
3.7
17.7
4 Qtr
Contr. to
Incr. rev. (%)
CQGR (%)
2.4
2.0
17.6
1.8
17.8
1.8
36.8
5.9
22.8
7.9
Source: Company, MOSL
Among verticals, growth was driven by Financial Services (+8.2% QoQ CC),
Telecom Media Publishing & Entertainment (+9.5% QoQ CC) and Retail & CPG
(+2.4% QoQ CC). 4-quarter CQGR across verticals shows that the key
contributors to the company’s growth are Public Services, Financial Services and
Retail & CPG.
BFSI and Media were the best performing verticals during the quarter
Verticals
Financial Services
Manufacturing
Retail & CPG
Telecom MP&E
Life Sciences & Healthcare
Public Services
Others
Contr. to rev. (%)
28.4
31.6
8.5
8.9
10.2
10.1
2.3
QoQ Gr. (%)
9.3
(2.1)
2.9
9.5
1.4
2.8
2.1
Contr to inc
4 Qtr CQGR
rev. (%)
(%)
74.4
6.5
(20.9)
2.6
8.5
3.2
23.8
0.2
4.2
0.9
8.5
9.7
1.4
(9.9)
Source: Company, MOSL
Among geographies, Europe grew fastest (+6.5% QoQ CC), followed by Americas
(+1.3% QoQ CC). Europe continues to be key growth driver in the recent
quarters, with 4-quarter CQGR of 5.6%.
Europe dominated growth among geographies
Geographies
US
Europe
ROW
Contr. to rev. (%)
54.3
33.0
12.7
QoQ Gr. (%)
1.3
7.4
2.2
Contr to inc
4 Qtr CQGR
rev. (%)
(%)
21.5
2.3
70.3
5.6
8.2
3.4
Source: Company, MOSL
31 July 2014
3

HCL Technologies
Growth Comparison Matrix
HCLT
Geography
North America
Europe
ROW
Industry
BFSI
Manufacturing
Retail
Energy and Utilities
Services
Custom application
IMS
BPO
EAS / Pkg Implementation / Consulting
Engineering Services
9.3
-2.1
2.9
2.8
2.2
3.7
17.7
0.5
3.8
0.7
2.3
-2.3
0.1
-4.7
5.0
2.8
-
-
2.5
5.5
7.8
8.2
4.9
10.7
3.7
6.8
-1.1
1.8
2.6
2.1
1.6
0.8
11.9
-1.7
1.3
2.0
1.3
7.4
2.5
WPRO
0.8
-0.3
4.2
TCS
5.5
4.8
6.6
INFY
3.7
-0.9
-0.1
Source: Company, MOSL
Peer group has caught up with HCLT on IMS growth (ex-WPRO)
Acceleration at peers and deceleration at HCLT in IMS have meant that the
growth rates are now similar. While for HCLT the rates are cooling off, larger
peers are catching up in growth (ex-Wipro) and are at a similar scale (ex-
Infosys).
HCLT’s growth at bread-n-butter software services business (~60% of revenues)
has remained in single digits YoY in the last 8 quarters, though improving every
quarter since the last four. The company expects this to pick up significantly, as
the deal wins in Application Services ramp up gradually through FY15.
While growth has picked up across peers, Wipro and TCS have comparable size as well
Source: Company, MOSL
Deal signings a positive
A key positive in the HCL Tech’s disclosures is the intact visibility on revenue
growth - signed 50+ transformational engagements with more than USD 5b in
TCV in FY14. Had announced deals of more than USD3b in FY13. We expect USD
revenue growth to accelerate in FY15 on the back of the same.
31 July 2014
4

HCL Technologies
Deal signings give higher growth visibility
Source: MOSL, Company
Takeaways from Management Commentary
IMS growth outlook:
While growth in IMS has relatively dropped in recent
quarters, HCLT remains confident of significant revenue growth in the segment.
Encouragingly, HCLT is being invited for more and more complex and larger
sized deals, and cited 3 very large deals it won in FY14. Pipeline is very strong in
both re-bid markets as well as first-time outsourcing in regions like ANZ. There
has been a marginal increase by ISG in the re-bid market, which is now up to
USD56-58b. 40% of that is addressable market for HCLT.
Software Services outlook:
HCLT has won a number of large deals in Application
Services. The steady state revenues will be reflected in quarters to come. Core
software services should trickle in significant growth for the company in FY15.
To invest in building capabilities:
5 umbrella themes of HCL Tech, viz.
Enterprise of Future, Engineering outsourcing, ALT ASM, Enterprise Function as
a Service and Digital System are all gaining traction in the marketplace.
However, each offering is at different stage of adoption and these will see
increased investments going forward towards capabilities building.
Deal signings:
The mega deals won in 1HCY14 are both USD300m+. Both involve
complex transformation and then continue into ongoing operations. The margin
profile is very similar to current profile. However, in the mega deals, the ramp
ups are slower than the normal 6-8 months period.
Intact visibility on growth, Maintain buy
We retain our revenue estimates post the results, and expect HCLT to accelerate
growth on the back of continued traction in deal wins. We model 23.1% EBIT
margin for FY15 and 22.4% for FY16, which compare with 24.1% in FY14, due to
our assumed currency rates of INR58.7in FY15 and INR58 in FY16 (compared to
INR61.4 in FY14).
Continued closure of orders keeps prospects of revenue growth at HCLT
sanguine. While the profitability for the company may cool off going forward,
execution towards extracting efficiencies has been continued to drive
outperformance to sustain healthy profitability. Secondly, with greater
proportion of locals at onsite, the sensitivity of margins to currency has come
down too, reducing the risk to margins in the event of INR appreciation. Our
FY16E EBIT margin estimate of 22.4% is 170bp lower than that in FY14, building
enough cushion for factors like wage hikes and appreciation in INR. We expect
5
31 July 2014

HCL Technologies
HCLT to grow its USD revenues at a CAGR of 15% over FY14-16E and EPS at a
CAGR of 13% during this period. Our target price of INR1,750 discounts FY16E by
15x. Maintain
Buy.
Narrowing of growth delta to peers amid increasing
competitive intensity in IMS is a key risk to our thesis.
Change in estimates
Revised
FY15E
FY16E
58.7
58.0
6,184
7,115
15.4%
15.1%
23.1%
22.4%
100.5
114.1
11.5%
13.5%
Earlier
FY15E
FY16E
58.7
57.9
6,192
7,121
15.3%
15.0%
22.9%
22.1%
99.6
111.7
14.1%
12.2%
Change
FY15E
FY16E
0.0%
0.2%
-0.1%
-0.1%
11bp
5bp
15bp
30bp
0.9%
2.2%
Source: Company, MOSL
INR/USD
USD Revenue - m
USD revenue growth
EBIT Margin
EPS - INR
EPS Growth
Other result highlights
Overall headcount increased by 1,501 employees during the quarter to 91,691
employees. Gross additions during the quarter of 8,442.
Blended utilization for the quarter was 84.5%, +30bp QoQ.
The company signed deals in excess of USD5bn in TCV in FY14. Company had
signed more than USD1b of deal TCV in prior three quarters.
Attrition rate in IT Services was 16.9%, v/s 16.9% in 3QFY14.
Billed receivables increased to 60 days (v/s 58 in 3QFY14).
Revenue proportion from Fixed Price contracts increased 80bp QoQ to 56.5%.
Total hedges amount to USD1.15b, USD825m of which is cash flow hedges and
USD325m are Balance Sheet hedges. The hedges are at an average rate of
INR62.61.
31 July 2014
6

HCL Technologies
Story in Charts
ISG upgraded the opportunity in the churn markets…
… HCLT continues to reap its benefits through deal wins…
Source: Company, MOSL
..reflected in IMS being a key growth driver for HCLT
Uptick in software services growth improves the growth mix
Source: Company, MOSL
Growth and scale have driven Continued OPM surprise...
…and 4 consecutive year of spectacular PAT growth
th
Source: Company, MOSL
31 July 2014
7

HCL Technologies
Operating Metrics
1QFY13
Service Line wise (%)
Enterprise application services
Engineering and R&D Services
Custom Application
Infrastructure Services
BPO Services
Vertical wise (%)
BFSI
Manufacturing
Retail & CPG
Telecom MP&E
Life Sciences
Public Services
Others
Geography wise (%)
US
Europe
ROW
Client wise (%)
Top 5 clients
Top 10 clients
Top 20 clients
QoQ Growth (%)
Service Line wise
Enterprise application services
Engineering and R&D Services
Custom Application
Infrastructure Services
BPO Services
Vertical wise
BFSI
Manufacturing
Retail & CPG
Telecom MP&E
Life Sciences
Public Services
Others
Geography wise
US
Europe
ROW
Client wise
Top 5 clients
Top 10 clients
Top 20 clients
19.9
18.1
31.0
26.6
4.5
24.1
31.6
9.2
10.4
12.0
6.9
5.8
57.0
27.9
15.1
16.2
24.5
33.6
2QFY13
19.0
17.6
30.6
28.4
4.4
25.8
31.0
9.0
10.3
11.9
7.0
4.8
56.9
28.5
14.6
15.7
24.2
33.3
3QFY13
19.0
17.1
29.7
29.9
4.3
25.0
28.4
8.9
6.7
11.3
7.7
4.8
57.1
28.9
14.0
15.4
24.0
32.8
4QFY13
17.3
17.3
29.2
31.5
4.3
25.3
32.7
8.6
10.1
11.3
8.0
4.0
57.0
30.5
12.5
15.4
23.8
33.0
1QFY14
17.3
16.9
28.4
33.1
4.3
26.0
33.3
8.3
9.1
11.6
7.8
3.9
57.2
30.2
12.6
15.1
23.8
33.2
2QFY14
17.1
16.6
28.0
33.7
4.6
25.9
33.6
8.6
8.9
10.8
9.2
3.1
56.9
31.3
11.8
14.8
23.8
33.6
3QFY14
17.2
16.1
27.7
34.4
4.5
26.9
33.3
8.5
8.4
10.4
10.1
2.3
55.4
31.8
12.8
15.0
24.1
34.2
4QFY14
16.8
16.2
27.4
34.5
5.1
28.4
31.6
8.5
8.9
10.2
10.1
2.3
54.3
33.0
12.7
14.7
23.7
33.7
-1.3
0.4
2.2
10.7
5.5
4.5
14.8
10.4
60.1
14.6
-1.1
-6.5
3.9
2.8
1.2
1.9
2.3
1.7
-1.1
0.8
2.3
10.6
1.3
10.9
1.7
1.4
2.6
2.8
5.1
-14.2
3.5
5.9
0.2
0.4
2.4
2.7
3.2
0.2
0.1
8.6
0.8
0.0
-5.5
2.0
-32.9
-2.0
13.5
3.2
3.5
4.6
-1.1
1.2
2.3
1.6
-6.1
4.3
1.4
8.6
3.1
4.3
18.7
-0.4
55.4
3.1
7.1
-14.1
2.9
8.8
-8.0
3.1
2.2
3.7
1.2
1.4
0.6
8.7
1.9
6.2
5.6
-0.7
-6.4
6.8
1.5
-2.6
4.0
2.6
3.2
1.5
3.5
4.1
2.5
2.1
2.4
6.0
13.7
3.8
5.0
7.5
1.2
-3.8
21.8
-16.9
3.4
7.8
-2.3
1.9
4.0
5.3
4.0
0.1
2.2
5.1
-0.7
6.8
2.0
2.8
-2.6
-0.7
13.9
-20.4
0.4
4.8
11.0
0.5
3.8
2.2
3.7
17.7
9.3
-2.1
2.9
9.5
1.4
2.8
2.1
1.3
7.4
2.2
4.4
1.3
4.3
1.6
4.9
1.8
Source: Company, MOSL
31 July 2014
8

HCL Technologies
HCL Technologies: an investment profile
Company description
HCL Technologies is one of the largest IT services
companies in India, employing over 91,000 people. It is
a leader in remote infrastructure management,
engineering and R&D services and has sizeable BPO,
Enterprise Solutions and ADM practices.
Recent developments
HCLT signed 50+ transformational engagements with
more than USD5b of TCV in FY14.
HCLT was selected by Norway’s leading financial
services institution for IT infrastructure Services and
Application Operations for its non-mainframe
platforms and end user services.
Key investment arguments
Healthy strike rate in large deal wins have
ascertained the company’s prowess in the RTB
space.
Fastest growth trajectory in the infrastructure
management space, the strongest growth segment
for Indian IT.
A comprehensive IT services company with a wide
portfolio of services including R&D, Enterprise, BPO,
Infrastructure Management
and Enterprise
Application services.
Valuation and view
We expect USD revenues to grow at a CAGR of 15.2%
over FY14-16 and EPS CAGR to be 12.5%.
The stock trades at 15.5x FY15E and 13.6x FY16E EPS.
Maintain
Buy,
with a target price of INR1,750, which
discounts our FY16E EPS by 15x.
Sector view
Key investment risks
Risk-pricing in FPP contracts could go wrong.
Slower than anticipated ramp-up in large deals
leading to moderation in revenue growth.
Appreciation of the rupee and cross currency
movements could hamper profitability.
With strengthening demand in the US and large deals
traction in traditional services in Europe, industry
growth in FY15 should be better than FY14.
Digital technologies/SMAC may not be a needle mover
right now but are increasingly seeing traction and can
potentially drive downstream opportunity.
We see better risk-reward in Tier-I v/s Tier-II.
Currency is a key risk to valuations, and Tier-II has a
higher sensitivity to the same v/s Tier-I
Comparative valuations
P/E (x)
P/BV (x)
EV/Sales (x)
EV/EBITDA (x)
FY15E
FY16E
FY15E
FY16E
FY15E
FY16E
FY15E
FY16E
HCLT
15.5
13.6
4.2
3.4
3.0
2.6
10.4
8.9
TCS
23.3
20.2
7.2
5.9
5.9
5.0
17.1
14.8
WPRO
15.5
13.8
3.3
2.8
2.8
2.5
10.8
9.4
EPS: MOSL forecast v/s consensus (INR)
MOSL
Forecast
100.5
114.1
Consensus
Forecast
99.2
111.3
Variation
(%)
1.3
2.6
FY14
FY15
Target price and recommendation
Current
Price (INR)
1,550
Target
Price (INR)
1,750
Upside
(%)
12.5
Reco
Buy
Shareholding pattern (%)
Jun-14
Promoter
DII
FII
Others
61.7
3.7
28.9
5.8
Mar-14
61.7
3.7
28.6
6.0
Jun-13
61.9
6.5
24.5
7.1
Stock performance (1-year)
Notes: FII includes depository receipts
31 July 2014
9

HCL Technologies
Financials and valuation
Income Statement
Y/E June
Sales
Cha nge (%)
Cos t of Goods Sol d
Gross Profit
Sel l i ng & Admi n Exp.
EBITDA
% of Net Sa l es
Depreci a ti on
EBIT
Forex Ga i n
Other Income
PBT
Ta x
Ra te (%)
PAT
Net Income
Cha nge (%)
(INR Million)
2014
2015E
2016E
2017E
329,180 363,226 412,673 461,734
27.9
10.3
13.6
11.9
202,160 227,660 262,894 299,565
127,020 135,566 149,780 162,169
40,350 44,193 48,349 53,043
86,670 91,373 101,431 109,126
26.3
25.2
24.6
23.6
7,320
7,632
8,866
9,920
79,350 83,741 92,565 99,206
-5,890
-734
2,769
2,281
5,730
7,493
8,118 10,919
79,190 90,500 103,451 112,406
15,480 19,005 21,725 23,605
19.5
21.0
21.0
21.0
63,710
63,710
58.3
71,495
71,495
12.2
81,727
81,727
14.3
88,801
88,801
8.7
Ratios
Y/E June
Diluted (INR)
EPS after ESOP chg
Ca s h EPS
Book Va l ue
DPS
Pa yout %
Valuation (x)
P/E a fter ESOP chg
Ca s h P/E
EV/EBITDA
EV/Sa l es
Pri ce/Book Va l ue
Di vi dend Yi el d (%)
Profitability Ratios (%)
RoE
RoCE
Turnover Ratios
Debtors (Da ys )
As s et Turnover (x)
Leverage Ratio
Debt/Equi ty (x)
2014
90.2
100.5
287.6
22.0
24.4
2015E
100.5
111.2
370.1
16.6
16.5
2016E
114.1
126.5
458.2
24.2
21.2
2017E
123.8
137.6
556.1
24.3
19.6
17.2
15.5
11.5
3.0
5.4
1.4
15.5
14.0
10.4
2.6
4.2
1.1
13.6
12.3
8.9
2.2
3.4
1.6
12.6
11.3
7.7
1.8
2.8
1.6
42.4
35.6
35.6
30.2
31.4
27.6
27.5
24.6
Balance Sheet
Y/E June
Sha re Ca pi ta l
Other Res erves
Net Worth
Loa ns
Capital Employed
Gros s Bl ock
Les s : Depreci a ti on
Net Block
Inta ngi bl es
Inves tments
Curr. Assets
Debtors
Ca s h & Ba nk Ba l a nce
Loa ns & Adva nces
Current Liab. & Prov
Current Li a bi l i ti es
Provi s i ons
Net Current Assets
Application of Funds
E: MOSL Es ti ma tes
(INR Million)
2014
2015E
2016E
2017E
1,396
1,398
1,400
1,401
199,418 257,365 319,299 388,196
200,814 258,764 320,698 389,597
7,509
6,329
6,329
6,329
208,323 265,093 327,027 395,926
78,595 92,695 97,750 101,509
47,130 54,762 54,762 54,762
31,465 37,933 42,988 46,747
74,954 77,848 81,746 85,114
89,948 89,948 89,948 89,948
108,537 162,833 230,334 307,198
77,086 85,059 96,638 108,127
10,206 53,908 106,301 168,626
21,245 23,866 27,395 30,445
96,581 103,469 117,989 133,082
81,966 87,051 99,143 112,138
14,615 16,418 18,846 20,944
11,956 59,363 112,346 174,116
208,323 265,093 327,027 395,926
77
11.2
81
10.5
80
10.2
81
10.3
0.0
0.0
0.0
0.0
Cash Flow Statement
Y/E June
CF from Opera ti ons
Chg. i n Worki ng Ca pi ta l
Net Operating CF
Net Purcha s e of FA
Net Purcha s e of Inves t.
Net Cash from Inv.
Is s ue of s ha res /other a dj
Proceeds from LTB/STB
Di vi dend Pa yments
Net CF from Finan.
Free Ca s h Fl ow
Net Cash Flow
Opening Cash Balance
Closing CashBalance
E: MOSL Es ti ma tes
2014
71,030
-1,486
69,544
-14,410
-46,957
-61,367
12,155
549
-17,995
-5,292
55,134
2,885
7,322
10,207
2015E
79,127
-3,705
75,422
-16,994
0
-16,994
11
-1,180
-13,556
-14,725
58,427
43,702
(INR Million)
2016E
90,592
-589
90,003
-17,818
0
-17,818
25
0
-19,816
-19,792
72,185
52,394
2017E
98,721
554
99,275
-17,049
0
-17,049
19
0
-19,921
-19,901
82,226
62,325
10,207 53,909 106,303
53,909 106,303 168,628
31 July 2014
10

HCL Technologies
NOTES
31 July 2014
11

Disclosures
This research report has been prepared by MOSt to provide information about the company(ies) and sector(s), if any, covered in the report and may be distributed by it and/or its affiliated company(ies). This
HCL Technologies
report is for personal information of the select recipient and does not construe to be any investment, legal or taxation advice to you. This research report does not constitute an offer, invitation or inducement to
invest in securities or other investments and Motilal Oswal Securities Limited (hereinafter referred as MOSt) is not soliciting any action based upon it. This report is not for public distribution and has been
furnished to you solely for your general information and should not be reproduced or redistributed to any other person in any form. This report does not constitute a personal recommendation or take into
account the particular investment objectives, financial situations, or needs of individual clients. Before acting on any advice or recommendation in this material, investors should consider whether it is suitable
for their particular circumstances and, if necessary, seek professional advice. The price and value of the investments referred to in this material and the income from them may go down as well as up, and
investors may realize losses on any investments. Past performance is not a guide for future performance, future returns are not guaranteed and a loss of original capital may occur.
MOSt and its affiliates are a full-service, integrated investment banking, investment management, brokerage and financing group. We and our affiliates have investment banking and other business
relationships with a significant percentage of the companies covered by our Research Department Our research professionals provide important input into our investment banking and other business selection
processes. Investors should assume that MOSt and/or its affiliates are seeking or will seek investment banking or other business from the company or companies that are the subject of this material and that
the research professionals who were involved in preparing this material may participate in the solicitation of such business. The research professionals responsible for the preparation of this document may
interact with trading desk personnel, sales personnel and other parties for the purpose of gathering, applying and interpreting market information. Our research professionals are paid in part based on the
profitability of MOSt which include earnings from investment banking and other business. MOSt generally prohibits its analysts, persons reporting to analysts, and members of their households from
maintaining a financial interest in the securities or derivatives of any companies that the analysts cover. Additionally, MOSt generally prohibits its analysts and persons reporting to analysts from serving as an
officer, director, or advisory board member of any companies that the analysts cover. Our salespeople, traders, and other professionals or affiliates may provide oral or written market commentary or trading
strategies to our clients that reflect opinions that are contrary to the opinions expressed herein, and our proprietary trading and investing businesses may make investment decisions that are inconsistent with
the recommendations expressed herein. In reviewing these materials, you should be aware that any or all o the foregoing, among other things, may give rise to real or potential conflicts of interest . MOSt and
its affiliated company(ies), their directors and employees may; (a) from time to time, have a long or short position in, and buy or sell the securities of the company(ies) mentioned herein or (b) be engaged in
any other transaction involving such securities and earn brokerage or other compensation or act as a market maker in the financial instruments of the company(ies) discussed herein or act as an advisor or
lender/borrower to such company(ies) or may have any other potential conflict of interests with respect to any recommendation and other related information and opinions.
Unauthorized disclosure, use, dissemination or copying (either whole or partial) of this information, is prohibited. The person accessing this information specifically agrees to exempt MOSt or any of its
affiliates or employees from, any and all responsibility/liability arising from such misuse and agrees not to hold MOSt or any of its affiliates or employees responsible for any such misuse and further agrees to
hold MOSt or any of its affiliates or employees free and harmless from all losses, costs, damages, expenses that may be suffered by the person accessing this information due to any errors and delays. The
information contained herein is based on publicly available data or other sources believed to be reliable. Any statements contained in this report attributed to a third party represent MOSt’s interpretation of the
data, information and/or opinions provided by that third party either publicly or through a subscription service, and such use and interpretation have not been reviewed by the third party. This Report is not
intended to be a complete statement or summary of the securities, markets or developments referred to in the document. While we would endeavor to update the information herein on reasonable basis, MOSt
and/or its affiliates are under no obligation to update the information. Also there may be regulatory, compliance, or other reasons that may prevent MOSt and/or its affiliates from doing so. MOSt or any of its
affiliates or employees shall not be in any way responsible and liable for any loss or damage that may arise to any person from any inadvertent error in the information contained in this report. MOSt or any of
its affiliates or employees do not provide, at any time, any express or implied warranty of any kind, regarding any matter pertaining to this report, including without limitation the implied warranties of
merchantability, fitness for a particular purpose, and non-infringement. The recipients of this report should rely on their own investigations.
Recipients who are not institutional investors should seek advice of their independent financial advisor prior to taking any investment decision based on this report or for any necessary explanation of its
contents.
MOSt and/or its affiliates and/or employees may have interests/positions, financial or otherwise in the securities mentioned in this report. To enhance transparency, MOSt has incorporated a Disclosure of
Interest Statement in this document. This should, however, not be treated as endorsement of the views expressed in the report.
Disclosure of Interest Statement
Analyst ownership of the stock
HCL TECHNOLOGIES LTD
No
Analyst Certification
The views expressed in this research report accurately reflect the personal views of the analyst(s) about the subject securities or issues, and no part of the compensation of the research analyst(s) was, is, or
will be directly or indirectly related to the specific recommendations and views expressed by research analyst(s) in this report. The research analysts, strategists, or research associates principally responsible
for preparation of MOSt research receive compensation based upon various factors, including quality of research, investor client feedback, stock picking, competitive factors and firm revenues.
Regional Disclosures (outside India)
For U.K.
This report is not directed or intended for distribution to or use by any person or entity resident in a state, country or any jurisdiction, where such distribution, publication, availability or use would be contrary to
law, regulation or which would subject MOSt & its group companies to registration or licensing requirements within such jurisdictions.
This report is intended for distribution only to persons having professional experience in matters relating to investments as described in Article 19 of the Financial Services and Markets Act 2000 (Financial
Promotion) Order 2005 (referred to as "investment professionals"). This document must not be acted on or relied on by persons who are not investment professionals. Any investment or investment activity to
which this document relates is only available to investment professionals and will be engaged in only with such persons.
Motilal Oswal Securities Limited (MOSL) is not a registered broker - dealer under the U.S. Securities Exchange Act of 1934, as amended (the"1934 act") and under applicable state laws in the United States.
In addition MOSL is not a registered investment adviser under the U.S. Investment Advisers Act of 1940, as amended (the "Advisers Act" and together with the 1934 Act, the "Acts), and under applicable state
laws in the United States. Accordingly, in the absence of specific exemption under the Acts, any brokerage and investment services provided by MOSL, including the products and services described herein
are not available to or intended for U.S. persons.
This report is intended for distribution only to "Major Institutional Investors" as defined by Rule 15a-6(b)(4) of the Exchange Act and interpretations thereof by SEC (henceforth referred to as "major institutional
investors"). This document must not be acted on or relied on by persons who are not major institutional investors. Any investment or investment activity to which this document relates is only available to major
institutional investors and will be engaged in only with major institutional investors. In reliance on the exemption from registration provided by Rule 15a-6 of the U.S. Securities Exchange Act of 1934, as
amended (the "Exchange Act") and interpretations thereof by the U.S. Securities and Exchange Commission ("SEC") in order to conduct business with Institutional Investors based in the U.S., MOSL has
entered into a chaperoning agreement with a U.S. registered broker-dealer, Motilal Oswal Securities International Private Limited. ("MOSIPL"). Any business interaction pursuant to this report will have to be
executed within the provisions of this chaperoning agreement.
The Research Analysts contributing to the report may not be registered /qualified as research analyst with FINRA. Such research analyst may not be associated persons of the U.S. registered broker-dealer,
MOSIPL, and therefore, may not be subject to NASD rule 2711 and NYSE Rule 472 restrictions on communication with a subject company, public appearances and trading securities held by a research
analyst account.
Motilal Oswal Capital Markets Singapore Pte Limited is acting as an exempt financial advisor under section 23(1)(f) of the Financial Advisers Act(FAA) read with regulation 17(1)(d) of the Financial Advisors
Regulations and is a subsidiary of Motilal Oswal Securities Limited in India. This research is distributed in Singapore by Motilal Oswal Capital Markets Singapore Pte Limited and it is only directed in Singapore
to accredited investors, as defined in the Financial Advisers Regulations and the Securities and Futures Act (Chapter 289), as amended from time to time.
In respect of any matter arising from or in connection with the research you could contact the following representatives of Motilal Oswal Capital Markets Singapore Pte Limited:
Anosh Koppikar
Kadambari Balachandran
Email:anosh.Koppikar@motilaloswal.com
Email : kadambari.balachandran@motilaloswal.com
Contact(+65)68189232
Contact: (+65) 68189233 / 65249115
Office Address:21 (Suite 31),16 Collyer Quay,Singapore 04931
For U.S.
For Singapore
Motilal Oswal Securities Ltd
31 July 2014
Motilal Oswal Tower, Level 9, Sayani Road, Prabhadevi, Mumbai 400 025
Phone: +91 22 3982 5500 E-mail: reports@motilaloswal.com
12