7 August 2014
Update | Sector: Healthcare
Ipca Laboratories
BSE Sensex
25,589
S&P CNX
7,649
CMP: INR725
TP: INR916
Buy
US FDA issue a small bump in a structural story
Remediation measures underway; risk-reward favorable
Stock Info
Bloomberg
Equity Shares (m)
52-Week Range (INR)
1, 6, 12 Rel. Per (%)
M.Cap. (INR b)
M.Cap. (USD b)
IPCA IN
126.2
907/609
-18/-36/-26
105.6
1.8
Remediation measures are already underway, with resolution expected in six
months. IPCA is confident of regaining lost market share in the US on resumption.
The long-term story is intact. The management targets INR100b sales by 2020
with EBITDA margin expanding to 28%.
Analysis of three scenarios makes us believe that risk-reward is favorable.
Remediation already underway; expect resolution in six months
Financial Snapshot (INR Million)
2015E 2016E 2017E
Y/E March
Net Sales
35,818 41,818 50,889
EBITDA
Adj PAT
EPS (INR)
Growth (%)
BV/Sh. (INR)
RoE (%)
RoCE (%)
P/E (x)
P/BV (x)
8,122 9,657 12,250
4,996 5,953 7,707
39.6
4
189
23.0
26.2
18.3
3.8
47.2
19
229
22.6
26.4
15.4
3.2
61.1
29
281
24.0
28.5
11.9
2.6
In our recent interaction with the CMD, Mr Prem Godha, and other senior
management personnel, we discussed IPCA’s action plan to get US supplies on
track. IPCA was already on course to automate its process and activities to
reduce human intervention. Since remediation measures are already underway,
the management expects a resolution in six months, based on its consultant’s
feedback. We believe IPCA is the only company to have voluntarily discontinued
production to this extent after receiving a form 483 from the US FDA and hence
drawing an analogy from US FDA actions for the industry players in the past
may not be prudent.
IPCA confident of regaining lost market share in US on resumption
Of the USD34m formulations sales in the US, ~75% are from three products
where IPCA has significant market share. There are five products where IPCA’s
partners hold majority market share. These are high volume products where
competition might find it difficult to match IPCA’s scale. IPCA remains confident
of regaining lost market share on resumption of supplies in the US.
Shareholding pattern % (Jun-14)
Jun-14 Mar-14 Jun-13
Promoter 45.9
45.9
45.9
DII
FII
Others
11.0
25.3
17.9
11.5
25.3
17.4
13.5
23.0
17.7
Aims to touch INR100b sales by 2020; EBITDA margin up to 28%
Mr Godha’s aim is to touch INR100b in sales by 2020, with scope to improve
EBITDA margin towards 28% (~23% in FY15E). IPCA’s philosophy would continue
to be to target mature products where it could enter with significant cost
competitiveness. Revenue growth would be driven by India, which is expected
to grow 3-4% ahead of the overall market, while emerging markets could
maintain high growth on a low base. API sales are likely to moderate.
Notes: FII includes depository receipts
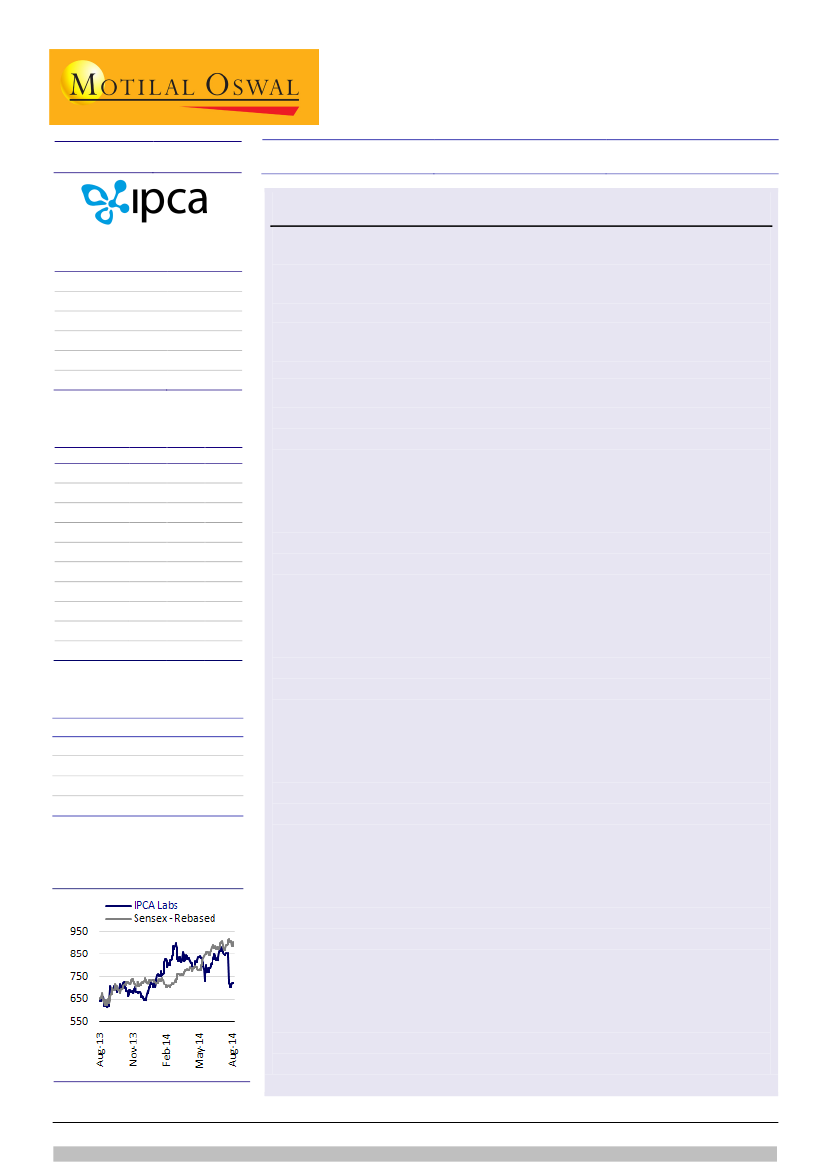
Stock Performance (1-year)
Post scenario analysis, we believe risk-reward is favorable
IPCA has had a great execution track record. In our view, it is undergoing a
temporary disruption in its growth story. We maintain our Buy rating. We have
analyzed three scenarios that could unfold over FY15E-17, based on which we
see a potential upside of 30% in the next 18 months. However, if a warning
letter/import alert takes more than two years to resolve, there could be a
downside risk of 15%. We believe risk-reward is favorable.
Alok Dalal
(Alok.Dalal@MotilalOswal.com); +91 22 3982 5584
Hardick Bora
(Hardick.Bora@MotilalOswal.com); +91 22 3982 5423
Investors are advised to refer through disclosures made at the end of the Research Report.

Ipca Laboratories
Scenario analysis indicates favorable risk-reward
Examining three possible scenarios
We have analyzed three scenarios that could unfold over the next three years:
Scenario 1: Resolution in one year – no enforcement/immediate action from US FDA
Scenario 2: Resolution in two years – US FDA enforcement immediate
Scenario 3: Resolution in three years – US FDA enforcement after a year
Based on our analysis, we see a downside of 15% from current levels in case an
enforcement action by the FDA takes around three years to resolve. On the flipside,
assuming the matter is resolved in one year, the upside could be ~30%.
Scenario 1: Resolution in one year – no enforcement/immediate action
We believe this is the most likely scenario. This assumes that no warning letter or
import alert is received, and if so, the same is resolved in one year. We have
assumed that part sales would resume in 2QFY16. EBITDA margin would shrink
200bp to 22.7% in FY15 (management guidance of 24%), and then expand to 24.1%
in FY17, as the situation normalizes.
Scenario 1 analysis
Details
US (USD m)
Total sales (INR m)
EBITDA (%)
EPS (INR)
P/E (x)
Target P/E (x)
Target price (INR)
Upside / (Downside)
FY14
34
32,818
24.7
37.9
19.1
FY15E
20
35,818
22.7
39.6
18.3
FY16E
26
41,818
23.1
47.2
15.4
FY17E
62
50,889
24.1
61.1
11.9
15
916
26%
Source: Company, MOSL
Scenario 2: Resolution in two years; US FDA enforcement immediate
This scenario assumes that import alert comes immediately and takes another year
to resolve. The current market price reflects this scenario. Here, we assumed that
US sales would be zero and resume only in FY17. EBITDA margin would shrink 200bp
to 22.7% in FY15 and remain flat until FY17.
Scenario 2 analysis
Details
US (USD m)
Total sales (INR m)
EBITDA (%)
EPS (INR)
P/E (x)
Target P/E (x)
Target price (INR)
Upside / (Downside)
FY14
34
32,818
24.7
37.9
19.1
FY15E
20
35,818
22.7
39.6
18.3
FY16E
0
40,325
22.0
42.5
17.1
FY17E
26
48,830
22.5
53.5
13.6
14
749
3%
Source: Company, MOSL
7 August 2014
2

Ipca Laboratories
Scenario 3: Resolution in three years; US FDA enforcement after a year
This scenario assumes that import alert comes after one year (eg: Ranbaxy’s Mohali
unit)and takes another two years to resolve. This is the worst case scenario and we
believe it has the lowest possibility of fructifying. Here we assume that US sales
would be zero for FY16 and FY17. EBITDA margin would shrink 200bp to 22.7% and
dip another 170bp to 21% in FY17.
Scenario 3 analysis
Details
US (USD m)
Total sales (INR m)
EBITDA (%)
EPS (INR)
P/E (x)
Target P/E (x)
Target price (INR)
Upside / (Downside)
FY14
34
32,818
24.7
37.9
19.1
FY15E
20
35,818
22.7
39.6
18.3
FY16E
0
40,325
22.0
42.5
17.1
FY17E
0
47,322
21.0
47.2
15.4
13
613
-15%
Source: Company, MOSL
Upsides not factored in the following scenarios
All our assumptions do not factor in the following potential upsides:
The company is allowed to selectively resume production for gPlaquenil and
gTenormin.
Site-transfer to other facilities allows resumption of formulations supplies
despite the import alert on Ratlam API plant.
Valuation and view
IPCA has had a great execution track record. In our view, it is undergoing a
temporary disruption in its growth story. We maintain our
Buy
call on IPCA.
We have analyzed three scenarios that could unfold over FY15-17, based on
which we see a potential upside of 30% in the next 18 months.
However, if a warning letter/import alert takes more than two years to resolve,
there could be a downside risk of 15%. We believe risk-reward is favorable.
7 August 2014
3

Ipca Laboratories
Story in charts
US to be impacted in medium term; recovery likely in FY17
North America generics (INR m)
Branded generics to continue to grow on a small base
Branded generic exports (INR m)
Growth (%)
76
30.1
10.5
37
25
14
40
42
30
-41.1
1,355
FY10
FY11
FY12
FY13
FY14
FY15E FY16E FY17E
Source: Company, MOSL
25.6
33.2
26.1
23.7
25.1
38
5,080
6,357
1,496
FY11
1,946
FY12
2,445
FY13E
3,255
4,106
FY10
FY14
FY15E FY16E FY17E
Source: Company, MOSL
Institutional business growth to moderate as prices drop
Institutional business (INR m)
Growth (%)
Expect improvement in sales mix despite FDA bottleneck
Branded exports + US generic + institutional business
(% of sales)
6,019
351.9
3,985
145.6
2,996
FY12
33.0
15.0
FY17E
15
FY10
4,370
4,666
5,234
21
29
31
32
30
31
34
1,220
FY11
9.7
FY14
6.8
FY15E
12.2
FY16E
FY13E
FY11
FY12
FY13
FY14
FY15E FY16E FY17E
Source: Company, MOSL
India formulations growth to be ahead of market…
DF Revenues (INR m)
Growth (%)
…with dependence on anti-malaria reducing to 14% in FY14
4
3
4
5
24
CVS and anti diabetic
NSAID
Anti malaria
Anti bacteria
GI
25.4
16.5
8.2
5,978
FY10
6,964
FY11
7,534
FY12
8,781
FY13
16.6
10.4
16.3
16.0
16.0
5
6
14
CNS
9,694 11,273 13,077 15,169
FY14
FY15E FY16E FY17E
35
Derma
Cough Preparation
Others
Source: Company, MOSL
7 August 2014
4

Ipca Laboratories
Story in charts
Sales growth to be led by US and branded generics
Approved ANDAs backed by own DMFs (%)
100
88
21.2
52
52
21.4
Revenue growth to dip in FY15; likely to pick up thereafter
Sales (INR m)
YoY growth (%)
24.3
19.3
16.7
9.1
16.8
85
41
25
21.7
23,587 28,131
15,622 18,969
IPCA
ALPM
LPC
SUNP
CDH
TRP
GNP
FY10
FY11
FY12
FY13
32,818
41,818
50,889
35,818
FY14
FY15E FY16E FY17E
Source: Company, MOSL
Profitability to improve after a dip in FY15
EBITDA (INR m)
EBITDA Margin (%)
One-year forward P/E (x)
PE (x)
24.1
Peak(x)
Avg(x)
Min(x)
18.9
21.3
19.8
21.8
22.2
24.7
23
18
13
12.4
4.0
22.7
23.1
15.4
3,335
FY10
3,761
FY11
5,135
FY12
6,232
8,106
8,122
9,657
12,250
8
3
FY13
FY14
FY15E FY16E FY17E
Source: Company, MOSL
Source: USFDA, MOSL
7 August 2014
5

Ipca Laboratories
Financials and valuations
Income statement
Y/E Mar
Net Sales
Change (%)
EBITDA
EBITDA Margin (%)
Depreciation
EBIT
Interest
Other Income
Extraordinary items
PBT
Tax
Tax Rate (%)
Min. Int. & Assoc. Share
Reported PAT
Adjusted PAT
Change (%)
Margins (%)
2012
23,587
24
5,135
21.8
671
4,464
413
-408
0
3,643
881
24.2
0
2,762
2,762
5
12
2013
28,131
19
6,232
22.2
867
5,365
334
-488
0
4,543
1,299
28.6
0
3,243
3,243
17
12
2014
32,818
17
8,106
24.7
1,031
7,074
269
-500
0
6,306
1,524
24.2
0
4,782
4,782
47
15
2015E
35,818
9
8,122
22.7
1,649
6,473
228
372
0
6,617
1,622
24.5
0
4,996
4,996
4
14
(INR Million)
2016E
41,818
17
9,657
23.1
1,986
7,671
285
447
0
7,833
1,880
24.0
0
5,953
5,953
19
14
2017E
50,889
22
12,250
24.1
2,361
9,889
285
536
0
10,141
2,434
24.0
0
7,707
7,707
29
15
Balance sheet
Y/E Mar
Share Capital
Reserves
Net Worth
Debt
Deferred Tax
Total Capital Employed
Gross Fixed Assets
Less: Acc Depreciation
Net Fixed Assets
Capital WIP
Investments
Current Assets
Inventory
Debtors
Cash & Bank
Loans & Adv, Others
Curr Liabs & Provns
Curr. Liabilities
Provisions
Net Current Assets
Total Assets
2012
252
12,288
12,540
5,326
932
18,798
13,150
3,945
9,205
945
341
12,547
6,699
3,491
122
2,235
4,475
4,099
377
8,071
18,798
2013
252
15,285
15,538
5,234
1,304
22,075
15,555
4,748
10,806
1,292
90
14,545
7,410
4,178
582
2,374
4,894
4,351
544
9,651
22,075
2014
252
19,344
19,597
4,379
1,471
25,447
18,976
5,785
13,192
1,649
92
16,827
8,476
4,495
763
3,093
6,656
5,950
706
10,171
25,447
2015E
252
23,591
23,843
4,379
1,637
29,859
23,976
7,434
16,542
1,649
92
17,876
9,147
5,007
641
3,081
6,644
5,970
674
11,232
29,859
(INR Million)
2016E
2017E
252
252
28,651
35,201
28,903
35,454
4,379
4,379
1,794
1,996
35,076
41,830
28,976
33,976
9,419
11,780
19,557
22,196
1,649
1,649
92
92
21,185
26,980
10,671
12,985
5,953
7,518
854
1,693
3,707
4,784
7,750
9,431
6,964
8,474
786
957
13,434
17,549
35,076
41,830
E: MOSL Estimates
7 August 2014
6

Ipca Laboratories
Financials and valuations
Ratios
Y/E Mar
Basic (INR)
EPS
Cash EPS
Book Value
DPS
Payout (incl. Div. Tax.)
Valuation(x)
P/E
Cash P/E
Price / Book Value
EV/Sales
EV/EBITDA
Dividend Yield (%)
Profitability Ratios (%)
RoE
RoCE
Turnover Ratios (%)
Asset Turnover (x)
Debtors (No. of Days)
Inventory (No. of Days)
Creditors (No. of Days)
Leverage Ratios (%)
Net Debt/Equity (x)
2012
21.9
27.2
99.4
3.7
17.0
33.1
26.7
7.3
4.1
18.8
0.5
24.0
24.1
1.8
53.6
103.7
81.1
0.4
2013
25.7
32.6
123.1
4.7
18.1
28.2
22.3
5.9
3.4
15.4
0.6
23.1
25.2
1.8
53.8
96.1
72.5
0.3
2014
37.9
46.1
155.3
5.8
15.4
19.1
15.7
4.7
2.9
11.7
0.8
27.2
29.4
1.7
49.7
94.3
87.9
0.2
2015E
39.6
52.7
188.9
5.9
15.0
18.3
13.8
3.8
2.7
11.7
0.8
23.0
26.2
1.5
50.7
93.2
78.7
0.2
2016E
47.2
62.9
229.0
7.1
15.0
15.4
11.5
3.2
2.3
9.8
1.0
22.6
26.4
1.4
51.6
93.1
79.0
0.2
2017E
61.1
79.8
280.9
9.2
15.0
11.9
9.1
2.6
1.9
7.7
1.3
24.0
28.5
1.5
53.6
93.1
80.1
0.1
Cash flow statement
Y/E Mar
OP/(Loss) before Tax
Depreciation
Others
Interest
Direct Taxes Paid
(Inc)/Dec in Wkg Cap
CF from Op. Activity
(Inc)/Dec in FA & CWIP
(Pur)/Sale of Invt
Others
CF from Inv. Activity
Inc/(Dec) in Net Worth
Inc / (Dec) in Debt
Interest Paid
Divd Paid (incl Tax)
CF from Fin. Activity
Inc/(Dec) in Cash
Add: Opening Balance
Closing Balance
2012
3,643
671
0
413
-757
39
4,010
-3,315
68
0
-3,247
1
25
-413
-468
-744
18
104
122
2013
4,543
867
0
334
-927
-1,119
3,698
-2,752
251
0
-2,501
0
-93
-334
-589
-736
461
122
582
2014
6,306
1,031
0
269
-1,357
-339
5,910
-3,887
-1
0
-3,888
0
-854
-269
-738
-1,841
180
582
763
2015E
6,617
1,649
0
228
-1,456
-1,184
5,855
-5,000
0
0
-5,000
0
0
-228
-749
-978
-122
763
641
(INR Million)
2016E
2017E
7,833
10,141
1,986
2,361
0
0
285
285
-1,723
-2,231
-1,989
-3,275
6,391
7,280
-5,000
-5,000
0
0
0
0
-5,000
-5,000
0
0
0
0
-285
-285
-893
-1,156
-1,178
-1,441
214
839
641
854
854
1,693
E: MOSL Estimates
7 August 2014
7

Disclosures
This research report has been prepared by MOSt to provide information about the company(ies) and sector(s), if any, covered in the report and may be distributed by it and/or its affiliated company(ies). This
report is for personal information of the select recipient and does not construe to be any investment, legal or taxation advice to you. This research report does not constitute an offer, invitation or inducement to
invest in securities or other investments and Motilal Oswal Securities Limited (hereinafter referred as MOSt) is not soliciting any action based upon it. This report is not for public distribution and has been
furnished to you solely for your general information and should not be reproduced or redistributed to any other person in any form. This report does not constitute a personal recommendation or take into
account the particular investment objectives, financial situations, or needs of individual clients. Before acting on any advice or recommendation in this material, investors should consider whether it is suitable
for their particular circumstances and, if necessary, seek professional advice. The price and value of the investments referred to in this material and the income from them may go down as well as up, and
investors may realize losses on any investments. Past performance is not a guide for future performance, future returns are not guaranteed and a loss of original capital may occur.
MOSt and its affiliates are a full-service, integrated investment banking, investment management, brokerage and financing group. We and our affiliates have investment banking and other business
relationships with a significant percentage of the companies covered by our Research Department Our research professionals provide important input into our investment banking and other business selection
processes. Investors should assume that MOSt and/or its affiliates are seeking or will seek investment banking or other business from the company or companies that are the subject of this material and that
the research professionals who were involved in preparing this material may participate in the solicitation of such business. The research professionals responsible for the preparation of this document may
interact with trading desk personnel, sales personnel and other parties for the purpose of gathering, applying and interpreting market information. Our research professionals are paid in part based on the
profitability of MOSt which include earnings from investment banking and other business. MOSt generally prohibits its analysts, persons reporting to analysts, and members of their households from
maintaining a financial interest in the securities or derivatives of any companies that the analysts cover. Additionally, MOSt generally prohibits its analysts and persons reporting to analysts from serving as an
officer, director, or advisory board member of any companies that the analysts cover. Our salespeople, traders, and other professionals or affiliates may provide oral or written market commentary or trading
strategies to our clients that reflect opinions that are contrary to the opinions expressed herein, and our proprietary trading and investing businesses may make investment decisions that are inconsistent with
the recommendations expressed herein. In reviewing these materials, you should be aware that any or all o the foregoing, among other things, may give rise to real or potential conflicts of interest . MOSt and
its affiliated company(ies), their directors and employees may; (a) from time to time, have a long or short position in, and buy or sell the securities of the company(ies) mentioned herein or (b) be engaged in
any other transaction involving such securities and earn brokerage or other compensation or act as a market maker in the financial instruments of the company(ies) discussed herein or act as an advisor or
lender/borrower to such company(ies) or may have any other potential conflict of interests with respect to any recommendation and other related information and opinions.
Unauthorized disclosure, use, dissemination or copying (either whole or partial) of this information, is prohibited. The person accessing this information specifically agrees to exempt MOSt or any of its
affiliates or employees from, any and all responsibility/liability arising from such misuse and agrees not to hold MOSt or any of its affiliates or employees responsible for any such misuse and further agrees to
hold MOSt or any of its affiliates or employees free and harmless from all losses, costs, damages, expenses that may be suffered by the person accessing this information due to any errors and delays. The
information contained herein is based on publicly available data or other sources believed to be reliable. Any statements contained in this report attributed to a third party represent MOSt’s interpretation of the
data, information and/or opinions provided by that third party either publicly or through a subscription service, and such use and interpretation have not been reviewed by the third party. This Report is not
intended to be a complete statement or summary of the securities, markets or developments referred to in the document. While we would endeavor to update the information herein on reasonable basis, MOSt
and/or its affiliates are under no obligation to update the information. Also there may be regulatory, compliance, or other reasons that may prevent MOSt and/or its affiliates from doing so. MOSt or any of its
affiliates or employees shall not be in any way responsible and liable for any loss or damage that may arise to any person from any inadvertent error in the information contained in this report. MOSt or any of
its affiliates or employees do not provide, at any time, any express or implied warranty of any kind, regarding any matter pertaining to this report, including without limitation the implied warranties of
merchantability, fitness for a particular purpose, and non-infringement. The recipients of this report should rely on their own investigations.
Recipients who are not institutional investors should seek advice of their independent financial advisor prior to taking any investment decision based on this report or for any necessary explanation of its
contents.
MOSt and/or its affiliates and/or employees may have interests/positions, financial or otherwise in the securities mentioned in this report. To enhance transparency, MOSt has incorporated a Disclosure of
Interest Statement in this document. This should, however, not be treated as endorsement of the views expressed in the report.
Disclosure of Interest Statement
Analyst ownership of the stock
IPCA LABORATORIES
No
Ipca Laboratories
Analyst Certification
The views expressed in this research report accurately reflect the personal views of the analyst(s) about the subject securities or issues, and no part of the compensation of the research analyst(s) was, is, or
will be directly or indirectly related to the specific recommendations and views expressed by research analyst(s) in this report. The research analysts, strategists, or research associates principally responsible
for preparation of MOSt research receive compensation based upon various factors, including quality of research, investor client feedback, stock picking, competitive factors and firm revenues.
Regional Disclosures (outside India)
For U.K.
This report is not directed or intended for distribution to or use by any person or entity resident in a state, country or any jurisdiction, where such distribution, publication, availability or use would be contrary to
law, regulation or which would subject MOSt & its group companies to registration or licensing requirements within such jurisdictions.
This report is intended for distribution only to persons having professional experience in matters relating to investments as described in Article 19 of the Financial Services and Markets Act 2000 (Financial
Promotion) Order 2005 (referred to as "investment professionals"). This document must not be acted on or relied on by persons who are not investment professionals. Any investment or investment activity to
which this document relates is only available to investment professionals and will be engaged in only with such persons.
Motilal Oswal Securities Limited (MOSL) is not a registered broker - dealer under the U.S. Securities Exchange Act of 1934, as amended (the"1934 act") and under applicable state laws in the United States.
In addition MOSL is not a registered investment adviser under the U.S. Investment Advisers Act of 1940, as amended (the "Advisers Act" and together with the 1934 Act, the "Acts), and under applicable state
laws in the United States. Accordingly, in the absence of specific exemption under the Acts, any brokerage and investment services provided by MOSL, including the products and services described herein
are not available to or intended for U.S. persons.
This report is intended for distribution only to "Major Institutional Investors" as defined by Rule 15a-6(b)(4) of the Exchange Act and interpretations thereof by SEC (henceforth referred to as "major institutional
investors"). This document must not be acted on or relied on by persons who are not major institutional investors. Any investment or investment activity to which this document relates is only available to major
institutional investors and will be engaged in only with major institutional investors. In reliance on the exemption from registration provided by Rule 15a-6 of the U.S. Securities Exchange Act of 1934, as
amended (the "Exchange Act") and interpretations thereof by the U.S. Securities and Exchange Commission ("SEC") in order to conduct business with Institutional Investors based in the U.S., MOSL has
entered into a chaperoning agreement with a U.S. registered broker-dealer, Motilal Oswal Securities International Private Limited. ("MOSIPL"). Any business interaction pursuant to this report will have to be
executed within the provisions of this chaperoning agreement.
The Research Analysts contributing to the report may not be registered /qualified as research analyst with FINRA. Such research analyst may not be associated persons of the U.S. registered broker-dealer,
MOSIPL, and therefore, may not be subject to NASD rule 2711 and NYSE Rule 472 restrictions on communication with a subject company, public appearances and trading securities held by a research
analyst account.
Motilal Oswal Capital Markets Singapore Pte Limited is acting as an exempt financial advisor under section 23(1)(f) of the Financial Advisers Act(FAA) read with regulation 17(1)(d) of the Financial Advisors
Regulations and is a subsidiary of Motilal Oswal Securities Limited in India. This research is distributed in Singapore by Motilal Oswal Capital Markets Singapore Pte Limited and it is only directed in Singapore
to accredited investors, as defined in the Financial Advisers Regulations and the Securities and Futures Act (Chapter 289), as amended from time to time.
In respect of any matter arising from or in connection with the research you could contact the following representatives of Motilal Oswal Capital Markets Singapore Pte Limited:
Anosh Koppikar
Kadambari Balachandran
Email:anosh.Koppikar@motilaloswal.com
Email : kadambari.balachandran@motilaloswal.com
Contact(+65)68189232
Contact: (+65) 68189233 / 65249115
Office Address:21 (Suite 31),16 Collyer Quay,Singapore 04931
For U.S.
For Singapore
Motilal Oswal Securities Ltd
7 August 2014
Motilal Oswal Tower, Level 9, Sayani Road, Prabhadevi, Mumbai 400 025
Phone: +91 22 3982 5500 E-mail: reports@motilaloswal.com
8