11 August 2014
1QFY15 Results Update | Sector:
Oil & Gas
MRPL
BSE SENSEX
25,519
Bloomberg
Equity Shares (m)
52-Week Range (INR)
1, 6, 12 Rel. Per (%)
S&P CNX
7,626
MRPL IN
1,752.6
81/26
-4/31/79
CMP: INR64
TP: INR65
Neutral
M.Cap. (INR b) / (USD b) 112.9/1.8
Financials & Valuation (INR Billion)
Y/E Mar
Net Sales
EBITDA
Adj PAT
EPS (INR)
Gr. (%)
BV/Sh.
(INR)
RoE (%)
RoCE (%)
P/E (x)
P/BV (X)
2015E 2016E 2017E
742.8
18.3
7.3
4.2
22.2
43.6
10.0
7.2
15.4
1.5
757.8
33.0
14.1
8.0
91.8
49.8
17.2
15.6
8.0
1.3
735.8
34.1
15.1
8.6
7.1
56.4
16.2
15.0
7.5
1.1
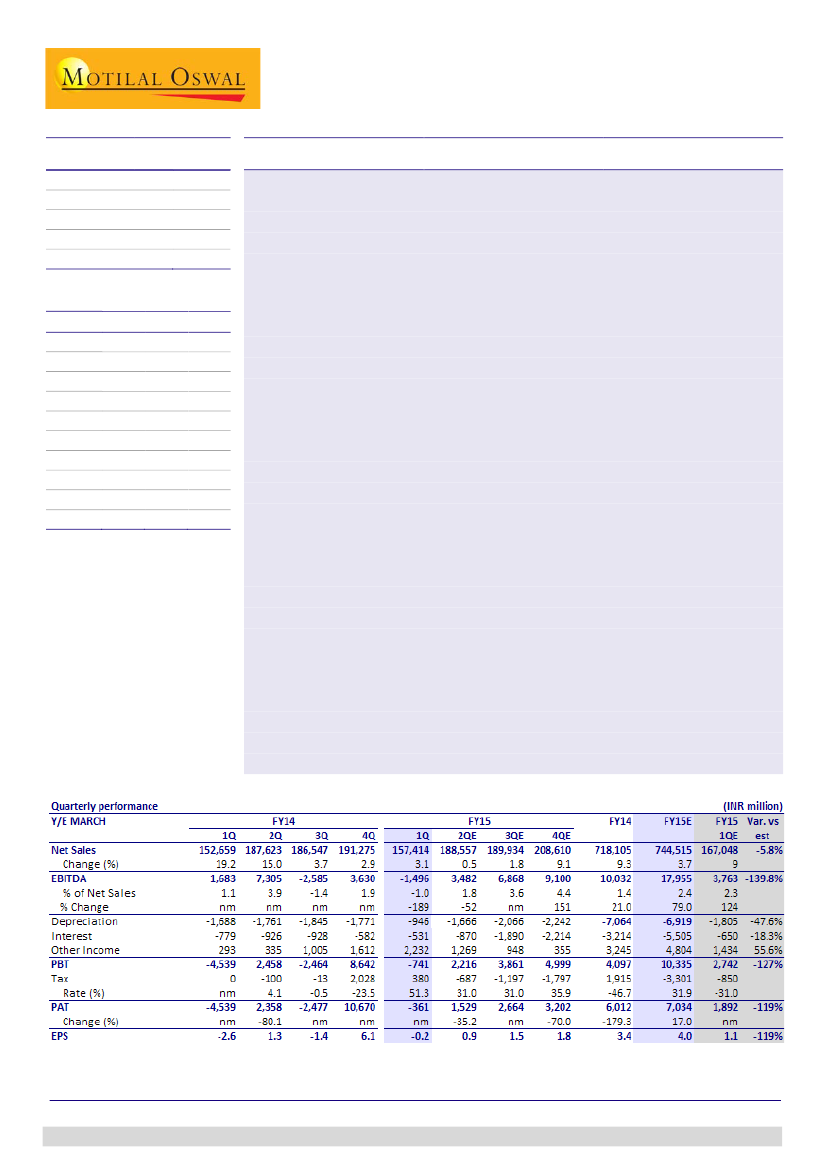
MRPL’s reported 1QFY15 EBITDA loss at INR-1.5b (est INR3.8b) was below estimate
led by GRM of USD0.66/bbl due to higher F&L (est USD3.4/bbl), and higher opex of
USD1.5/bbl (est of USD1.0/bbl). Reported net loss stood at INR-361m led by (a)
higher other income of INR2.2b, and (b) INR380m tax gain.
GRM at USD0.66/bbl impacted by integration issues:
MRPL reported GRM at
USD0.66/bbl (v/s 1QFY14 GRM of USD2.9/bbl and USD3.2/bbl in 4QFY14) was
lower than our estimate of USD3.4/bbl, due to higher Fuel and losses. Throughput
at 3.2mmt (est. of 3.35mmt) declined due to planned shutdown in the quarter. The
opex at USD1.5/bbl was higher than our estimate of USD1.0/bbl, due to power
plant commissioning and downstream unit shutdown.
MRPL’s Phase III project (INR150b) progress stands at 99.74% v/s 99.68% as on
April, 2014. Post the commissioning of DCU (Delayed Coker Unit), MRPL has been
selling petcoke from April 2014. PFCCU (Petro Fluidized Catalytic Cracking unit) and
the remaining one out of three trains of SRU (Sulphur Recovery Unit) is expected to
be completed in August 2014.
Higher other income at INR2.2b (7.6x YoY, +39% QoQ) due to complexity in Iran
crude purchase payment. MRPL expects to pay the remaining amount in the
coming quarters.
Polypropylene project progress is 96.3% v/s 95.6% in 4QFY14, and commissioning is
expected by 3QFY15 (v/s earlier estimate of 2QFY15).
We expect that post the commencement of full operations, benefit of high
complexity refinery will be seen from 3QFY15.
GRM outlook subdued:
While the near term GRM’s are expected to remain range-
bound, medium term outlook remains subdued due to refinery capacity additions
exceeding oil demand growth.
Valuation and view
MRPL being a standalone refiner is highly sensitive to GRM. For variation of USD1/bbl
in GRM, FY16 EPS changes ~30%. The stock trades at FY16E P/E of 8x and EV/EBITDA
of 5.3x. Neutral.
Harshad Borawake
(HarshadBorawake@MotilalOswal.com); +91 22 3982 5432
Nitish Rathi
(Nitish.Rathi@motilaloswal.com); +91 22 3982 5558
Investors are advised to refer through disclosures made at the end of the Research Report.

MRPL
MRPL: Key Operating and Financial Performance
Source: Company, MOSL
Operational Highlights
MRPL’s 1QFY15 crude throughput stood at 3.2mmt (v/s est of 3.35mmt), -2%
YoY and -17% QoQ.
1QFY15 GRM stood at USD0.66/bbl, v/s USD2.9/bbl in 1QFY14 and USD3.2/bbl
in 4QFY14.
MRPL’s GRM has declined below Singapore’s GRM led by higher fuel & loss on account of new capacity startup
Prem/(Disc) to Singapore
9.1
1.9
3.6
(1.7)
4.2
6.1
1.9
6.0
5.5
0.5
7.3
1.8
(5.5)
(7.4)
8.5
3.0
9.1
7.9
3.8
1.7
(0.4)
(4.1)
(4.2)
(10.9)
1QFY11
3QFY11
1QFY12
3QFY12
1QFY13
3QFY13
1QFY14
3QFY14
1QFY15
7.5
7.1
0.1
1.9
(4.4)
(7.1)
(3.7)
MRPL GRM (USD/bbl)
6.7
9.1
9.2
9.1
6.3
2.0
Singapore GRM (USD/bbl)
6.6
2.9
5.4
5.0
(0.4)
6.2
4.3
3.2
0.7
(3.0)
(5.5)
6.2
(0.6)
(4.9)
Source: Company, MOSL
11 August 2014
2

MRPL
1QFY15 throughput at 3.2mmt
Throughput (mmt)
118%
98%
97%
3.5
2.9
2.9
114%
106%
109%
99%
97%
88%
3.4
2.9
3.6
3.8
Utilization (%)
126%
116%
109%
98%
4.1
87%
3.7
3.3
3.8
3.8
3.2
100%
102%
85%
3.4
3.3
3.1
3.0
1QFY11
3QFY11
1QFY12
3QFY12
1QFY13
3QFY13
1QFY14
3QFY14
1QFY15
Source: Company, MOSL
Update on Expansion Project
Delayed Coker Unit (DCU) of 3.0MMTPA, a part of the Refinery Up-gradation
cum Expansion Project, went on stream on April 03, 2014. Post the
commissioning of DCU (Delayed Coker Unit), MRPL has been selling petcoke.
MRPL management expects overall increment of USD4/bbl in GRM, once all the
units of the project are on-line.
The management expects commissioning of PFCCU by end-August 2014 and
440KTA PP by end-October 2014. And, expects fuel losses to come down to 9%
once PFCCU goes on stream.
Total capex stands at INR150b. MRPL plans to spend INR18b/16b/14b in
2Q/3Q/4QFY15.
MRPL upgradation cum expansion project, to decrease the heavies and increase the lights
Light distillates
7.6
19.7
Middle distillates
Heavies
9.7
11.8
52.1
F&L
52.4
20.3
Current
26.4
Post upgradation
Source: Company, MOSL
Valuation and view
MRPL being a standalone refiner is highly sensitive to GRM. For variation of
USD1/bbl in GRM, FY16 EPS changes ~50%.
The stock trades at FY16E P/E of 8x and EV/EBITDA of 5.3x. We value MRPL at
5.5x EV/EBITDA to arrive at a fair value of INR65/share. Maintain
Neutral.
11 August 2014
3

MRPL
Story in Charts
MRPL has recently completed its nameplate capacity expansion
from 9.5mmt to 15.5mmmt along with complexity increase
…Higher complexity is expected to result in higher GRM from
2HFY15 onwards
GRM (USD/bbl)
7.0
5.7
4.8
3.7
6.3
5.3 5.8
3.9
2.5 2.6
3.7
5.8
5.8
Capacity (MMTPA)
FY04
FY06
FY08
FY10
FY12
FY14
FY16E
Vision
FY05
FY07
FY09
FY11
FY13
FY15E
FY17E
Source: Company, MOSL
EBITDA to increase led by improving GRMs…
EBITDA (INRb)
28
19
12
20
16
15
8
10
20
23
18
33 34
8.8
3.7
5.3
12.7
11.9 11.1 11.8
9.1
Source: Company, MOSL
…PAT shall be realized as the margins improve.
PAT (INRb)
14.1 15.1
7.3
6.0
(7.6)
FY05
FY07
FY09
FY11
FY13
FY15E
FY17E
FY05
FY07
FY09
FY11
FY13
FY15E
FY17E
Source: Company, MOSL
ROE and ROCE are expected to recover from the decade lows…
ROE
ROCE
50
40
30
20
10
0
(10)
(20)
FY05
FY07
FY09
FY11
FY13
FY15E
FY17E
Source: Company, MOSL
1 Yr frwd P/E at 9.6, lower than historical avg. and median P/E…
PE (x)
Avg(x)
Peak(x)
Median(x)
Min(x)
80
60
40
20
0
13.8
69.7
Negative
Earnings
Cycle
11.8
5.0
11.0
Source: Company, MOSL
11 August 2014
4

MRPL
MRPL: an investment profile
Company description
MRPL (Bloomberg: MRPL) is an ONGC Group company,
with ONGC’s stake at 71.6%. It was set up in 1988 with
the initial crude processing capacity of 3.0MMTPA that
was later expanded to 9.7MMTPA and is now expanded
to 15mmtpa.
The company has high sensitivity towards GRM due
to lack of integration (in upstream/downstream
businesses).
Recent developments
Key investment arguments
MRPL is a pure play refinery as its earnings have
direct correlation with the refining margins.
Expect positive operational/financial performance
delta led by a) 25% capacity increase to 15mmtpa; b)
Nelson complexity rise from 5.5 to 9, leading to GRM
improvement; c) cost savings through SPM; and d)
fiscal benefits from state government Setting-up of
440 KTA of PP capacity in integration with Phase-III
and SPM (single Point Mooring) facility is going to
increase the company’s margins and reduce freight
costs.
We expect the benefit from the expanded, high
complex facility to accrue from 2HFY15.
The Delayed Coker Unit (DCU) of 3.0 MMTPA, which is
part of the Refinery upgradation and Expansion
Project, Phase-III went on stream on April 03, 20 14.
Valuation and view
The stock trades at FY15E P/E of 8x and EV/EBITDA of
5.3x. We value MRPL at 5.5x EV/EBITDA to arrive at a
fair value of INR65/share. Maintain
Neutral.
Sector view
In the long term, outlook of international refining
margins remains weak since the planned capacity
additions seem to be exceeding the demand growth
for petroleum products.
The operational results will continue to be impacted
by the volatility in Indian Rupee Value and Crude
prices determining inventory gains/losses.
Key investment risks
Until the entire up-gradation and expansion project
phase-III comes on line the newly commissioned
units would incur higher per barrel depreciation and
operating costs due to sub-optimal capacity
utilization.
Target price and recommendation
Variation
(%)
0.0
6.0
Current
Price (INR)
64
Target
Price (INR)
65
Upside
(%)
1.6
Reco
Neutral
MOSL
Forecast
4.2
8.0
Consensus
Forecast
4.2
7.6
EPS: MOSL forecast v/s consensus (INR)
FY14
FY15
Shareholding pattern (%)
Jun-14
Promoter
DII
FII
Others
88.6
3.1
0.6
7.8
Mar-14
88.6
3.1
0.5
7.9
Jun-13
88.6
2.6
0.6
8.2
Stock performance (1-year)
Notes: FII includes depository receipts
11 August 2014
5

MRPL
Financials and valuation
Income statement
Y/E Mar
Net Sales
Change (%)
EBITDA
EBITDA Margin (%)
Depreciation
EBIT
Interest
Other Income
Extraordinary items
PBT
Tax
Tax Rate (%)
Reported PAT
Adjusted PAT
Change (%)
Min. Int. & Assoc. Share
Adj Cons PAT
2014
718.1
9.3
10.0
1.4
7.1
3.0
3.2
3.2
1.1
1.9
-1.9
-102.9
3.8
6.0
-175.0
0.0
3.8
2015E
742.8
3.4
18.3
2.5
6.9
11.3
5.5
4.8
0.0
10.6
3.3
31.0
7.3
7.3
22.2
0.0
7.3
(INR Billion)
2016E
757.8
2.0
33.0
4.4
8.8
24.2
5.2
1.4
0.0
20.4
6.3
31.0
14.1
14.1
91.8
0.0
14.1
2017E
735.8
-2.9
34.1
4.6
9.0
25.0
5.0
1.8
0.0
21.9
6.8
31.0
15.1
15.1
7.1
0.0
15.1
Ratios
Y/E Mar
Basic (INR)
EPS
Cash EPS
Book Value
DPS
Payout (incl. Div. Tax.)
Valuation(x)
P/E
Cash P/E
Price / Book Value
EV/Sales
EV/EBITDA
Dividend Yield (%)
Profitability Ratios (%)
RoE
RoCE
Turnover Ratios (%)
Asset Turnover (x)
Debtors (No. of Days)
Inventory (No. of Days)
Creditors (No. of Days)
Leverage Ratios (%)
Net Debt/Equity (x)
2014
3.4
6.2
40.3
0.0
0.0
18.8
10.4
1.6
0.1
9.4
0.0
5.6
1.9
4.7
22.8
42.9
0.0
1.3
2015E
4.2
8.1
43.6
0.0
22.3
15.4
7.9
1.5
0.2
9.8
0.0
10.0
7.2
4.7
21.0
40.0
0.0
0.9
2016E
8.0
13.1
49.8
0.0
23.3
8.0
4.9
1.3
0.2
5.3
0.0
17.2
15.6
4.9
21.0
40.0
0.0
0.7
2017E
8.6
13.8
56.4
0.0
23.1
7.5
4.7
1.1
0.2
4.6
0.0
16.2
15.0
4.4
21.0
40.0
0.0
0.7
Balance sheet
Y/E Mar
Share Capital
Reserves
Net Worth
Debt
Deferred Tax
Total Capital Employed
Gross Fixed Assets
Less: Acc Depreciation
Net Fixed Assets
Capital WIP
Investments
Current Assets
Inventory
Debtors
Cash & Bank
Loans & Adv, Others
Curr Liabs & Provns
Curr. Liabilities
Provisions
Net Current Assets
Total Assets
2014
17.5
53.2
70.7
88.5
4.7
163.9
122.6
62.6
59.9
84.9
0.2
250.2
84.5
44.8
107.3
13.6
231.2
229.6
1.7
18.9
163.9
2015E
17.5
58.9
76.4
68.5
5.9
150.8
206.9
69.6
137.4
5.0
0.2
139.0
81.4
42.7
1.8
13.0
130.7
129.0
1.7
8.3
150.8
(INR Billion)
2016E
2017E
17.5
17.5
69.7
81.3
87.2
98.8
63.9
64.3
8.1
10.5
159.2
173.6
212.1
217.4
78.4
87.4
133.7
130.0
5.0
5.0
0.2
0.2
141.2
155.5
83.0
80.6
43.6
42.3
1.4
19.5
13.1
13.0
120.8
117.0
119.1
115.4
1.7
1.7
20.3
38.5
159.2
173.6
E: MOSL Estimates
Cash flow statement
Y/E Mar
OP/(Loss) before Tax
Depreciation
Others
Interest
Direct Taxes Paid
(Inc)/Dec in Wkg Cap
CF from Op. Activity
(Inc)/Dec in FA & CWIP
(Pur)/Sale of Invt
Others
CF from Inv. Activity
Inc/(Dec) in Net Worth
Inc / (Dec) in Debt
Interest Paid
Divd Paid (incl Tax)
CF from Fin. Activity
Inc/(Dec) in Cash
Add: Opening Balance
Closing Balance
2014
4.1
7.1
0.0
3.2
-0.8
80.6
94.3
-18.6
0.0
0.0
-18.6
0.0
15.5
0.0
0.0
15.5
91.3
16.1
107.3
2015E
10.6
6.9
0.0
5.5
-2.1
-94.8
-73.9
-4.5
0.0
0.0
-4.5
0.0
-25.5
0.0
-1.6
-27.2
-105.5
107.3
1.8
(INR Billion)
2016E
20.4
8.8
0.0
5.2
-4.1
-12.5
17.9
-5.2
0.0
0.0
-5.2
0.0
-9.8
0.0
-3.3
-13.1
-0.4
1.8
1.4
2017E
21.9
9.0
0.0
5.0
-4.4
0.0
31.5
-5.3
0.0
0.0
-5.3
0.0
-4.6
0.0
-3.5
-8.1
18.1
1.4
19.5
11 August 2014
6

MRPL
NOTES
11 August 2014
7

Disclosures
This research report has been prepared by MOSt to provide information about the company(ies) and sector(s), if any, covered in the report and may be distributed by it and/or its affiliated company(ies). This
MRPL
report is for personal information of the select recipient and does not construe to be any investment, legal or taxation advice to you. This research report does not constitute an offer, invitation or inducement to
invest in securities or other investments and Motilal Oswal Securities Limited (hereinafter referred as MOSt) is not soliciting any action based upon it. This report is not for public distribution and has been
furnished to you solely for your general information and should not be reproduced or redistributed to any other person in any form. This report does not constitute a personal recommendation or take into
account the particular investment objectives, financial situations, or needs of individual clients. Before acting on any advice or recommendation in this material, investors should consider whether it is suitable
for their particular circumstances and, if necessary, seek professional advice. The price and value of the investments referred to in this material and the income from them may go down as well as up, and
investors may realize losses on any investments. Past performance is not a guide for future performance, future returns are not guaranteed and a loss of original capital may occur.
MOSt and its affiliates are a full-service, integrated investment banking, investment management, brokerage and financing group. We and our affiliates have investment banking and other business
relationships with a significant percentage of the companies covered by our Research Department Our research professionals provide important input into our investment banking and other business selection
processes. Investors should assume that MOSt and/or its affiliates are seeking or will seek investment banking or other business from the company or companies that are the subject of this material and that
the research professionals who were involved in preparing this material may participate in the solicitation of such business. The research professionals responsible for the preparation of this document may
interact with trading desk personnel, sales personnel and other parties for the purpose of gathering, applying and interpreting market information. Our research professionals are paid in part based on the
profitability of MOSt which include earnings from investment banking and other business. MOSt generally prohibits its analysts, persons reporting to analysts, and members of their households from
maintaining a financial interest in the securities or derivatives of any companies that the analysts cover. Additionally, MOSt generally prohibits its analysts and persons reporting to analysts from serving as an
officer, director, or advisory board member of any companies that the analysts cover. Our salespeople, traders, and other professionals or affiliates may provide oral or written market commentary or trading
strategies to our clients that reflect opinions that are contrary to the opinions expressed herein, and our proprietary trading and investing businesses may make investment decisions that are inconsistent with
the recommendations expressed herein. In reviewing these materials, you should be aware that any or all o the foregoing, among other things, may give rise to real or potential conflicts of interest . MOSt and
its affiliated company(ies), their directors and employees may; (a) from time to time, have a long or short position in, and buy or sell the securities of the company(ies) mentioned herein or (b) be engaged in
any other transaction involving such securities and earn brokerage or other compensation or act as a market maker in the financial instruments of the company(ies) discussed herein or act as an advisor or
lender/borrower to such company(ies) or may have any other potential conflict of interests with respect to any recommendation and other related information and opinions.
Unauthorized disclosure, use, dissemination or copying (either whole or partial) of this information, is prohibited. The person accessing this information specifically agrees to exempt MOSt or any of its
affiliates or employees from, any and all responsibility/liability arising from such misuse and agrees not to hold MOSt or any of its affiliates or employees responsible for any such misuse and further agrees to
hold MOSt or any of its affiliates or employees free and harmless from all losses, costs, damages, expenses that may be suffered by the person accessing this information due to any errors and delays. The
information contained herein is based on publicly available data or other sources believed to be reliable. Any statements contained in this report attributed to a third party represent MOSt’s interpretation of the
data, information and/or opinions provided by that third party either publicly or through a subscription service, and such use and interpretation have not been reviewed by the third party. This Report is not
intended to be a complete statement or summary of the securities, markets or developments referred to in the document. While we would endeavor to update the information herein on reasonable basis, MOSt
and/or its affiliates are under no obligation to update the information. Also there may be regulatory, compliance, or other reasons that may prevent MOSt and/or its affiliates from doing so. MOSt or any of its
affiliates or employees shall not be in any way responsible and liable for any loss or damage that may arise to any person from any inadvertent error in the information contained in this report. MOSt or any of
its affiliates or employees do not provide, at any time, any express or implied warranty of any kind, regarding any matter pertaining to this report, including without limitation the implied warranties of
merchantability, fitness for a particular purpose, and non-infringement. The recipients of this report should rely on their own investigations.
Recipients who are not institutional investors should seek advice of their independent financial advisor prior to taking any investment decision based on this report or for any necessary explanation of its
contents.
MOSt and/or its affiliates and/or employees may have interests/positions, financial or otherwise in the securities mentioned in this report. To enhance transparency, MOSt has incorporated a Disclosure of
Interest Statement in this document. This should, however, not be treated as endorsement of the views expressed in the report.
Disclosure of Interest Statement
Analyst ownership of the stock
MANGALORE REFINERY & PE
No
Analyst Certification
The views expressed in this research report accurately reflect the personal views of the analyst(s) about the subject securities or issues, and no part of the compensation of the research analyst(s) was, is, or
will be directly or indirectly related to the specific recommendations and views expressed by research analyst(s) in this report. The research analysts, strategists, or research associates principally responsible
for preparation of MOSt research receive compensation based upon various factors, including quality of research, investor client feedback, stock picking, competitive factors and firm revenues.
Regional Disclosures (outside India)
For U.K.
This report is not directed or intended for distribution to or use by any person or entity resident in a state, country or any jurisdiction, where such distribution, publication, availability or use would be contrary to
law, regulation or which would subject MOSt & its group companies to registration or licensing requirements within such jurisdictions.
This report is intended for distribution only to persons having professional experience in matters relating to investments as described in Article 19 of the Financial Services and Markets Act 2000 (Financial
Promotion) Order 2005 (referred to as "investment professionals"). This document must not be acted on or relied on by persons who are not investment professionals. Any investment or investment activity to
which this document relates is only available to investment professionals and will be engaged in only with such persons.
Motilal Oswal Securities Limited (MOSL) is not a registered broker - dealer under the U.S. Securities Exchange Act of 1934, as amended (the"1934 act") and under applicable state laws in the United States.
In addition MOSL is not a registered investment adviser under the U.S. Investment Advisers Act of 1940, as amended (the "Advisers Act" and together with the 1934 Act, the "Acts), and under applicable state
laws in the United States. Accordingly, in the absence of specific exemption under the Acts, any brokerage and investment services provided by MOSL, including the products and services described herein
are not available to or intended for U.S. persons.
This report is intended for distribution only to "Major Institutional Investors" as defined by Rule 15a-6(b)(4) of the Exchange Act and interpretations thereof by SEC (henceforth referred to as "major institutional
investors"). This document must not be acted on or relied on by persons who are not major institutional investors. Any investment or investment activity to which this document relates is only available to major
institutional investors and will be engaged in only with major institutional investors. In reliance on the exemption from registration provided by Rule 15a-6 of the U.S. Securities Exchange Act of 1934, as
amended (the "Exchange Act") and interpretations thereof by the U.S. Securities and Exchange Commission ("SEC") in order to conduct business with Institutional Investors based in the U.S., MOSL has
entered into a chaperoning agreement with a U.S. registered broker-dealer, Motilal Oswal Securities International Private Limited. ("MOSIPL"). Any business interaction pursuant to this report will have to be
executed within the provisions of this chaperoning agreement.
The Research Analysts contributing to the report may not be registered /qualified as research analyst with FINRA. Such research analyst may not be associated persons of the U.S. registered broker-dealer,
MOSIPL, and therefore, may not be subject to NASD rule 2711 and NYSE Rule 472 restrictions on communication with a subject company, public appearances and trading securities held by a research
analyst account.
Motilal Oswal Capital Markets Singapore Pte Limited is acting as an exempt financial advisor under section 23(1)(f) of the Financial Advisers Act(FAA) read with regulation 17(1)(d) of the Financial Advisors
Regulations and is a subsidiary of Motilal Oswal Securities Limited in India. This research is distributed in Singapore by Motilal Oswal Capital Markets Singapore Pte Limited and it is only directed in Singapore
to accredited investors, as defined in the Financial Advisers Regulations and the Securities and Futures Act (Chapter 289), as amended from time to time.
In respect of any matter arising from or in connection with the research you could contact the following representatives of Motilal Oswal Capital Markets Singapore Pte Limited:
Anosh Koppikar
Kadambari Balachandran
Email:anosh.Koppikar@motilaloswal.com
Email : kadambari.balachandran@motilaloswal.com
Contact(+65)68189232
Contact: (+65) 68189233 / 65249115
Office Address:21 (Suite 31),16 Collyer Quay,Singapore 04931
For U.S.
For Singapore
Motilal Oswal Securities Ltd
11 August 2014
Motilal Oswal Tower, Level 9, Sayani Road, Prabhadevi, Mumbai 400 025
Phone: +91 22 3982 5500 E-mail: reports@motilaloswal.com
8