13 August 2014
1QFY15 Results Update | Sector:
Metals
Tata Steel
BSE SENSEX
25,919
Bloomberg
Equity Shares (m)
52-Week Range (INR)
1, 6, 12 Rel. Per (%)
S&P CNX
7,740
TATA IN
971.2
579/224
0/17/87
CMP: INR535
TP: INR650
Buy
Below estimates; EPS cut; cash flow outlook intact
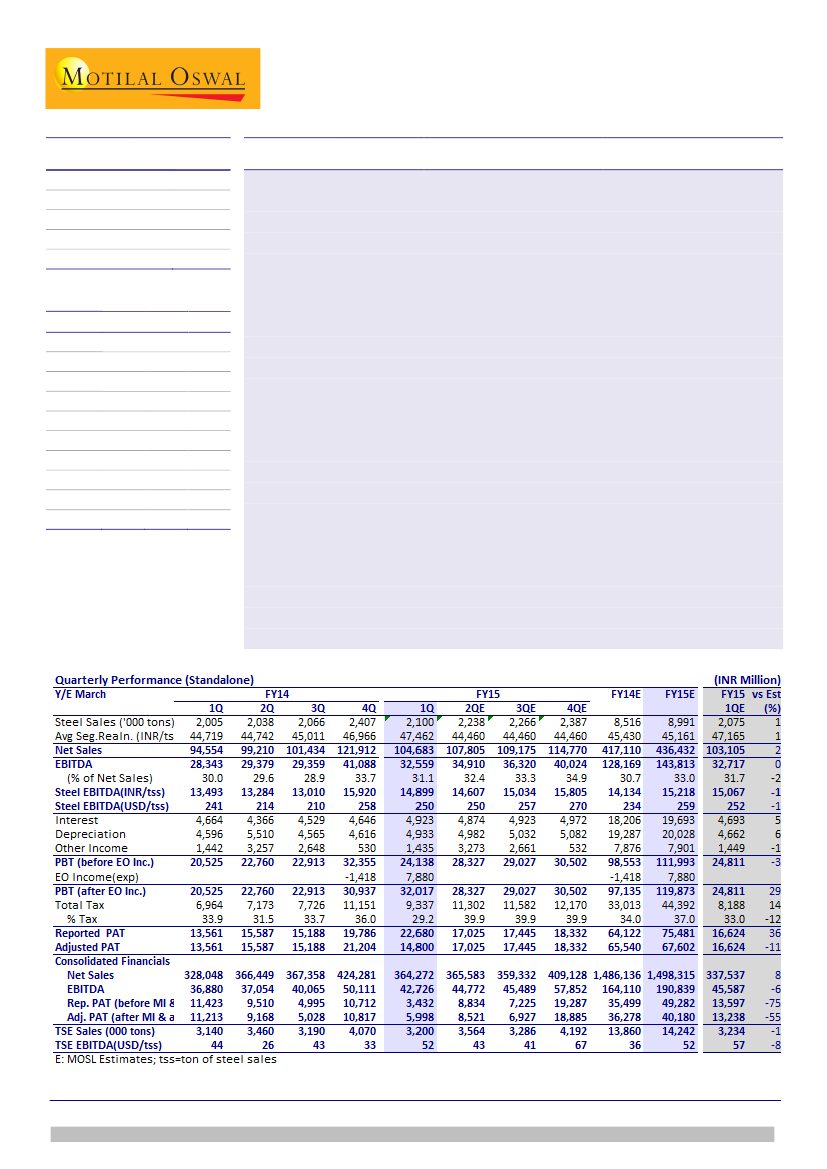
EBITDA below estimates on disappointment in subsidiaries:
consolidated EBITDA
increased 16% YoY to INR42.7b (v/s est. of INR45.6b). Indian operation’s (TSI)
EBITDA at INR32.6b (+15% YoY) was in-line on strong margins and volumes.
European operation’s (TSE) EBITDA increased 28% YoY to INR9.95b (v/s est. of
INR11b). TSE’s EBITDA per ton was respectful at USD52/t. The contribution from
other subsidiaries disappointed due to pressure from Chinese competition.
Higher interest depreciation & tax rate dragged PAT:
Depreciation charges were
7% higher than estimates pursuant to Companies Act 2013 becoming effective on
1st April, 2014. Interest cost increased 7% QoQ due to higher interest on term
loans. Consolidated PBT (before EO) increased 14% YoY (-32% QoQ) to INR16.9b,
23% below estimates as a combined effect of lower EBITDA, higher interest and
depreciation charges. Adjusted PAT declined 47% YoY (-45% YoY) to INR6b (v/s
est. of INR13.2b).
INR16b cash inflow from asset sales:
Extra-ordinary items dragged reported
consolidated PAT by net INR2.6b to INR3.4b. There was gain of INR13.1b (INR16b
net cash inflow during the quarter) on sales of investment in Dhamra Port and
impairment of INR15.7b towards investment in Mozambique coal mines.
EPS cut but cash flow outlook intact; Maintain Buy:
Although our consolidated
EBITDA estimates remain unchanged, there is a cut of 27%/ 24% in FY15/ FY16
EPS respectively due to higher interest and depreciation charge. The cash flow
outlook remains intact. Tata Steel is well positioned with new capacities in India
to capitalize on expected acceleration in demand growth. Maintain
Buy.
M.Cap. (INR b) / (USD b) 519.3/8.5
Financials & Valuation (INR Billion)
Y/E Mar
Net Sales
EBITDA
Adj PAT
EPS (INR)
Gr. (%)
RoE (%)
RoCE (%)
P/E (x)
P/BV (x)
EV/EBITDA
( )
2015E 2016E 2017E
1,498.3 1,474.7 1,557.6
190.8
48.1
39.5
11.3
12.6
9.7
13.5
1.6
6.5
196.0
49.4
49.0
24.0
12.4
9.6
10.9
1.4
6.3
222.9
60.6
60.5
23.4
13.6
10.6
8.8
1.2
5.5
Sanjay Jain
(SanjayJain@MotilalOswal.com); +91 22 3982 5412
Investors are advised to refer through disclosures made at the end of the Research Report.