17 October 2014
2QFY15 Results Update | Sector:
Financials
Axis Bank
BSE SENSEX
26,109
Bloomberg
Equity Shares (m)
52-Week Range (INR)
1, 6, 12 Rel. Per (%)
S&P CNX
7,780
AXSB IN
2,359.8
424/202
3/22/56
CMP: INR402
TP: INR527
Buy
M.Cap. (INR b) / (USD b) 948.5/15.4
Financials & Valuation (INR Billion)
Y/E Mar
NII (Rs b)
OP (Rs b)
NP (Rs b)
EPS (Rs)
EPS Gr. (%)
BV/Share
P/E (x)
P/BV (x)
RoE (%)
RoA (%)
2015E 2016E 2017E
141.0
131.5
73.4
31.2
18.0
188.3
12.9
2.1
17.8
1.8
162.7
152.5
86.3
36.7
17.6
219.6
10.9
1.8
17.9
1.8
192.9
181.3
101.6
43.3
17.7
256.3
9.3
1.6
18.1
1.7
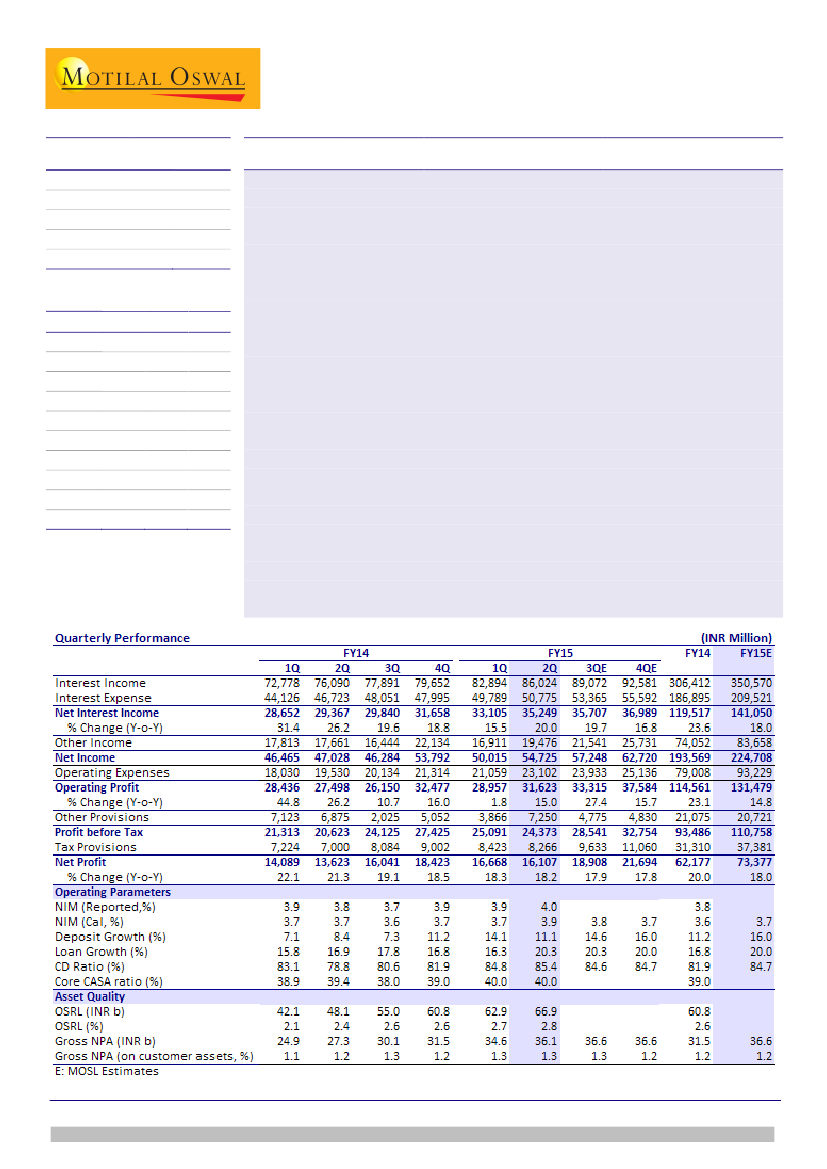
Axis Bank’s (AXSB) 2QFY15 PAT was in line with estimate at INR16.1b (18% YoY).
Higher-than-estimated NIM (+10bp QoQ) compensated for higher provisions.
While overall fees growth remained muted at 11% YoY, retail fees continued to
show strong traction and grew 32% YoY (ex retail, fees grew just 1% YoY).
Gross stress additions increased to INR14.8b (2.9% of loans) v/s INR11.1b in
1QFY15. Aided by strong operating profit, AXSB aggressively provided for NPL
(1.1% credit cost). Led by higher write-offs (INR5.7b), calc.PCR was stable at ~67%.
Strong control over cost of funds (stable QoQ) and improvement in yield on funds
(+10bp QoQ) drove NIM expansion. Despite 70%+ of the incremental loan growth
during the quarter being driven by corporate and international business,
improvement in yield on funds is impressive.
Other highlights:
(1) Avg. daily SA deposit growth of 19% YoY, (2) Avg. daily CASA
ratio was flat QoQ at 40%, (3) Loans grew 20% YoY and 5% QoQ led by strong
growth in corporate and international loans (8% QoQ and 13% YoY), (4) Retail
loans grew 4% QoQ and 27% YoY and (5) Fund-based exposure to Metals and Infra
increased to 18.25% v/s 17.4% a quarter ago.
Maintain Buy:
AXSB has utilized the last three years to build capacity and is geared to
ride the next growth cycle with strong capitalization (12.6% Tier I), healthy RoA (1.7%)
and expanding liability franchise (2,505 branches). While gross slippages and fresh
restructuring increased QoQ in 2QFY15, stress additions are expected to be
manageable. While high exposure to Infra remains a risk, reforms in this space could
ease the pressure. Contingency provisions of INR7.8b (32bp of loans), PCR of 78% and
75bp of credit cost factored in the estimates over FY15E/17E would provide a cushion
to earnings. Maintain
Buy.
Alpesh Mehta
(Alpesh.Mehta@MotilalOswal.com); +91 22 3982 5415
Vallabh Kulkarni
(Vallabh.Kulkarni@MotilalOswal.com); +91 22 3982 5430
Investors are advised to refer through disclosures made at the end of the Research Report.

Axis Bank
Quarterly Performance: PAT in-line with estimates
Y/E March
Net Interest Income
% Change (YoY)
Other Income
Net Income
Operating Expenses
Operating Profit
% Change (YoY)
Other Provisions
Profit before Tax
Tax Provisions
Net Profit
% Change (YoY)
2QFY15A
35,249
20
19,476
54,725
23,102
31,623
15
7,250
24,373
8,266
16,107
18
2QFY15E
33,239
13
19,265
52,504
23,102
29,402
7
5,335
24,067
8,063
16,005
17
Var. (%)
6
1
4
0
8
36
1
3
1
Comments
NIMs +10bp QoQ - a +ve surprise; Loan growth higher than
expected
Fees inline with expectation
Strong control over opex despite higher share of retail business
Credit cost elevated at 1.1%
Higher provisions offset by strong NIMs
Source: Company, MOSL
NIM expansion of 10bp QoQ – a positive surprise
NIM for 2QFY15 came in at 3.97% (+9bp QoQ; 17bp above estimate). The
Management expect some
improvement in NIM was largely led by a 10bp increase in yield on funds.
moderation in NIM in
Strong control over cost of funds (stable QoQ) led by improvement in liability
2HFY15
profile continued. SA deposits increased 20% YoY (+7% QoQ) and CA deposits
grew 8% YoY (+14% QoQ). CASA deposits grew ~10% QoQ, resulting in
calculated CASA ratio improving to 45% from 42% in 1QFY15. Average daily
CASA ratio remained stable QoQ at 40%.
Retail term deposits grew 43% YoY to comprise 62% of overall term deposits.
(Ex-FCNRB growth 30%+ YoY).
Gross stress addition, though higher, within FY15 guidance of INR65b
Gross stress additions
increased to INR14.8b
in 2QFY15
In 2QFY15, gross slippages came in at INR9.1b (annualized slippage ratio of
1.8%) v/s INR6.3b in 1QFY15. Fresh addition to restructured loans were at
INR5.7b, hence gross stress addition for the quarter came in at INR14.8b (2.9%
of loans annualized) v/s INR11.0b (2.23%) in 1QFY15.
Upgrades and recoveries were INR1.6b as compared to INR1.0b in 1QFY15 and
AXSB wrote-off INR6.0b loans. Resultantly, GNPA in absolute terms increased
4% QoQ and in percentage terms stood at 1.3% of customer assets (flat QoQ).
PCR was largely stable QoQ at 78%. NNPA stood at 0.4% of customer assets.
O/s standard restructured loan (net of provisions) stood at INR66.9b, i.e. 2.8% of
customer assets. Management continues to guide for gross stress addition of
INR65b for FY15 on the assumption of moderate economic recovery.
During the quarter credit cost came in at 1.1% of loans. Bank did not utilize any
contingency provisions and cumulative contingent provisions stood at INR7.8b
(32bp of loans).
Fees growth muted - continues to trail asset growth
Fee income grew 10% YoY and continues to trail asset growth of the bank. Fees
from retail banking were strong at 32% YoY, driven by strong traction in income
from retail loans processing.
Large and mid corporate fees continued to remain weak (+7% YoY and +34%
QoQ on lower base).
17 October 2014
2

Axis Bank
Large corporate grew by
13% YoY; highest in 8
quarters
Pick up in corporate book growth; Momentum in retail continues
Loan portfolio grew 20% YoY (5% QoQ), driven by pick up in corporate growth
and continued momentum in retail loans.
Corporate segment grew 8% QoQ and 13% YoY and now forms 45.5% of the
loan book.
Retail loans grew 27% YoY and 4% QoQ. Housing loans formed 53% (flat QoQ) of
the retail loans. Management mentioned that focus would remain on high
yielding personal loans/credit card and LAP.
Conference Call highlights
Loan growth and retail business related
Expect traction in corporate loans to pick up in 2H; Focusing more on working
capital lending and transaction banking; Growth during the quarter led by loan
takeover
Inventory financing business is a part of SME loans; Mix of Auto loans: Car (65%)
and CV (35%)
Retail fees growth:
Loans related +32%; Third party products +21% and Retail
liabilities +13%.
New retail customer assets origination:
1/3rd from branches, 1/3rd from own
customers (cross sell but not from branches) and rest from outsiders
Top 10 cities forms 55% of the housing loans.
ROE in retail business is slightly lower than overall ROE currently. With scale
benefit retail ROE is expected to coverage to overall bank ROE next 2-3years.
Asset quality related
Bank has negligible direct exposure to coal blocks which have been de-allocated;
Some indirect impact on Power and Metal exposure; for indirect metal exposure
DSCR is good and exposure is largely towards operational projects
Less than 8% exposure to top stress corporate (down 175-200bp YoY) groups.
No new exposures to these groups, reduction is largely due to growth in other
segment. Repayments negligible
45% of power sector exposure towards operational units (largely same from
beginning of the year)
NPAs from RL during the quarter stood at INR1.94b
Margins related
NIMs to moderate though remain above 3.5%
Yield on assets improved by 11bp QoQ and Cost of Funds declined by 2bp QoQ;
Blended yield on retail loans 11.4-11.5%; Yield on corporate loans (including
international loans) 10.35%
85-90% of the loans are linked to Base Rate
Guidance for FY15
a) NIM is expected to moderate though will remain at 3.5%+ b) Fee income
growth is expected to be low double digit c) Credit cost is expected to be 75-
80bp d) Gross stress addition of INR65b and e) Loan growth 20%+
17 October 2014
3

Axis Bank
Valuation and view
Maintain buy with a
target price of
INR527 (2.4x FY16 BV)
AXSB is geared up to ride the next growth cycle with (1) strong capitalization
(12.6% Tier I), healthy ROA (1.7%) and expanding liability franchise (2,505
branches). Leveraging on the strong distribution network AXSB increased the
share of retail deposits and CASA increased to 79% as compared 59% in FY11
and retail loans now form 39% of loans (v/s 19% in FY11). Increased share of
retail loans and strong SME business would help reduce revenue volatility.
Benefit of structural improvement in liability profile and incremental growth in
high yielding retail segment is expected to keep NIMs strong. We factor in
10bp/5bp decline in NIMs in FY16/FY17 as growth in corporate loans to pick up.
While gross slippages and fresh restructuring increased in 2QFY15; we believe
stress additions will remain manageable.
While high exposure to Infra remains a risk, strong mandate to the government
and expectation of reforms by government/RBI could ease risk in infrastructure
lending. Contingency provisions of INR 7.8b (32bp of loans), PCR of 78% and
75bp of credit cost factored in the estimates over FY15E/17E would provide a
cushion to earnings. We expect PAT CAGR of ~18% over FY14/17.
We upgrade FY15E/FY16E earnings by 2%/4% to factor in better NIM performance
INR b
Old Estimates
FY15
FY16
FY17
Net Interest Income 136.2 155.2 185.8
Other Income
83.7
98.9
117.1
Total Income
219.9 254.1 302.8
Operating Expenses 92.7
109.4 129.1
Operating Profits
127.2 144.7 173.7
Provisions
18.5
19.3
24.6
PBT
108.7 125.3 149.1
Tax
36.4
42.0
50.0
PAT
72.3
83.4
99.2
Loans
2,715 3,366 4,208
Deposits
3,203 3,907 4,767
Margins (%)
3.56
3.45
3.44
Credit Cost (%)
0.84
0.72
0.72
RoA (%)
1.76
1.73
1.72
RoE (%)
17.50 17.40 17.82
Revised Estimates
FY15
FY16
FY17
141.0 162.7 192.9
83.7
99.8
118.2
224.7 262.5 311.1
93.2
110.0 129.8
131.5 152.5 181.3
20.7
22.2
28.0
110.8 130.3 153.4
37.4
44.0
51.8
73.4
86.3
101.6
2,761 3,423 4,279
3,259 3,976 4,851
3.67
3.57
3.53
0.88
0.77
0.76
1.78
1.77
1.74
17.75 17.93 18.11
Change (%)
FY15 FY16 FY17
3.6
4.8
3.9
-0.1 1.0
1.0
2.2
3.3
2.8
0.6
0.6
0.6
3.4
5.4
4.4
11.9 15.0 13.7
1.9
3.9
2.8
2.7
4.7
3.6
1.5
3.5
2.5
1.7
1.7
1.7
1.8
1.8
1.8
Source: Company, MOSL
17 October 2014
4

Axis Bank
One year forward P/BV
5.0
4.0
3.0
2.0
1.0
0.0
2.1
0.9
2.0
PB (x)
Peak(x)
Avg(x)
Min(x)
4.0
One year forward P/E
30
21
12
5.7
3
12.5
12.1
PE (x)
Peak(x)
Avg(x)
Min(x)
23.6
Source: Company, MOSL
DuPont Analysis: Return Ratios expected to remain stable over FY14/17
Y/E MARCH
Net Interest Income
Fee income
Fee to core Income
Core Income
Operating Expenses
Cost to Core Income
Employee cost
Employee to total exp
Others
Core Operating Profit
Trading and others
Operating Profit
Provisions
NPA
Others
PBT
Tax
Tax Rate
RoA
Leverage (x)
RoE
FY06
2.27
1.28
36.03
3.54
1.86
52.56
0.55
29.51
1.31
1.68
0.39
2.07
0.40
0.39
0.01
1.67
0.56
33.68
1.11
16.57
18.37
FY07
2.39
1.45
37.74
3.84
1.98
51.50
0.62
31.40
1.35
1.86
0.20
2.06
0.43
0.32
0.11
1.62
0.55
33.86
1.07
19.63
21.04
FY08
2.83
1.64
36.64
4.46
2.36
52.81
0.73
31.10
1.62
2.11
0.33
2.43
0.63
0.54
0.09
1.80
0.63
34.94
1.17
15.03
17.61
FY09
2.87
1.90
39.90
4.77
2.22
46.60
0.78
34.91
1.45
2.55
0.35
2.90
0.73
0.70
0.03
2.16
0.75
34.82
1.41
13.55
19.13
FY10
3.05
1.78
36.90
4.83
2.26
46.78
0.76
33.85
1.49
2.57
0.62
3.19
0.85
0.86
-0.01
2.35
0.81
34.71
1.53
12.51
19.15
FY11
3.10
1.79
36.61
4.89
2.26
46.16
0.76
33.77
1.50
2.63
0.40
3.03
0.60
0.54
0.07
2.43
0.83
34.02
1.60
12.08
19.34
FY12
3.04
1.79
37.09
4.82
2.27
47.13
0.79
34.63
1.49
2.55
0.26
2.81
0.43
0.42
0.02
2.38
0.77
32.53
1.61
12.64
20.29
FY13
3.09
1.76
36.35
4.85
2.21
45.53
0.76
34.38
1.45
2.64
0.33
2.97
0.56
0.47
0.09
2.41
0.76
31.42
1.65
11.20
18.53
FY14
3.30
1.65
33.37
4.96
2.18
44.05
0.72
32.93
1.46
2.77
0.39
3.17
0.58
0.49
0.09
2.58
0.87
33.49
1.72
10.15
17.43
FY15E
FY16E
FY17E
3.41
3.34
3.30
1.63
1.68
1.69
32.37
33.51
33.83
5.05
5.02
4.98
2.26
2.26
2.22
44.70
44.96
44.52
0.74
0.74
0.73
32.93
32.93
32.93
1.51
1.51
1.49
2.79
2.76
2.76
0.39
0.37
0.33
3.18
3.13
3.10
0.50
0.46
0.48
0.54
0.49
0.50
-0.04
-0.03
-0.03
2.68
2.67
2.62
0.90
0.90
0.88
33.75
33.75
33.75
1.78
1.77
1.74
9.99
10.13
10.43
17.75
17.93
18.11
Source: Company, MOSL
17 October 2014
5

Axis Bank
Quarterly DuPont Analysis: Return ratios impacted QoQ by higher NPA provisions (%)
Net Interest Income
Fee based income
Fee to Core Income
Core Income
Operating Expneses
Cost to Core Income
Employee expenses
Other
Core Operating Profits
Trading and others
Operating Profits
Provisions
NPA
Others
PBT
Taxes
Tax Rate
RoA
Leverage (x)
RoE
1QFY13
3.03
1.61
34.69
4.64
2.16
46.49
0.81
1.35
2.49
0.25
2.73
0.36
0.46
-0.10
2.37
0.77
32.34
1.60
12.22
19.61
2QFY13
3.14
1.81
36.59
4.96
2.35
47.46
0.78
1.57
2.61
0.34
2.94
0.69
0.63
0.06
2.25
0.74
32.68
1.52
11.96
18.16
3QFY13
3.21
1.81
36.04
5.02
2.25
44.83
0.79
1.46
2.77
0.27
3.04
0.50
0.52
-0.02
2.54
0.81
31.78
1.73
11.89
20.62
4QFY13
3.23
1.96
37.78
5.20
2.27
43.71
0.73
1.54
2.92
0.47
3.40
0.72
0.34
0.38
2.67
0.79
29.45
1.89
10.97
20.69
1QFY14
3.40
1.56
31.49
4.96
2.14
43.11
0.76
1.38
2.82
0.55
3.37
0.84
0.71
0.14
2.53
0.86
33.89
1.67
9.91
16.56
2QFY14
3.43
1.67
32.78
5.10
2.28
44.70
0.75
1.53
2.82
0.39
3.21
0.80
0.57
0.23
2.41
0.82
33.94
1.59
9.63
15.31
3QFY14
3.36
1.64
32.79
5.00
2.27
45.35
0.74
1.53
2.73
0.21
2.94
0.23
0.42
-0.19
2.72
0.91
33.51
1.81
9.62
17.37
4QFY14
3.41
1.92
35.99
5.33
2.30
43.10
0.71
1.59
3.03
0.47
3.50
0.54
0.35
0.19
2.95
0.97
32.82
1.98
9.79
19.43
1QFY15
2QFY15
3.47
3.64
1.45
1.64
29.39
31.10
4.92
5.29
2.21
2.39
44.92
45.16
0.79
0.81
1.42
1.57
2.71
2.90
0.33
0.37
3.04
3.27
0.41
0.75
0.42
0.66
-0.02
0.09
2.63
2.52
0.88
0.85
33.57
33.91
1.75
1.66
9.74
9.46
17.04
15.75
Source: Company, MOSL
17 October 2014
6

Axis Bank
Story in charts
NIMs improved 9bp QoQ…
NIMs (%)
…helped by stable cost of funds (%)
3.3 3.8 3.8 3.6 3.4 3.5 3.6 3.7 3.9 3.8 3.7 3.9 3.9 4.0
Source: Company, MOSL
Loan growth picked up during the quarter
Loans (INR b)
21 27 20 19
30
YoY Growth (%)
Continued improvement in liability mix (%)
Bulk Dep. Proportion
45
40
35
30
25
20
Average Daily CASA Ratio
23 21
16 16 17 18 17 16 20
Source: Company, MOSL
Fee income growth remains muted
Fee Income (INR m)
1.78 1.86 1.89
1.93
1.61
1.81 1.81
1.96
Fee as % of avg assets
1.92
1.67 1.64
1.61
1.56
1.45
Strong control over cost despite rise in retail business
Cost to avg assets
48.0
46.8
44.9
48.6
46.5 47.5
44.8
Cost to C/Income
45.3
44.9 45.2
43.1
44.7
43.7
43.1
10.6 11.2 12.3 13.4 11.6 13.4 14.1 16.2 13.2 14.3 14.6 17.8 13.8 15.5
2.2 2.4 2.3 2.4 2.2 2.4 2.3 2.3 2.1 2.3 2.3 2.3 2.2 2.4
Source: Company, MOSL
17 October 2014
7

Axis Bank
Story in charts
Slippages have risen QoQ for three straight quarters
Slippages (INR b)
1.79
1.09
1.79
1.73
1.45
1.44 1.38
0.94
4.96 5.35 5.14 4.56
6.28 5.41
3.98
6.81 6.18 5.89
0.61
6.26
3.01
9.11
Slippage Ratio (%)
1.59
1.81
1.44 1.31
1.26
GNPA up 4% QoQ; PCR remains flat
Gross NPA (%)
Net NPA (%)
2.96
Source: Company, MOSL
Fresh restructuring of INR5.7b…
Restructured Portfolio (INR b)
Rest Port as a % of customer assets
2.0 2.0 2.1 1.9 1.9 1.9
2.4
2.1
2.5 2.5
...hence gross stress addition increased QoQ
Gross Stress Addition (INR b)
As a % of Loans (annualized)
3.8
3.3
3.2
2.9
2.9 2.7 3.1
2.8 2.9
2.7 2.4 2.8
2.2
1.5
4.0 8.1 8.3 11.0 10.8 9.5 9.1 11.9 13.7 16.5 12.6 14.2 11.1 14.8
1.6
1.4 1.5 1.6
21.5 24.1 27.0 30.6 38.3 40.7 42.6 43.7 42.1 48.1 55.0 60.8 62.9 66.9
Source: Company, MOSL
Credit cost increased sharply QoQ (bps annualized)
Expect to add ~200 branches in 2HFY15
Source: Company, MOSL
17 October 2014
8

Axis Bank
Quarterly Snapshot
FY13
INR m
Profit and Loss
Interest Income
Loans
Investment
Others
Interest Expenses
Net Interest Income
Other Income
Trading profits
Fee Income
Miscellaneous Income
Total Income
Operating Expenses
Employee
Others
Operating Profits
Provisions
PBT
Taxes
PAT
Asset Quality
GNPA
NNPA
GNPA (%)
NNPA (%)
PCR (Calculated, %)
PCR (Reported, %)
Slippages
Slippage Ratio
Prov. for NPA in qtr
Credit Cost
Restructured loans
% of Loans
Ratios (%)
Fees to Total Income
Cost to Core Income
Tax Rate
Loan/Deposit
Margins - Cal (%)
Yield on loans
Yield On Investments
Yield on Funds
Cost of funds
Margins
Margins - Reported (%)
Cost of Funds
Margins
Franchise
Branches
ATM
1Q
64,829
46,245
18,063
520
43,030
21,799
13,355
1,502
11,580
273
35,154
15,517
5,826
9,691
19,637
2,588
17,048
5,513
11,535
20,917
6,049
1.1
0.3
71
79
4,560
1.4
2,610
0.6
38,270
2.2
32.9
46.5
32.3
76.9
10.9
8.0
9.8
6.7
3.3
6.7
3.4
1,681
10,337
2Q
66,872
47,363
18,966
544
43,603
23,269
15,931
2,070
13,430
431
39,200
17,417
5,779
11,638
21,783
5,094
16,688
5,453
11,235
21,910
6,542
1.1
0.3
70
80
6,280
1.8
4,070
0.9
40,680
2.4
34.3
47.5
32.7
73.1
11.0
8.1
9.9
6.6
3.5
6.5
3.5
1,741
10,297
3Q
69,649
49,067
20,143
440
44,701
24,948
16,154
1,592
14,058
504
41,102
17,487
6,151
11,336
23,615
3,868
19,747
6,275
13,472
22,753
6,787
1.1
0.3
70
81
5,410
1.5
3,250
0.7
42,570
2.4
34.2
44.8
31.8
73.4
11.2
8.0
9.9
6.5
3.6
6.5
3.6
1,787
10,363
4Q
70,476
48,988
20,297
1,191
43,829
26,647
20,072
2,378
16,180
1,514
46,718
18,721
6,014
12,707
27,997
5,954
22,044
6,492
15,552
23,934
7,041
1.1
0.3
71
79
3,980
0.9
1,450
0.3
43,680
2.2
34.6
43.7
29.5
78.0
10.4
7.6
9.4
6.0
3.5
6.5
3.7
1,947
11,245
1Q
72,778
51,891
20,153
734
44,126
28,652
17,813
4,399
13,170
245
46,465
18,030
6,431
11,599
28,436
7,123
21,313
7,224
14,089
24,897
7,897
1.1
0.4
68
80
6,810
1.6
5,720
1.2
42,110
2.1
28.3
43.1
33.9
83.1
10.5
7.4
9.3
6.0
3.7
6.3
3.9
2,021
11,488
2Q
76,090
53,943
21,425
722
46,723
29,367
17,661
49
14,320
3,292
47,028
19,530
6,439
13,090
27,498
6,875
20,623
7,000
13,623
27,345
8,383
1.2
0.4
69
80
6,180
1.4
2,870
0.6
48,070
2.4
30.5
44.7
33.9
78.8
10.8
7.7
9.6
6.3
3.7
6.3
3.8
2,225
11,796
FY14
3Q
77,891
55,573
21,104
1,215
48,051
29,840
16,444
347
14,560
1,538
46,284
20,134
6,551
13,583
26,150
2,025
24,125
8,084
16,041
30,082
10,034
1.3
0.4
67
78
5,890
1.3
2,920
0.6
55,000
2.6
31.5
45.3
33.5
80.6
10.8
7.3
9.5
6.3
3.6
6.3
3.7
2,321
12,328
4Q
79,652
58,098
20,749
805
47,995
31,658
22,134
2,170
17,800
2,164
53,792
21,314
6,593
14,722
32,477
5,052
27,425
9,002
18,423
31,464
10,246
1.2
0.4
67
78
3,010
0.6
1,440
0.3
60,790
2.6
33.1
43.1
32.8
81.9
10.5
7.4
9.3
6.0
3.7
6.2
3.9
2,402
12,922
1Q
82,894
60,853
21,023
1,018
49,789
33,105
16,911
2,603
13,780
527
50,015
21,059
7,518
13,541
28,957
3,866
25,091
8,423
16,668
34,633
11,135
1.3
0.4
68
77
6,260
1.3
3,350
0.6
62,890
2.7
27.6
44.9
33.6
84.8
10.6
7.6
9.4
6.1
3.7
6.2
3.9
2,421
12,930
FY15
2Q
86,024
62,559
22,048
1,416
50,775
35,249
19,476
2,710
15,910
856
54,725
23,102
7,860
15,242
31,623
7,250
24,373
8,266
16,107
36,131
11,798
1.3
0.4
67
78
9,110
1.8
6380
0.9
66,900
2.8
29.1
45.2
33.9
85.4
10.6
7.9
9.6
6.1
3.9
6.2
4.0
2
34
19
4
18
-2
9
-22
21
-5
-22
21
-6
18
Variation (%)
QoQ
YoY
4
3
5
39
2
6
15
4
15
62
9
10
5
13
9
88
-3
-2
-3
4
6
0
0
-50
100
46
54.7
-100
26.8
6
3
13
16
3
96
9
20
10
NM
11
-74
16
18
22
16
15
5
18
18
18
32
41
15
7
-200
-200
47
37.4
-100
27.5
39
37
2,505
13,146
Source: Company, MOSL
17 October 2014
9

Axis Bank
Quarterly Snapshot continued
FY13
INR b
Balance Sheet
Loans
Investments
Customer Assets
Deposits
Borrowings
Total Assets
Deposits Break Up
Retail Deposits
% of total Deposits
Other Deposits
% of total Deposits
Deposits Break Up
CASA Deposits
% of total Deposits
Savings
% of total Deposits
Current
% of total Deposits
Term Deposits
% of total Deposits
Ratings Profile
Large and Mid Corp
AAA
AA
A
BBB
<BBB and below
SME
SME1
SME2
SME3
SME4
SME 5-8
1Q
1,711
880
1,951
2,226
341
2,894
1,062
48
1,164
52
869
39
528
24
342
15
1,357
61
2Q
1,721
997
1,983
2,356
328
3,027
1,126
48
1,230
52
955
41
562
24
393
17
1,401
59
3Q
1,795
1,009
2,057
2,445
388
3,189
1,172
48
1,273
52
978
40
575
24
402
16
1,467
60
4Q
1,970
1,137
2,200
2,526
440
3,406
1,251
50
1,275
50
1,121
44
638
25
483
19
1,405
56
1Q
1,982
1,033
2,256
2,384
498
3,341
1,283
54
1,101
46
1,011
42
633
27
378
16
1,373
58
2Q
2,013
1,184
2,266
2,554
479
3,514
1,344
53
1,210
47
1,095
43
665
26
430
17
1,459
57
FY14
3Q
2,115
1,122
2,389
2,624
484
3,594
1,518
58
1,106
42
1,117
43
696
27
421
16
1,507
57
4Q
2,301
1,135
2,562
2,809
503
3,832
1,620
58
1,189
42
1,265
45
778
28
487
17
1,545
55
1Q
2,305
1,079
2,553
2,720
543
3,794
1,680
62
1,040
38
1,152
42
746
27
407
15
1,568
58
FY15
2Q
2,422
1,143
2,685
2,837
557
3,950
1,772
62
1,065
38
1,264
45
799
28
465
16
1,574
55
Variation (%)
QoQ
YoY
5
6
5
4
3
4
5
2
20
-3
18
11
16
12
32
-12
10
7
14
0
15
20
8
8
6
18
40
33
3
5
18
57
12
8
7
16
39
34
4
5
18
59
10
8
7
16
38
34
5
7
19
56
10
8
9
16
37
32
6
6
16
58
12
8
12
14
37
31
6
6
16
58
12
8
11
15
36
32
6
6
16
58
13
7
11
14
37
31
7
7
16
58
12
7
11
15
35
30
9
7
15
58
13
7
12
16
33
31
8
6
16
56
14
8
11
15
35
30
9
7
16
57
12
8
Source: Company, MOSL
17 October 2014
10

Axis Bank
EPS: MOSL forecast v/s consensus (INR)
MOSL
Forecast
FY15
FY16
31.2
36.7
Consensus
Forecast
30.6
37.0
Variation
(%)
2.0
-0.8
Stock performance (1-year)
Shareholding pattern (%)
Jun-14
Promoter
DII
FII
29.2
11.1
51.9
Mar-14
29.5
10.0
52.1
8.4
Jun-13
33.9
8.8
48.8
8.5
Others
7.9
Note: FII Includes depository receipts
17 October 2014
11

Axis Bank
Financials and valuations
Income Statements
Y/E Mar
Interest Income
Interest Expense
Net Interest Income
Change (%)
Non Interest Income
Net Income
Change (%)
Operating Expenses
Pre Provision Profits
Change (%)
Provisions (excl tax)
PBT
Tax
Tax Rate (%)
Profits for Equity SH
Change (%)
Equity Dividend (Incl tax)
Core PPP*
Change (%)
2014
306.4
186.9
119.5
23.6
74.1
193.6
19.4
79.0
114.6
23.1
21.1
93.5
31.3
33.5
62.2
20.0
11.0
109.5
29.8
2015E
350.6
209.5
141.0
18.0
83.7
224.7
16.1
93.2
131.5
14.8
20.7
110.8
37.4
33.8
73.4
18.0
12.9
119.5
9.1
(INR Billion)
2016E
407.5
244.8
162.7
15.3
99.8
262.5
16.8
110.0
152.5
16.0
22.2
130.3
44.0
33.8
86.3
17.6
15.1
139.0
16.4
2017E
488.9
296.0
192.9
18.6
118.2
311.1
18.5
129.8
181.3
18.9
28.0
153.4
51.8
33.8
101.6
17.7
17.8
166.3
19.7
Ratios
Y/E Mar
Spreads Analysis (%)
Avg. Yield-Earning Assets
Avg. Yield on loans
Avg. Yield on Investments
Avg. Cost-Int. Bear. Liab.
Avg. Cost of Deposits
Interest Spread
Net Interest Margin
Profitability Ratios (%)
RoE
RoA
Int. Expense/Int.Income
Fee Income/Net Income
Non Int. Inc./Net Income
Efficiency Ratios (%)
Cost/Income*
Empl. Cost/Op. Exps.
Busi. per Empl. (Rs m)
NP per Empl. (Rs lac)
Asset-Liabilty Profile (%)
Loans/Deposit Ratio
CASA Ratio
Investment/Deposit Ratio
G-Sec/Investment Ratio
CAR
Tier 1
2014
9.1
10.3
7.3
6.0
5.8
3.2
3.6
17.4
1.7
61.0
35.6
38.3
41.5
32.9
119.6
1.5
81.9
45.0
40.4
60.9
16.1
12.6
2015E
9.1
10.1
7.5
5.9
5.6
3.2
3.7
17.8
1.8
59.8
31.9
37.2
43.2
32.9
115.6
1.5
84.7
45.5
39.0
64.1
15.7
12.7
2016E
8.9
9.9
7.2
5.8
5.4
3.1
3.6
17.9
1.8
60.1
32.9
38.0
43.5
32.9
115.9
1.5
86.1
44.2
35.2
71.1
14.8
12.3
2017E
8.9
9.8
7.1
5.8
5.4
3.1
3.5
18.1
1.7
60.5
33.2
38.0
43.2
32.9
124.1
1.5
88.2
44.2
31.7
78.8
14.0
11.8
Balance Sheet
Y/E Mar
Equity Share Capital
Reserves & Surplus
Net Worth
Deposits
Change (%)
of which CASA Dep
Change (%)
Borrowings
Other Liabilities & Prov.
Total Liabilities
Current Assets
Investments
Change (%)
Loans
Change (%)
Fixed Assets
Other Assets
Total Assets
2014
4.7
377.5
382.2
2,809.4
11.2
1,264.6
12.8
502.9
137.9
3,832.4
282.4
1,135.5
-0.2
2,300.7
16.8
24.1
89.8
3,832.4
2015E
4.7
439.9
444.6
3,259.0
16.0
1,482.2
17.2
559.4
166.1
4,429.0
267.3
1,271.7
12.0
2,760.8
20.0
25.9
103.3
4,429.0
(INR Billion)
2016E
4.7
513.2
517.9
3,975.9
22.0
1,759.0
18.7
623.4
199.7
5,317.0
347.2
1,398.9
10.0
3,423.4
24.0
28.7
118.8
5,317.0
2017E
4.7
599.6
604.3
4,850.6
22.0
2,144.0
21.9
696.0
240.1
6,391.1
403.9
1,538.8
10.0
4,279.2
25.0
32.5
136.6
6,391.1
Valuation
Y/E Mar
Book Value (INR)
Change (%)
Price-BV (x)
Adjusted BV (INR)
Price-ABV (x)
EPS (INR)
Change (%)
Price-Earnings (x)
Dividend Per Share (INR)
Dividend Yield (%)
2014
161.8
15.6
2.5
158.9
2.5
26.5
19.6
15.2
4.0
1.0
2015E
188.3
16.4
2.1
183.8
2.2
31.2
18.0
12.9
4.7
1.2
2016E
219.6
16.6
1.8
213.9
1.9
36.7
17.6
10.9
5.5
1.4
2017E
256.3
16.7
1.6
250.2
1.6
43.3
17.7
9.3
6.5
1.6
Asset Quality
Y/E Mar
GNPA
NNPA
GNPA Ratio
NNPA Ratio
PCR (Excl Tech. write off)
PCR (Incl Tech. Write off)
2014
31.5
10.2
1.4
0.4
67.4
78.0
2015E
36.6
16.4
1.3
0.6
55.2
74.4
(INR Billion)
2016E
42.6
20.3
1.2
0.6
52.4
72.7
2017E
51.6
22.3
1.2
0.5
56.9
74.0
17 October 2014
12

Axis Bank
NOTES
17 October 2014
13

Disclosures
This research report has been prepared by MOSt to provide information about the company(ies) and sector(s), if any, covered in the report and may be distributed by it and/or its affiliated company(ies). This
Axis Bank
report is for personal information of the select recipient and does not construe to be any investment, legal or taxation advice to you. This research report does not constitute an offer, invitation or inducement to
invest in securities or other investments and Motilal Oswal Securities Limited (hereinafter referred as MOSt) is not soliciting any action based upon it. This report is not for public distribution and has been
furnished to you solely for your general information and should not be reproduced or redistributed to any other person in any form. This report does not constitute a personal recommendation or take into
account the particular investment objectives, financial situations, or needs of individual clients. Before acting on any advice or recommendation in this material, investors should consider whether it is suitable
for their particular circumstances and, if necessary, seek professional advice. The price and value of the investments referred to in this material and the income from them may go down as well as up, and
investors may realize losses on any investments. Past performance is not a guide for future performance, future returns are not guaranteed and a loss of original capital may occur.
MOSt and its affiliates are a full-service, integrated investment banking, investment management, brokerage and financing group. We and our affiliates have investment banking and other business
relationships with a significant percentage of the companies covered by our Research Department Our research professionals provide important input into our investment banking and other business selection
processes. Investors should assume that MOSt and/or its affiliates are seeking or will seek investment banking or other business from the company or companies that are the subject of this material and that
the research professionals who were involved in preparing this material may participate in the solicitation of such business. The research professionals responsible for the preparation of this document may
interact with trading desk personnel, sales personnel and other parties for the purpose of gathering, applying and interpreting market information. Our research professionals are paid in part based on the
profitability of MOSt which include earnings from investment banking and other business. MOSt generally prohibits its analysts, persons reporting to analysts, and members of their households from
maintaining a financial interest in the securities or derivatives of any companies that the analysts cover. Additionally, MOSt generally prohibits its analysts and persons reporting to analysts from serving as an
officer, director, or advisory board member of any companies that the analysts cover. Our salespeople, traders, and other professionals or affiliates may provide oral or written market commentary or trading
strategies to our clients that reflect opinions that are contrary to the opinions expressed herein, and our proprietary trading and investing businesses may make investment decisions that are inconsistent with
the recommendations expressed herein. In reviewing these materials, you should be aware that any or all o the foregoing, among other things, may give rise to real or potential conflicts of interest . MOSt and
its affiliated company(ies), their directors and employees may; (a) from time to time, have a long or short position in, and buy or sell the securities of the company(ies) mentioned herein or (b) be engaged in
any other transaction involving such securities and earn brokerage or other compensation or act as a market maker in the financial instruments of the company(ies) discussed herein or act as an advisor or
lender/borrower to such company(ies) or may have any other potential conflict of interests with respect to any recommendation and other related information and opinions.
Unauthorized disclosure, use, dissemination or copying (either whole or partial) of this information, is prohibited. The person accessing this information specifically agrees to exempt MOSt or any of its
affiliates or employees from, any and all responsibility/liability arising from such misuse and agrees not to hold MOSt or any of its affiliates or employees responsible for any such misuse and further agrees to
hold MOSt or any of its affiliates or employees free and harmless from all losses, costs, damages, expenses that may be suffered by the person accessing this information due to any errors and delays. The
information contained herein is based on publicly available data or other sources believed to be reliable. Any statements contained in this report attributed to a third party represent MOSt’s interpretation of the
data, information and/or opinions provided by that third party either publicly or through a subscription service, and such use and interpretation have not been reviewed by the third party. This Report is not
intended to be a complete statement or summary of the securities, markets or developments referred to in the document. While we would endeavor to update the information herein on reasonable basis, MOSt
and/or its affiliates are under no obligation to update the information. Also there may be regulatory, compliance, or other reasons that may prevent MOSt and/or its affiliates from doing so. MOSt or any of its
affiliates or employees shall not be in any way responsible and liable for any loss or damage that may arise to any person from any inadvertent error in the information contained in this report. MOSt or any of
its affiliates or employees do not provide, at any time, any express or implied warranty of any kind, regarding any matter pertaining to this report, including without limitation the implied warranties of
merchantability, fitness for a particular purpose, and non-infringement. The recipients of this report should rely on their own investigations.
Recipients who are not institutional investors should seek advice of their independent financial advisor prior to taking any investment decision based on this report or for any necessary explanation of its
contents.
MOSt and/or its affiliates and/or employees may have interests/positions, financial or otherwise in the securities mentioned in this report. To enhance transparency, MOSt has incorporated a Disclosure of
Interest Statement in this document. This should, however, not be treated as endorsement of the views expressed in the report.
Disclosure of Interest Statement
Analyst ownership of the stock
AXIS BANK LTD
No
Analyst Certification
The views expressed in this research report accurately reflect the personal views of the analyst(s) about the subject securities or issues, and no part of the compensation of the research analyst(s) was, is, or
will be directly or indirectly related to the specific recommendations and views expressed by research analyst(s) in this report. The research analysts, strategists, or research associates principally responsible
for preparation of MOSt research receive compensation based upon various factors, including quality of research, investor client feedback, stock picking, competitive factors and firm revenues.
Regional Disclosures (outside India)
For U.K.
This report is not directed or intended for distribution to or use by any person or entity resident in a state, country or any jurisdiction, where such distribution, publication, availability or use would be contrary to
law, regulation or which would subject MOSt & its group companies to registration or licensing requirements within such jurisdictions.
This report is intended for distribution only to persons having professional experience in matters relating to investments as described in Article 19 of the Financial Services and Markets Act 2000 (Financial
Promotion) Order 2005 (referred to as "investment professionals"). This document must not be acted on or relied on by persons who are not investment professionals. Any investment or investment activity to
which this document relates is only available to investment professionals and will be engaged in only with such persons.
Motilal Oswal Securities Limited (MOSL) is not a registered broker - dealer under the U.S. Securities Exchange Act of 1934, as amended (the"1934 act") and under applicable state laws in the United States.
In addition MOSL is not a registered investment adviser under the U.S. Investment Advisers Act of 1940, as amended (the "Advisers Act" and together with the 1934 Act, the "Acts), and under applicable state
laws in the United States. Accordingly, in the absence of specific exemption under the Acts, any brokerage and investment services provided by MOSL, including the products and services described herein
are not available to or intended for U.S. persons.
This report is intended for distribution only to "Major Institutional Investors" as defined by Rule 15a-6(b)(4) of the Exchange Act and interpretations thereof by SEC (henceforth referred to as "major institutional
investors"). This document must not be acted on or relied on by persons who are not major institutional investors. Any investment or investment activity to which this document relates is only available to major
institutional investors and will be engaged in only with major institutional investors. In reliance on the exemption from registration provided by Rule 15a-6 of the U.S. Securities Exchange Act of 1934, as
amended (the "Exchange Act") and interpretations thereof by the U.S. Securities and Exchange Commission ("SEC") in order to conduct business with Institutional Investors based in the U.S., MOSL has
entered into a chaperoning agreement with a U.S. registered broker-dealer, Motilal Oswal Securities International Private Limited. ("MOSIPL"). Any business interaction pursuant to this report will have to be
executed within the provisions of this chaperoning agreement.
The Research Analysts contributing to the report may not be registered /qualified as research analyst with FINRA. Such research analyst may not be associated persons of the U.S. registered broker-dealer,
MOSIPL, and therefore, may not be subject to NASD rule 2711 and NYSE Rule 472 restrictions on communication with a subject company, public appearances and trading securities held by a research
analyst account.
Motilal Oswal Capital Markets Singapore Pte Limited is acting as an exempt financial advisor under section 23(1)(f) of the Financial Advisers Act(FAA) read with regulation 17(1)(d) of the Financial Advisors
Regulations and is a subsidiary of Motilal Oswal Securities Limited in India. This research is distributed in Singapore by Motilal Oswal Capital Markets Singapore Pte Limited and it is only directed in Singapore
to accredited investors, as defined in the Financial Advisers Regulations and the Securities and Futures Act (Chapter 289), as amended from time to time.
In respect of any matter arising from or in connection with the research you could contact the following representatives of Motilal Oswal Capital Markets Singapore Pte Limited:
Anosh Koppikar
Kadambari Balachandran
Email:anosh.Koppikar@motilaloswal.com
Email : kadambari.balachandran@motilaloswal.com
Contact(+65)68189232
Contact: (+65) 68189233 / 65249115
Office Address:21 (Suite 31),16 Collyer Quay,Singapore 04931
For U.S.
For Singapore
Motilal Oswal Securities Ltd
17 October 2014
Motilal Oswal Tower, Level 9, Sayani Road, Prabhadevi, Mumbai 400 025
Phone: +91 22 3982 5500 E-mail: reports@motilaloswal.com
14