21 October 2014
2QFY15 Results Update | Sector:
Others
UPL
BSE SENSEX
26,576
Bloomberg
Equity Shares (m)
52-Week Range (INR)
1, 6, 12 Rel. Per (%)
S&P CNX
7,928
UPLL IN
428.6
388/149
-4/35/86
CMP: INR327
TP: INR414
Buy
Margin declines, but gross debt continues to reduce
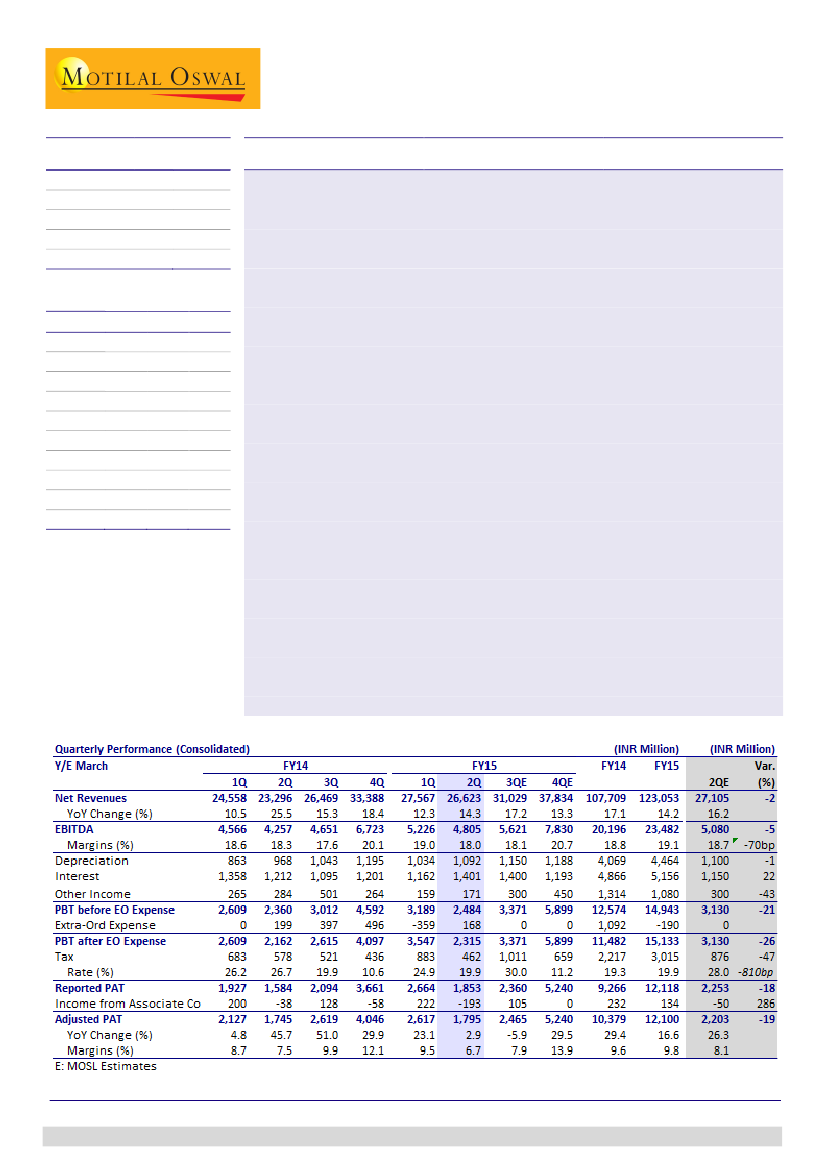
2QFY15 performance is below estimate with revenues of ~INR26.6b (v/s est
INR27.1b), EBITDA margins of 18% (v/s est of 18.7%), and adj. PAT growth of just
3% YoY to ~INR1.8b (v/s est INR2.2b).
Consolidated revenues grew by 14% YoY. India revenues grew of ~7.5% YoY and
international revenue growth of ~16%. International revenues were driven by 27%
growth in EU, ~30% growth in RoW and 20% growth in LatAm. US revenue
declined 12% YoY. While volumes grew ~15%, pricing grew 2% and forex impacted
growth by 2%.
Gross margins of 38.6% were highest in 14 quarters. However, higher other
expenses on promotion of branded products restricted EBITDA margins at 18% (-
30bp YoY). EBITDA grew 13% to ~INR4.8b (v/s est ~INR5.1b).
Working capital increased QoQ by 8 days to ~102 days (-7 day YoY), for inventory
build-up for LatAm. Gross debt reduced further by ~INR1b QoQ, but net debt
increased ~INR3.3b QoQ, due to working capital increase and dividend payout.
FY15 guidance maintained:
FY15 revenue growth of 12-15% (constant currency),
EBITDA margin of 19-20% and tax-rate of 22-25%. Capex maintained at ~INR5.5b.
Key highlights of the analyst meet:
a) US market has de-grew 3-5% due to soft
commodity prices leading to reduced input intensification, b) launched 2 new
products in US - Satellite (Pendimethalin) & Lifeline (Glufosinate), c) DVA Agro
(Brazilian subsidiary) margins are now comparable with average, but expected to
improve further driven by product mix and operating leverage, d) Low commodity
prices and devaluation of Brazilian Real is a concern for Brazil, and e) higher
market access expected through increased registrations in African countries.
We are downgrading our FY15/FY16 EPS by 4%/1% to INR28.2/34.5, to factor in
for higher other expenses and interest cost. The stock trades at very attractive
valuation of 11.6x/9.5x FY15/FY16 EPS and 2.2x/1.8x FY15/FY16 P/B. Maintain
Buy
with target price of INR414 (~12x FY16E EPS).
M.Cap. (INR b) / (USD b) 140.0/2.3
Financials & Valuation (INR Million)
Y/E Mar
Net Sales
EBITDA
Adj PAT
EPS (INR)
Gr. (%)
RoE (%)
RoCE (%)
P/E (x)
P/BV (X)
2015E 2016E 2017E
123,053 138,890 157,237
23,482 27,031 31,397
12,252 14,795 18,017
28.2
16.6
21.0
21.5
11.6
2.2
34.5
22.3
177.3
21.3
23.1
9.5
1.8
42.0
21.8
215.3
21.4
24.2
7.8
1.5
BV/Sh.(INR) 146.9
Jinesh Gandhi
(Jinesh@MotilalOswal.com); +91 22 3982 5416
Investors are advised to refer through disclosures made at the end of the Research Report.

UPL
Strong pricing improvement and Fx drive 12% YoY revenue growth
Consolidated revenues grew by 14% YoY. India revenues grew of ~7.5% YoY and
international revenue growth of ~16%.
International revenues were driven by 27% growth in EU, ~30% growth in RoW
and 20% growth in LatAm. US revenue declined 12% YoY.
While volumes grew ~15%, pricing grew 2% and forex impacted growth by 2%.
EU business benefited from increased Mancozeb shares both with brands &
institutional sales.
LatAm continues on strong growth path, with several new launches.
RoW business was driven by significant improvement in Australia and continued
expansion in African countries.
Break-down of Revenue Growth
Volume growth
19
8
31
4
12
11
5
4
2 15
5
-2
4
12
4
16
2
2
7
13
1
12
3
2
10
8
5
6
4
6
3
2
15
-2
Pricing growth
Fx benefit
Revenue growth driven by India and US
Revenues (INR b)
56.3
40.9
16.2
19.8
4.8
20.2
Growth (%)
32.3
10.5
25.5
15.3 18.4
18.3
0.6
5
4
31
Source: Company, MOSL
Trend in market mix
INR m
Domestic Business
Contribution(%)
International Business
Contribution(%)
US
Contribution(%)
EU
Contribution(%)
RoW
Contribution(%)
- of which LatAm
Contribution(%)
Total
1QFY15
6,860
25.6
19,930
74.4
3,420
12.8
4,010
15.0
12,500
46.7
8,940
33.4
26,790
1QFY14
6,380
27.0
17,220
73.0
3,870
16.4
3,160
13.4
10,190
43.2
7,440
31.5
23,600
20.2
22.7
26.9
-11.6
YoY (%) 4QFY14 QoQ (%)
7.5
9,440
34.0
15.7 18,290
66.0
5,320
19.2
5,020
18.1
7,950
28.7
4,870
17.6
13.5 27,730
83.6
57.2
-20.1
-35.7
9.0
-27.3
FY14
20.8
79.2
19.7
18.7
40.7
26.5
FY13 YoY (%)
25.9
15.2
13.5
18.8
14.5
14.0
19.4
80.6
20.4
18.5
41.7
27.3
22,720 18,050
86,300 74,890
21,480 18,930
20,400 17,170
44,420 38,790
28,910 25,360
17.3
-3.4
109,020 92,940
Source: Company, MOSL
EBITDA margin expansion continues
Gross margins of 38.6% were highest in 14 quarters.
However, higher other expenses on promotion of branded products restricted
EBITDA margins at 18% (-30bp YoY). EBITDA grew 13% to ~INR4.8b (v/s est
~INR5.1b).
2
21 October 2014

UPL
Its focus to reduce share of high volume, low margin product is on track and is
expected to drive improvement in profitability.
Higher interest cost at ~INR1.4b due to ~INR490m of Fx losses, further impacted
PAT with just 3% YoY to ~INR1.8b (v/s est INR2.2b).
It reported extra-ordinary expense of ~INR168m pertaining to concluding
restructuring expenses of LatAm operations.
Working capital was under control at ~94 days (±1 day QoQ/YoY). Gross/net
debt reduced further by ~INR1.3b/INR4b QoQ to ~INR34.3b/INR21.4b.
Trend in EBITDA
EBITDA (INR m)
Margins (%)
20.1
18.1
18.4
17.3
19.0
17.7
17.6
17.6
18.6
18.3
17.6
19.0
18.0
Source: Company, MOSL
Common Size Statement (%)
1QFY15
Sales
RM Cost
Staff Cost
Other Exp
EBITDA
100
48.6
9.6
23.7
18.0
1QFY14 Chg (bp) 4QFY14 Chg (bp)
100
49.9
10.0
21.8
18.3
-130
-40
190
-20
100
47.9
9.2
24.0
19.0
80
40
-20
-90
FY14
100
50.5
8.8
21.9
FY13 Chg (bp)
100
51.0
9.3
21.7
-50
-50
30
18.8
18.1
70
Source: Company, MOSL
Trend in Working Capital (days)
Net working capital (days)
Trend in Debt (INR b)
Net working capital (days)
Source: Company, MOSL
Maintains guidance for FY15 at 12-15% revenue growth and 19-20% EBITDA
margins in FY15
It has maintained guidance for FY15 at revenue growth of 12-15% (constant
currency), EBITDA margins of 19-20% and tax rate of 22-25%.
3
21 October 2014

UPL
The management is focused on managing working capital and expects it to
remain stable at 90 days (year-end, although seasonal variances will exist).
It plans for capex of ~INR5-5.5b (including investment in registrations), as
against capex of ~INR5.5b in FY14.
Valuation and view
We are downgrading our FY15/FY16 EPS by 4%/1% to INR28.2/34.5, to factor in
for higher other expenses and interest cost.
Long term outlook remains positive with realization of integration benefits from
DVA Agro over next 3-4 quarters.
Strong volumes and revenue growth coupled with gradual realization of
synergies of DVA Agro would drive margin improvement and profit growth.
The stock trades at very attractive valuation of 11.6x/9.5x FY15/FY16 EPS and
2.2x/1.8x FY15/FY16 P/B.
Maintain Buy with target price of INR414 (~12x FY16E EPS).
Revised estimates
(INR B)
Rev
Net Sales
EBITDA
Net Profit
EPS (INR)
123.1
23.5
12.1
28.2
FY15E
Old
122.9
23.8
12.6
29.4
Chg (%)
0.2
-1.3
-3.9
-3.9
Rev
138.9
27.0
14.8
34.5
FY16E
Old
137.7
26.8
14.9
34.8
Chg (%)
0.9
0.8
-0.7
-0.7
Source: MOSL
21 October 2014
4

UPL
UPL: an investment profile
Company description
United Phosphorus is USD1.8b company with a strong
presence in crop protection and industrial chemicals.
With around ~80% of its revenues coming from
international markets, the company has emerged as the
third largest generic player in the world. United
Phosphorus’ growth strategy is built around filing its
own registrations globally and acquiring tail end brands
of global majors in regulated markets.
Recent developments
2QFY15 had extra-ordinary expense of ~INR168m
pertaining to concluding restructuring expenses of
LatAm operations.
Valuation and view
Key investment arguments
Well diversified revenue base, with presence across
key markets viz Latam (~27% of revenues), US, EU,
India (18-20% each) and RoW (~14%).
One of the largest and most competitive global
generic players in crop protection – well poised to
leverage the increasing conversion to generics.
Improving cash flows gives it a war chest to scale up
new registrations and acquisitions.
Business is working capital intensive, thereby
restricting the free cash available to seed growth.
Any large acquisition could put pressure on short
term operating performance, especially considering
high gearing.
The stock trades at very attractive valuation of
11.6x/9.5x FY15/FY16 EPS and 2.2x/1.8x FY15/FY16
P/B.
Maintain Buy with target price of INR414 (~12x
FY16E EPS).
Sector view
Long term potential for generic agro-chemical
remains intact, benefitting from several molecules
going off-patent over next few years.
High degree of consolidation, strong entry barriers
and limited price erosion make the generics
opportunity very attractive for established players.
Companies that have achieved critical scale and
established strong relationships with major
distributors are expected to benefit the most.
Key investment risks
EPS: MOSL forecast v/s consensus (INR)
MOSL
Forecast
FY14
FY15
28.2
34.5
Consensus
Forecast
28.0
32.5
Variation
(%)
0.6
6.0
Target price and recommendation
Current
Price (INR)
327
Target
Price (INR)
414
Upside
(%)
26.6
Reco.
Buy
Shareholding pattern (%)
Sep-14
Promoter
DII
FII
Others
29.8
8.5
46.6
15.1
Jun-14
29.8
7.1
48.7
14.5
Sep-13
28.9
12.3
39.9
19.0
Stock performance (1-year)
440
360
280
200
120
Oct-13
UPL
Sensex - Rebased
Jan-14
Apr-14
Jul-14
Oct-14
21 October 2014
5

UPL
Financials and valuation
Income statement
Y/E Mar
Net Sales
Change (%)
EBITDA
EBITDA Margin (%)
Depreciation
EBIT
Interest
Other Income
Extraordinary items
PBT
Tax
Tax Rate (%)
Min. Int. & Assoc. Share
Reported PAT
Adj PAT
Change (%)
(INR Million)
2014
2015E
2016E
2017E
107,709 123,053 138,890 157,237
17.1
14.2
12.9
13.2
20,196 23,482 27,031 31,397
18.8
19.1
19.5
20.0
4,069
16,126
4,866
1,314
1,092
11,482
2,217
19.3
232
9,498
10,379
29.4
4,464
19,019
5,156
1,080
-190
15,133
3,015
19.9
134
12,252
12,100
16.6
4,854
22,178
4,910
1,530
0
18,798
4,324
23.0
321
14,795
14,795
22.3
5,194
26,203
4,730
1,680
0
23,154
5,557
24.0
421
18,017
18,017
21.8
Ratios
Y/E Mar
Basic (INR)
EPS
Cash EPS
Book Value
DPS
Payout (incl. Div. Tax.)
Valuation(x)
P/E
Cash P/E
Price / Book Value
EV/Sales
EV/EBITDA
Dividend Yield (%)
Profitability Ratios (%)
RoE
RoCE
Turnover Ratios (%)
Asset Turnover (x)
Debtors (No. of Days)
Inventory (No. of Days)
Creditors (No. of Days)
Leverage Ratios (%)
Debt/Equity (x)
2014
24.2
33.7
122.4
3.0
16.2
13.5
9.7
2.7
1.5
8.3
0.9
21.0
19.6
1.2
109.1
84.0
134.7
0.7
2015E
28.2
38.6
146.9
3.5
14.5
11.6
8.5
2.2
1.3
7.0
1.1
21.0
21.5
1.2
105.0
100.0
135.9
0.6
2016E
34.5
45.8
177.3
3.5
12.1
9.5
7.1
1.8
1.1
5.8
1.1
21.3
23.1
1.3
105.0
100.0
136.6
0.4
2017E
42.0
54.2
215.3
3.5
10.0
7.8
6.0
1.5
0.9
4.6
1.1
21.4
24.2
1.3
105.0
100.0
137.4
0.3
Balance sheet
Y/E Mar
Share Capital
Reserves
Net Worth
Debt
Total Capital Employed
Gross Fixed Assets
Less: Acc Depreciation
Net Fixed Assets
Capital WIP
Investments
Current Assets
Inventory
Debtors
Cash & Bank
Loans & Adv, Others
Curr Liabs & Provns
Curr. Liabilities
Provisions
Net Current Assets
Total Assets
2014
857
51,617
52,474
37,422
91,617
63,376
23,639
39,737
750
7,373
79,731
24,801
32,204
10,228
12,499
35,973
32,293
3,681
43,757
91,617
(INR Million)
2015E
2016E
2017E
857
857
857
62,114 75,154 91,416
62,971 76,011 92,274
33,936 31,936 29,936
98,638 109,689 123,963
68,876 73,876 78,876
28,103 32,956 38,150
40,773 40,920 40,726
750
750
750
4,297
4,818
5,439
94,672 111,137 131,746
33,713 38,052 43,079
35,399 39,955 45,233
10,389 16,007 24,050
15,171 17,123 19,385
41,855 47,936 54,698
37,084 41,857 47,387
4,770
6,079
7,312
52,817 63,201 77,048
98,638 109,689 123,963
E: MOSL Estimates
Cash flow statement
Y/E Mar
OP/(Loss) before Tax
Interest
Direct Taxes Paid
(Inc)/Dec in Wkg Cap
CF from Op. Activity
(Inc)/Dec in FA & CWIP
(Pur)/Sale of Invt
CF from Inv. Activity
Inc/(Dec) in Net Worth
Inc / (Dec) in Debt
Interest Paid
Divd Paid (incl Tax)
CF from Fin. Activity
Inc/(Dec) in Cash
Add: Opening Balance
Closing Balance
2014
15,330
0
-2,217
-7,144
7,060
-5,888
2,879
-3,009
-1,972
-4,571
0
-1,504
-8,047
-3,996
17,397
13,401
2015E
18,326
0
-3,015
-8,899
6,222
-5,500
3,076
-2,424
0
-3,486
0
-1,755
-5,241
-1,443
13,401
11,958
(INR Million)
2016E
22,122
0
-4,324
-4,766
13,032
-5,000
-521
-5,521
0
-2,000
0
-1,755
-3,755
3,756
11,958
15,714
2017E
26,667
0
-5,557
-5,804
15,306
-5,000
-621
-5,621
0
-2,000
0
-1,755
-3,755
5,930
15,714
21,644
21 October 2014
6

UPL
NOTES
21 October 2014
7

This research report has been prepared by MOSt to provide information about the company(ies) and sector(s), if any, covered in the report and may be distributed by it and/or its affiliated company(ies). This
UPL
report is for personal information of the select recipient and does not construe to be any investment, legal or taxation advice to you. This research report does not constitute an offer, invitation or inducement to
invest in securities or other investments and Motilal Oswal Securities Limited (hereinafter referred as MOSt) is not soliciting any action based upon it. This report is not for public distribution and has been
furnished to you solely for your general information and should not be reproduced or redistributed to any other person in any form. This report does not constitute a personal recommendation or take into
account the particular investment objectives, financial situations, or needs of individual clients. Before acting on any advice or recommendation in this material, investors should consider whether it is suitable
for their particular circumstances and, if necessary, seek professional advice. The price and value of the investments referred to in this material and the income from them may go down as well as up, and
investors may realize losses on any investments. Past performance is not a guide for future performance, future returns are not guaranteed and a loss of original capital may occur.
MOSt and its affiliates are a full-service, integrated investment banking, investment management, brokerage and financing group. We and our affiliates have investment banking and other business
relationships with a significant percentage of the companies covered by our Research Department Our research professionals provide important input into our investment banking and other business selection
processes. Investors should assume that MOSt and/or its affiliates are seeking or will seek investment banking or other business from the company or companies that are the subject of this material and that
the research professionals who were involved in preparing this material may participate in the solicitation of such business. The research professionals responsible for the preparation of this document may
interact with trading desk personnel, sales personnel and other parties for the purpose of gathering, applying and interpreting market information. Our research professionals are paid in part based on the
profitability of MOSt which include earnings from investment banking and other business. MOSt generally prohibits its analysts, persons reporting to analysts, and members of their households from
maintaining a financial interest in the securities or derivatives of any companies that the analysts cover. Additionally, MOSt generally prohibits its analysts and persons reporting to analysts from serving as an
officer, director, or advisory board member of any companies that the analysts cover. Our salespeople, traders, and other professionals or affiliates may provide oral or written market commentary or trading
strategies to our clients that reflect opinions that are contrary to the opinions expressed herein, and our proprietary trading and investing businesses may make investment decisions that are inconsistent with
the recommendations expressed herein. In reviewing these materials, you should be aware that any or all o the foregoing, among other things, may give rise to real or potential conflicts of interest . MOSt and
its affiliated company(ies), their directors and employees may; (a) from time to time, have a long or short position in, and buy or sell the securities of the company(ies) mentioned herein or (b) be engaged in
any other transaction involving such securities and earn brokerage or other compensation or act as a market maker in the financial instruments of the company(ies) discussed herein or act as an advisor or
lender/borrower to such company(ies) or may have any other potential conflict of interests with respect to any recommendation and other related information and opinions.
Unauthorized disclosure, use, dissemination or copying (either whole or partial) of this information, is prohibited. The person accessing this information specifically agrees to exempt MOSt or any of its
affiliates or employees from, any and all responsibility/liability arising from such misuse and agrees not to hold MOSt or any of its affiliates or employees responsible for any such misuse and further agrees to
hold MOSt or any of its affiliates or employees free and harmless from all losses, costs, damages, expenses that may be suffered by the person accessing this information due to any errors and delays. The
information contained herein is based on publicly available data or other sources believed to be reliable. Any statements contained in this report attributed to a third party represent MOSt’s interpretation of the
data, information and/or opinions provided by that third party either publicly or through a subscription service, and such use and interpretation have not been reviewed by the third party. This Report is not
intended to be a complete statement or summary of the securities, markets or developments referred to in the document. While we would endeavor to update the information herein on reasonable basis, MOSt
and/or its affiliates are under no obligation to update the information. Also there may be regulatory, compliance, or other reasons that may prevent MOSt and/or its affiliates from doing so. MOSt or any of its
affiliates or employees shall not be in any way responsible and liable for any loss or damage that may arise to any person from any inadvertent error in the information contained in this report. MOSt or any of
its affiliates or employees do not provide, at any time, any express or implied warranty of any kind, regarding any matter pertaining to this report, including without limitation the implied warranties of
merchantability, fitness for a particular purpose, and non-infringement. The recipients of this report should rely on their own investigations.
Recipients who are not institutional investors should seek advice of their independent financial advisor prior to taking any investment decision based on this report or for any necessary explanation of its
contents.
MOSt and/or its affiliates and/or employees may have interests/positions, financial or otherwise in the securities mentioned in this report. To enhance transparency, MOSt has incorporated a Disclosure of
Interest Statement in this document. This should, however, not be treated as endorsement of the views expressed in the report.
Disclosure of Interest Statement
Analyst ownership of the stock
UPL LTD
No
Disclosures
Analyst Certification
The views expressed in this research report accurately reflect the personal views of the analyst(s) about the subject securities or issues, and no part of the compensation of the research analyst(s) was, is, or
will be directly or indirectly related to the specific recommendations and views expressed by research analyst(s) in this report. The research analysts, strategists, or research associates principally responsible
for preparation of MOSt research receive compensation based upon various factors, including quality of research, investor client feedback, stock picking, competitive factors and firm revenues.
Regional Disclosures (outside India)
For U.K.
This report is not directed or intended for distribution to or use by any person or entity resident in a state, country or any jurisdiction, where such distribution, publication, availability or use would be contrary to
law, regulation or which would subject MOSt & its group companies to registration or licensing requirements within such jurisdictions.
This report is intended for distribution only to persons having professional experience in matters relating to investments as described in Article 19 of the Financial Services and Markets Act 2000 (Financial
Promotion) Order 2005 (referred to as "investment professionals"). This document must not be acted on or relied on by persons who are not investment professionals. Any investment or investment activity to
which this document relates is only available to investment professionals and will be engaged in only with such persons.
Motilal Oswal Securities Limited (MOSL) is not a registered broker - dealer under the U.S. Securities Exchange Act of 1934, as amended (the"1934 act") and under applicable state laws in the United States.
In addition MOSL is not a registered investment adviser under the U.S. Investment Advisers Act of 1940, as amended (the "Advisers Act" and together with the 1934 Act, the "Acts), and under applicable state
laws in the United States. Accordingly, in the absence of specific exemption under the Acts, any brokerage and investment services provided by MOSL, including the products and services described herein
are not available to or intended for U.S. persons.
This report is intended for distribution only to "Major Institutional Investors" as defined by Rule 15a-6(b)(4) of the Exchange Act and interpretations thereof by SEC (henceforth referred to as "major institutional
investors"). This document must not be acted on or relied on by persons who are not major institutional investors. Any investment or investment activity to which this document relates is only available to major
institutional investors and will be engaged in only with major institutional investors. In reliance on the exemption from registration provided by Rule 15a-6 of the U.S. Securities Exchange Act of 1934, as
amended (the "Exchange Act") and interpretations thereof by the U.S. Securities and Exchange Commission ("SEC") in order to conduct business with Institutional Investors based in the U.S., MOSL has
entered into a chaperoning agreement with a U.S. registered broker-dealer, Motilal Oswal Securities International Private Limited. ("MOSIPL"). Any business interaction pursuant to this report will have to be
executed within the provisions of this chaperoning agreement.
The Research Analysts contributing to the report may not be registered /qualified as research analyst with FINRA. Such research analyst may not be associated persons of the U.S. registered broker-dealer,
MOSIPL, and therefore, may not be subject to NASD rule 2711 and NYSE Rule 472 restrictions on communication with a subject company, public appearances and trading securities held by a research
analyst account.
Motilal Oswal Capital Markets Singapore Pte Limited is acting as an exempt financial advisor under section 23(1)(f) of the Financial Advisers Act(FAA) read with regulation 17(1)(d) of the Financial Advisors
Regulations and is a subsidiary of Motilal Oswal Securities Limited in India. This research is distributed in Singapore by Motilal Oswal Capital Markets Singapore Pte Limited and it is only directed in Singapore
to accredited investors, as defined in the Financial Advisers Regulations and the Securities and Futures Act (Chapter 289), as amended from time to time.
In respect of any matter arising from or in connection with the research you could contact the following representatives of Motilal Oswal Capital Markets Singapore Pte Limited:
Anosh Koppikar
Kadambari Balachandran
Email : anosh.Koppikar@motilaloswal.com
Email : kadambari.balachandran@motilaloswal.com
Contact : (+65)68189232
Contact : (+65) 68189233 / 65249115
Office Address : 21 (Suite 31),16 Collyer Quay,Singapore 04931
For U.S.
For Singapore
Motilal Oswal Securities Ltd
21 October 2014
Motilal Oswal Tower, Level 9, Sayani Road, Prabhadevi, Mumbai 400 025
Phone: +91 22 3982 5500 E-mail: reports@motilaloswal.com
8