22 October 2014
2QFY15 Results Update | Sector:
Financials
Kotak Mahindra Bank
BSE SENSEX
26,787
Bloomberg
Equity Shares (m)
M.Cap. (INR b) / (USD b)
52-Week Range (INR)
1, 6, 12 Rel. Per (%)
S&P CNX
7,996
KMB IN
771.3
820.9/13.4
1,086/631
3/13/22
CMP: INR1,064
TP: INR990
Neutral
Financials & Valuation (INR Billion)
Y/E MAR
NII
OP
NP
NIM (%)
EPS (INR)
EPS Gr. (%)
BV. (INR)
RoE (%)
RoA (%)
Payout (%)
Valuations
P/E(X) (Cons.)
26.6
2015E
42.3
28.9
18.0
4.7
39.9
20.7
275.0
15.6
1.9
2.9
2016E
50.6
35.1
21.9
4.6
48.9
22.6
322.5
16.4
1.9
2.9
21.7
3.3
3.4
0.1
2017E
61.8
43.8
27.3
4.6
59.8
22.4
380.5
17.0
1.9
2.9
17.7
2.8
2.8
0.1
P/BV (X)
(C
P/ABV)(X)
( Yield
Div. )
(%)
3.9
3.9
0.1
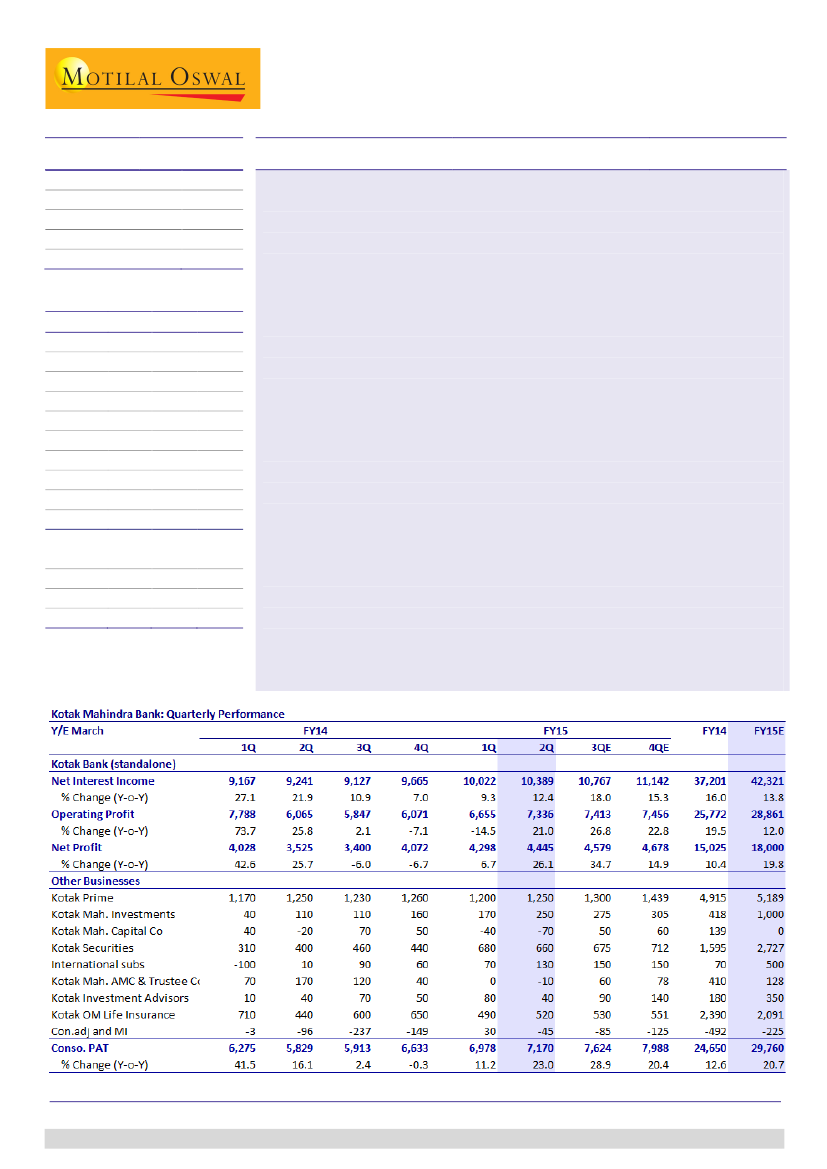
KMB’s 2QFY15 consolidated PAT grew 23% YoY to INR7.2b (in-line) led by
lending business PAT growth of 22% YoY to INR5.9b.
Standalone business:
Standalone PAT grew 26% YoY to INR4.4b (in-line). Fees
registered impressive growth of 51% YoY in 2Q and 44% YoY in 1HFY15.
Employee expenses grew 34% YoY due to ESoPs related accounting. Loans grew
20% YoY, though ex-CV it was healthy at 28% YoY, driven by strong growth of
43% YoY in corporate segment. CASA deposit grew 11% QoQ (37% YoY) and
CASA ratio was stable QoQ at 31%.
Other businesses:
(1) K-Sec market share declined 20bp QoQ to 2.7%, (2) car
disbursements grew 28% YoY to INR18.3b, (3) strong growth in LAS (NBFC)
business – customer assets up 3x YoY and 50%+ YTD, (4) asset management
AUM grew 9% YoY but declined 2% QoQ to INR657b and (5) average AUM for
Kotak AMC grew 5% QoQ and 7% YoY to INR378b, of which equity average AUM
was at INR52b (INR39b a quarter ago and INR29b a year ago).
Other highlights:
(1) consolidated NIM (5%) and GNPAs (including stress assets -
1.6%) were stable QoQ and (2) KMB acquired 15% stake in MCX.
Valuation and view:
Increasing evidence of improvement in macro-economic
conditions coupled with strong capital position (Tier I of ~17%), improved liability
profile and distribution, robust risk management system (stress loans at just 1.2%)
and strong presence across loan product segments place KMB in a strong position to
lever any growth opportunities. We raise the earnings estimates by ~4% to factor
the strong growth. Earnings CAGR of ~22% is expected over FY14-17E, while RoA and
RoE are expected to be ~1.9%/16%+. However, rich valuations of 3.3x FY16E
consolidated BV and 23x (at LPA) consolidated EPS limit the upside. Maintain
Neutral.
Alpesh Mehta
(Alpesh.Mehta@MotilalOswal.com); +91 22 3982 5415
Vallabh Kulkarni
(Vallabh.Kulkarni@MotilalOswal.com); +91 22 3982 5430
Investors are advised to refer through disclosures made at the end of the Research Report.

Kotak Mahindra Bank
Exhibit 1: Earnings Snapshot
Business
Kotak Mahindra Bank (Standalone)
Kotak Mahindra Prime
Kotak Mahindra Investments
Lending Business
Kotak Mahindra Capital Company
Kotak Securities
Capital Market Business
International subsidiaries
Kotak Mahindra AMC & Trustee Co
Kotak Investment Advisors
Asset Management Business
Consol. PAT excluding Kotak Life
Kotak OM Life Insurance
Consolidation Adjust.
Reported PAT
Banking Business
Auto loans, debt capital markets
Primarily LAS
Investment banking
Broking and distribution
Asset Mgt and IB
Mutual funds management
Alternate asset management
2QFY15
4,445
1,250
250
5,945
660
-70
590
130
-10
40
160
6,695
520
-45
7,170
1QFY15
4,298
1,200
170
5,668
680
-40
640
70
0
80
150
6,458
490
30
6,978
QoQ (%)
3
4
47
5
-3
75
-8
86
NA
-50
7
4
6
-250
3
2QFY14
YoY (%)
3,525
26
1,250
0
110
127
4,885
22
400
65
-20
250
380
55
10
1,200
170
-106
40
0
220
-27
5,485
22
440
18
-96
-53
5,829
23
Source: MOSL, Company
Lending Business: Strong growth in corporate banking and unsecured loans;
NIM stable at 5%; stable asset quality
Strong fee income
performance led to healthy
net profit growth of 26%
YoY.
Dependence on bulk
deposits continues to
reduce as CD proportion
further declines to 6.8%
Profitability of the lending business was in-line with estimates with PAT of
INR5.9b (+22% YoY). Standalone Banking PAT grew 26% YoY to INR4.4b (in-line).
Kotak Prime reported PAT grew 4% QoQ to INR1.25b (flat YoY). On a lower base
Kotak Mahindra investments PAT grew 127% YoY to INR250m.
Standalone Bank:
NIM (calculated) was stable QoQ at 4.8%. Loan growth was
strong at 20% YoY and excluding CV/CE loans grew 28% YoY. Strong growth was
witnessed in unsecured retail loans and corporate banking. Fees grew strongly
at 51% YoY and led to overall non-interest income being 21% higher than
estimate at INR3.9b.
Opex was 8% above estimate led by 16% higher than expected employee costs
due to ESoP related provisioning
Stable Asset quality; NSL one of the lowest among peers:
GNPA in absolute
terms increased 8% QoQ and in percentage terms stood at 1.9% (flat QoQ).
NNPA% also remained flat QoQ at 1% and resultantly PCR declined marginally to
47.5% as compared to 48.1% in 1QFY15. Restructured loans were stable QoQ at
26bp loans. Provision for NPA and standard assets remained flat QoQ at
INR650m of which INR950m was on account of NPA and write-back of INR310m
on account of recoveries.
Traction in CASA Deposits continue:
SA deposits grew 6% QoQ and 40% YoY and
new SA customer addition per quarter remains healthy at 0.21m. SA deposits as
a proportion of overall deposits stood at 17.2% as compared to 17.9% a quarter
ago and 15.9% in 2QFY14. CA deposits grew impressive 18% QoQ (+35% YoY)
and as a result overall CASA (excluding float) grew 37% YoY (+11% QoQ). CASA
ratio was flat QoQ at 31% as compared to 29% in 2QFY14. During the quarter,
bank further reduced its reliance on CDs which formed 6.8% of overall deposits
as compared to 7.7% a quarter ago and peak of 21.5% at end of 3QFY13. CASA
and TDs below INR 50m constitute 65% of total deposits (63% in 2QFY14)
Consolidate loan growth ex-CV at 24% YoY:
CV loan portfolio declined 1% QoQ
and 25% YoY dragging overall loan growth to 19% YoY (+6% QoQ). CV loans as a
proportion of overall loans now formed 6.2% as compared to 6.6% in previous
2
22 October 2014

Kotak Mahindra Bank
Loan growth largely driven
by corporate banking and
personal loans
quarter and near term peak of 15.2% in FY11. Ex-CV loan growth was healthy at
24% YoY driven by strong growth in corporate segment (+14% QoQ and 44%
YoY). Other segments like personal loans (+12% QoQ and 29% YoY) and home
loans (+5% QoQ and 14% YoY) also witnessed healthy growth. Car loans (Prime)
picked up 4% QoQ and 6% YoY.
Exhibit 2: Kotak Mahindra Bank (SA) Quarterly Performance (INR M)
Y/E March
Interest Income
Interest Expense
Net Interest Income
% Change (Y-o-Y)
Other Income
Net Income
% Change (Y-o-Y)
Operating Expenses
Operating Profit
% Change (Y-o-Y)
Other Provisions
Profit before Tax
Tax Provisions
Net Profit
% Change (Y-o-Y)
Loan growth (%)
Cost to Income Ratio (%)
Tax Rate (%)
1Q
21,900
12,734
9,167
27.1
4,624
13,791
43.3
6,003
7,788
73.7
1,689
6,099
2,071
4,028
42.6
19.4
43.5
34.0
FY14
2Q
3Q
21,723
21,923
12,482
12,796
9,241
9,127
21.9
10.9
2,971
2,997
12,212
12,125
21.0
7.5
6,147
6,277
6,065
5,847
25.8
2.1
723
697
5,343
5,150
1,817
1,750
3,525
3,400
25.7
-6.0
11.4
5.8
50.3
51.8
34.0
34.0
4Q
22,125
12,459
9,665
7.0
3,405
13,070
3.1
6,999
6,071
-7.1
-62
6,133
2,061
4,072
-6.7
9.4
53.6
33.6
1Q
22,864
12,842
10,022
9.3
3,998
14,020
1.7
7,364
6,655
-14.5
140
6,515
2,217
4,298
6.7
12.6
52.5
34.0
FY15
2Q
3QE
23,525
24,494
13,136
13,727
10,389
10,767
12.4
18.0
4,665
4,697
15,054
15,465
23.3
27.5
7,717
8,052
7,336
7,413
21.0
26.8
537
475
6,800
6,938
2,355
2,359
4,445
4,579
26.1
34.7
20.4
21.6
51.3
52.1
34.6
34.0
FY14
FY15E
4QE
25,533
87,671
96,416
14,391
50,471
54,095
11,142
37,201
42,321
15.3
16.0
13.8
4,707
13,997
18,066
15,849
51,198
60,387
21.3
17.3
17.9
8,393
25,426
31,526
7,456
25,772
28,861
22.8
19.5
12.0
436
3,047
1,588
7,020
22,725
27,273
2,342
7,699
9,273
4,678
15,025
18,000
14.9
10.4
19.8
24.0
9.4
24.0
53.0
49.7
52.2
33.4
33.9
34.0
Source: MOSL, Company
Exhibit 3: Trend in lending business profitability - Share of lending profit stable QoQ
1QFY13
Total Lending Profits (INR m)
3,804
YoY Gr. (%)
9
QoQ Gr. (%)
-5
Share in Consolidated Profit (%)
85
2QFY13
4,104
16
8
80
3QFY13
4,747
24
16
80
4QFY13
5,602
40
18
87
1QFY14
5,238
38
-6
83
2QFY14
4,885
19
-7
82
3QFY14
4,740
0
-3
77
4QFY14 1QFY15 2QFY15
5,492
5,668
5,945
-2
8
22
16
3
5
81
82
82
Source: MOSL, Company
Weak quarter for Capital market related business
K-Sec market share declined
20bp to 2.7% in 2QFY15
Capital market related business PAT was at INR590m (14% below expectation)
driven by INR 70m loss in the investment banking arm. K-sec net profit declined
3% QoQ to INR660m (+65% YoY) and its market share declined 20bp QoQ to
2.7% in 2QFY15.
Asset management business reported PAT of INR160m (+7% QoQ). On a YoY
profitability of international subsidiaries improved to INR130m v/s INR10m.
Profitability of Kotak Investment advisors was flat QoQ.
Overall AUM declined 1.4% QoQ to INR657b. Within which domestic AUM
declined 5% YoY led by 10% QoQ led by debt AUM. Domestic equity AUMs
increased 95% YoY and 27% QoQ to INR59b in 2QFY15.
Life insurance profit increased 18% YoY and 6% QoQ to INR 520m.
22 October 2014
3

Kotak Mahindra Bank
Exhibit 4: K-Sec earnings trend (INR b)
Tot. Inc.
26
16
19 18
28
17
8
26
PAT
26
21
PATM (%) 30
29
27 28
Exhibit 5: K-Sec market declined 20bp QoQ (%)
2.7 2.9 2.9 2.9 2.5 2.5 2.6 2.5
2.9 2.7
2.2 2.4 2.3 2.3
Source: MOSL, Company
Exhibit 6: Investment Banking: Earnings trend (INR m)
Tot. Inc.
4
-31
18 23
26 20
PAT
11
PATM (%)
27
20
18 18
-17
-33
-64
Exhibit 7: Kotak AMC: Equity AUM increases QoQ
Eq. AUM
258 247
234
Debt AUM
326 308
313
288
282
268 282 265
255
239
187
59
36 30 29 32 31 34 34 28 31 30 36 34 47
Source: MOSL, Company
Exhibit 8: Trend in segment wise profitability (INR m)
Total lending profits
QoQ Growth (%)
YoY Growth (%)
% Share to total profits
Capital market related business
QoQ Growth (%)
YoY Growth (%)
% Share to total profits
AMC Businesses
QoQ Growth (%)
YoY Growth (%)
% Share to total profits
Kotak Mah. Old Mutual Life Insur.
QoQ Growth (%)
YoY Growth (%)
% Share to total profits
Consolidated PAT
QoQ Growth (%)
YoY Growth (%)
% Share to total profits
Total consolidated PAT ex Life
QoQ Growth (%)
YoY Growth (%)
% Share to total profits
# ex-consolidated adjustments
1QFY13
3,804
-5
9
85
290
-47
21
6
70
-56
-59
2
320
-44
-30
7
4,484
-15
3
100
4,164
-12
7
93
2QFY13
4,104
8
16
80
440
52
76
9
120
71
50
2
470
47
-11
9
5,134
14
17
100
4,664
12
21
91
3QFY13
4,747
16
24
80
400
-9
43
7
220
83
267
4
530
13
13
9
5,897
15
27
100
5,367
15
29
91
4QFY13
5,602
18
40
87
170
-58
-69
3
90
-59
-44
1
580
9
2
9
6,442
9
22
100
5,862
9
24
91
1QFY14
5,238
-6
38
83
350
106
21
6
-20
-122
-129
0
710
22
122
11
6,278
-3
40
100
5,568
-5
34
89
2QFY14
4,885
-7
19
82
380
9
-14
6
220
83
4
440
-38
-6
7
5,925
-6
15
100
5,485
-1
18
93
3QFY14
4,740
-3
0
77
530
39
33
9
280
27
27
5
600
36
13
10
6,150
4
4
100
5,550
1
3
90
4QFY14 1QFY15 2QFY15
5,492
5,668
5,945
16
3
5
-2
8
22
81
82
82
490
640
590
-8
31
-8
188
83
55
7
9
8
150
150
160
-46
0
7
67
-850
-27
2
2
2
650
490
520
8
-25
6
12
-31
18
10
7
7
6,782
6,948
7,210
10
2
4
5
11
22
100
100
100
6,132
6,458
6,690
10
5
4
5
16
22
90
93
93
Source: MOSL, Company
22 October 2014
4

Kotak Mahindra Bank
Conference Call Highlights
Economy and Interest rates
Real economy remains slow however, there is significant improvement in
macros. Global factors may moderate Indian economic growth in the near to
medium term
Probability increasing of rate cut by RBI in 4QFY15
Credit cycle has flattened out and business sentiments are improving. Any
downward trend in Interest rates will provide confidence in credit cycle
Expects GDP growth of 5.5-6% in FY15 and next 5 years growth is expected to
be 6.5%
Loan growth
Confidence level has increased for 20%+ loan growth. Corporate loans have
picked up. Comfort level increased on higher end CV loans – now seeing
positive disbursement growth on a YoY basis. Think LCV will have to go through
some more pain. For CE business some lending opportunity remains.
Things to become better in 2HFY15 for auto loans. Increased distribution
network will help to capture expected growth in the segment
In case of wholesale business, KMB remains very excited about mid market
space (INR50-300mn ticket size).
Low cost deposits and fee income
Expects SA growth to remain strong at 35%+. For more than INR0.1m KMB will
continue to give 6% SA rate
New product introduction and customer acquisition is leading to strong CA
growth. Larger proportion of current account is from retail side
KMB is amongst top 2-3 distributors of MF now. Fee income from this source
has become 3x of the last year
Large part of fees growth came from distribution, DCM business, forex and
syndication business. Further, regular banking related charges also helped to
report strong fee income
Other highlights
Long term NIM guidance of 4.5%+ factoring in loan mix change towards
corporate loans
Stress asset portfolio unrealized gain of INR18-20b and will be monetized over
next 3 years
Investment in MCX is just a financial investment at this moment
Focusing on the getting CD ratio at 80’s level
22 October 2014
5

Kotak Mahindra Bank
Valuation and view
Higher capitalization
(tier-I ratio of 17%) will
keep RoE (standalone)
subdued at ~16% over
FY15/16
Increasing confidenece of improvement in macro-economic environment
coupled with strong capital position (Tier I of ~17%) places KMB in a strong
position to lever of any growth opportunities that arise in the economy.
Management guided for 20%+ loan growth in FY15. Rural and semi-urban areas
continue to be its key focus areas to drive growth. To leverage on its
geographical expansion, the management is focusing on product penetration,
with higher emphasis on Agriculture business (will help in priority sector loans),
small business loans (untapped opportunity; creating niche for itself) and
mortgage loan. Management mentioned that CV growth has bottomed out and
likely to show traction during the year. We factor loan CAGR of 25% over
FY14/17, with core PPP growth is expected to be at 20% CAGR.
Asset quality for the bank continues to hold up well with net stress loans at
125bp. With (1) management expectation of worst in CV/CE segment behind, (2)
other retail products showing better than factored in loss given default (LGD)
and (3) lower share of term/project loans in the corporate segment, we expect
asset quality performance of KMB to be better than peers in coming quarters.
We upgrade earnings estimates by ~4% to factor in the strong growth. With
earnings CAGR of ~22% over FY14-17 and 16%+ core RoE, we now value
standalone business at 3.5x FY16 BV. With improvement in volumes and tight
control over costs, we expect the performance of the Capital Market business to
improve. Overall, we expect KMB to report consolidated EPS of INR40/49 in
FY15/16, and consolidated BV of INR275/323 in FY15/16. Higher capitalization
(tier-I ratio of 17%) will keep RoE (standalone) subdued at ~16% over FY15/16.
We upgrade SOTP-based target price to INR 990. However, rich valuations of
3.3x FY16E conso. BV and 23x (at LPA) conso. EPS limit the upside.
Maintain
neutral.
Exhibit 9: Standalone: Upgrade earning estimates to factor strong growth
INR b
FY15
Net Interest Income 41.4
Other Income
16.4
Total Income
57.9
Operating Expenses 30.1
Operating Profits
27.8
Provisions
1.5
PBT
26.3
Tax
8.9
Standalone PAT
17.3
Loans
647
Margins (%)
4.7
SA RoA (%)
1.8
Core RoE (%)
13.6
Old Est.
FY16
50.5
18.4
68.9
35.2
33.7
2.3
31.3
10.0
21.3
809
4.7
1.8
14.6
FY17
62.5
20.6
83.1
41.2
41.9
3.0
38.8
12.4
26.4
1,011
4.7
1.9
15.7
Revised Est.
FY15 FY16 FY17
42.3 50.6
61.8
18.1 22.1
26.9
60.4 72.7
88.7
31.5 37.6
44.9
28.9 35.1
43.8
1.6
2.4
3.1
27.3 32.7
40.7
9.3
10.8
13.4
18.0 21.9
27.3
658
822 1,027
4.7
4.6
4.6
1.9
1.9
1.9
14.1 15.0
16.1
FY15
2.2
9.9
4.4
4.9
3.8
4.0
3.8
3.8
3.8
1.6
Change (%)
FY16
0.2
20.4
5.6
6.9
4.2
2.0
4.3
7.6
2.8
1.6
FY17
-1.2
31.0
6.8
8.9
4.6
1.9
4.8
8.1
3.3
1.6
Source: MOSL, Company
22 October 2014
6

Kotak Mahindra Bank
Exhibit 10: Consolidated: Better profitability of lending and asset management business
INR b
Old Est.
FY15 FY16 FY17
Kotak Mahindra Bank (Standalone) 17.3 21.3 26.4
Kotak Mahindra Prime
5.0
6.0
7.2
Kotak Mahindra Investments
0.7
1.0
1.3
Lending Business
23.1 28.3 34.8
International subsidiaries
0.4
0.4
0.4
Kotak Mahindra AMC & Trustee Co 0.2
0.5
0.6
Kotak Investment Advisors
0.4
0.4
0.5
Asset Management Business
0.9
1.3
1.4
Kotak Securities
2.7
3.2
3.8
Kotak Mahindra Capital Company 0.1
0.2
0.2
Capital Market Business
2.8
3.3
4.0
Consol. PAT excluding Kotak Life 26.8 32.9 40.3
Kotak OM Life Insurance
2.2
2.4
2.6
Consolidation Adjust.
-0.2 -0.2 -0.1
Consol. PAT Including Kotak Life 28.8 35.1 42.8
Revised Est.
FY15 FY16 FY17
18.0 21.9 27.3
5.2
6.2
7.4
1.0
1.5
1.9
24.2 29.6 36.6
0.5
0.5
0.6
0.1
0.5
0.6
0.4
0.4
0.5
1.0
1.4
1.6
2.7
3.3
3.9
0.0
0.1
0.1
2.7
3.4
4.1
27.9 34.4 42.3
2.1
2.3
2.5
-0.2 -0.2 -0.1
29.8 36.5 44.7
Change (%)
FY15 FY16 FY17
3.8
2.8
3.3
3.6
3.6
3.6
4.8
4.6
5.1
7.9
12.3
12.2
-3.5
4.0
1.0
4.6
1.1
4.9
3.5
4.1
4.5
Source: MOSL, Company
Exhibit 11: SOTP Valuation (FY16-based)
Value
(INR B)
657.5
549.0
98.1
10.3
35.1
18.8
8.8
7.5
51.2
49.1
2.1
17.8
761.6
816.5
-6.7
Value (USD
B)
10.8
9.0
1.6
0.2
0.6
0.3
0.1
0.1
0.8
0.8
0.0
0.3
12.5
13.4
INR per
share
854
713
127
13
46
24
10
11
67
64
3
23
990
1,060
-6.7
% To Total Rationale
86
72
3.5x FY16E Core NW, ~1.9% RoA and ~15% Core RoE
13
2.5x FY16E Net Worth, ~17% Core RoE
1
1.5x FY16E Net Worth
5
2
4% of FY16E Avg. AUM of INR471b
1
12% of FY16E AUM of INR73b
1
5% of FY16E AUM of INR150b
7
6
15x FY16E Earnings; Implied 2x Core BV
0
1x FY16E Free Networth
2
16x FY16E NBAP, APE CAGR of ~15% in FY15-17
100
Implied 3.1x PBV and 20x PE FY16; ROE of ~17%
Lending Business
Kotak Mahindra Bank
Kotak Prime (Car and other loans)
Kotak Investment Company (LAS)
Asset Management Business
Domestic Mutual Fund
Alternative Assets
Offshore Funds
Capital Markets related Business
Kotak Securities
Kotak Investment Banking (KMCC)
Kotak Life Insurance
Target Value
Current value / market price
Upside (%)
Source: MOSL, Company
22 October 2014
7

Kotak Mahindra Bank
Exhibit 12: Bank: CV continues to be a drag on overall
growth (INR m)
2QFY15
Comm. Vehicles
Car Loans (Prime)
Personal Loans
Home loans
Corp Banking
Business Banking
Agri
Others
Total Loans
Inv. / Treasury Assets
50,620
138,930
53,440
128,940
248,450
56,550
101,370
35,880
814,180
304,300
2QFY14
67,810
130,940
41,310
113,070
172,450
53,080
79,100
24,500
682,260
251,980
YoY %
-25
6
29
14
44
7
28
46
19
21
1QFY15
51,040
133,630
47,670
123,120
217,700
55,680
99,410
42,510
770,760
277,250
QoQ %
-1
4
12
5
14
2
2
-16
6
10
Exhibit 13: KMPL: Uptick in loan growth
Auto Loans (INR b)
Other Loans (INR b)
Source: MOSL, Company
Exhibit 14: Consolidated NIMs stable QoQ (%)
Exhibit 15: Asset quality (incl stressed assets) stable QoQ
GNPA (%)
NNPA (%)
Source: MOSL, Company
Exhibit 16: KMB Group: Earnings Estimates (INR m)
Kotak Mahindra Bank (Standalone)
Kotak Mahindra Prime
Kotak Mahindra Investments
Lending Business
International subsidiaries
Kotak Mahindra AMC & Trustee Co
Kotak Investment Advisors
Asset Management Business
Kotak Securities
Kotak Mahindra Capital Company
Capital Market Business
Consol. PAT excluding Kotak Life
YoY Growth (%)
Kotak OM Life Insurance
Consolidation Adjust.
Consol. PAT Including Kotak Life
YoY Growth (%)
Business
Banking Business
Auto loans, debt capital markets
Primarily LAS
Asset management and inv. banking
Mutual funds management
Alternate asset management
Broking and distribution
Investment banking
FY11
8,182
3,179
240
11,600
509
173
327
1,009
1,819
519
2,338
14,948
21
1,014
-294
15,667
20
FY12
10,851
3,849
153
14,852
-110
154
361
405
1,258
59
1,318
16,574
11
2,030
-282
18,322
17
FY13
13,607
4,307
336
18,250
60
35
307
401
1,145
167
1,312
19,964
20
1,900
21
21,885
19
FY14
15,025
4,915
418
20,358
70
410
180
660
1,595
139
1,734
22,752
14
2,390
-492
24,650
13
FY15E FY16E FY17E
17,340 21,307 26,406
5,008 5,965 7,158
735 1,023 1,279
23,083 28,296 34,844
350
375
400
206
499
582
350
400
450
906 1,274 1,432
2,727 3,177 3,812
99
170
196
2,826 3,347 4,008
26,815 32,916 40,283
18
23
22
2,151 2,366 2,603
-225
-225 -125
28,741 35,057 42,761
17
22
22
Source: MOSL, Company
Life insurance
22 October 2014
8

Kotak Mahindra Bank
Exhibit 17: Kotak Group Earnings Snapshot (% of total)
Kotak Mahindra Bank (Standalone)
Kotak Mahindra Prime
Kotak Mahindra Investments
Lending Business
International subsidiaries
Kotak Mahindra AMC & Trustee Co
Kotak Investment Advisors
Asset Management Business
Kotak Securities
Kotak Mahindra Capital Company
Capital Market Business
Consol. PAT excluding Kotak Life
Kotak OM Life Insurance
Consol. PAT Including Kotak Life
Business
Banking Business
Auto loans, debt capital markets
Primarily LAS
Asset management and inv. banking
Mutual funds management
Alternate asset management
Broking and distribution
Investment banking
FY11
52
20
2
74
3
1
2
6
12
3
15
95
6
100
FY12
59
21
1
81
-1
1
2
2
7
0
7
90
11
100
FY13
62
20
2
83
0
0
1
2
5
1
6
91
9
100
FY14 FY15E FY16E FY17E
61
60
60
61
20
2
83
0
2
1
3
6
1
7
92
10
100
17
17
17
3
4
4
81
81
82
2
1
1
0
1
1
1
1
1
3
4
4
9
9
9
0
0
0
9
9
9
94
94
95
7
6
6
100
100
100
Source: MOSL, Company
Life insurance
22 October 2014
9

Kotak Mahindra Bank
EPS: MOSL forecast v/s consensus (INR)
MOSL
Forecast
FY15
FY16
39.9
48.9
Consensus
Forecast
39.2
48.1
Variation
(%)
1.8
1.6
Stock performance (1-year)
Kotak Mahindra Bank
1,120
940
760
580
400
Oct-13
Sensex - Rebased
Shareholding pattern (%)
Sep-14
Promoter
DII
FII
Others
40.1
2.0
34.7
23.2
Jun-14
40.3
1.8
35.3
22.6
Sep-13
43.7
2.3
31.3
22.7
Jan-14
Apr-14
Jul-14
Oct-14
Note: FII Includes depository receipts
Financials: Valuation Matrix
60.02
Rating
ICICIBC*
HDFCB
AXSB
KMB*
YES
IIB
VYSB
FB
J&KBK
SIB
Private Aggregate
SBIN (cons )*
PNB
BOI
BOB
CBK
UNBK
OBC
INBK
CRPBK
ANDB
IDBI
DBNK
Public Aggregate
HDFC*
LICHF
DEWH
IHFL
IDFC
RECL
POWF
SHTF
MMFS
BAF
NBFC Aggregate
Buy
Buy
Buy
Neutra l
Buy
Buy
Neutra l
Buy
Buy
Buy
Buy
Buy
Neutra l
Neutra l
Buy
Buy
Buy
Buy
Neutra l
Neutra l
Neutra l
Neutra l
Buy
Buy
Buy
Buy
Neutra l
Buy
Buy
Buy
Neutra l
Buy
EPS (INR)
CMP
Mcap
(INR) (USDb) FY16 FY17
1,571
30.2 117.8 143.6
894
35.7 53.6 65.8
424
16.6 36.7 43.3
1,064
13.7 48.9 59.8
621
4.3
58.9 75.8
685
6.0
43.3 54.4
645
2.0
45.4 55.9
142
2.0
12.9 15.4
138
1.1
25.2 28.4
25
0.6
4.3
5.3
112.2
2,576
32.0 321.0 433.8
932
5.6 156.3 203.9
267
2.9
60.1 76.0
888
6.4 146.1 170.8
385
3.0
81.2 107.2
221
2.3
40.2 48.7
263
1.3
55.6 73.1
165
1.3
28.1 32.0
328
0.9
61.9 74.2
76
0.7
12.8 13.4
67
1.8
14.4 19.7
61
0.5
13.6 16.8
59.9
1,030
26.8
40
47
340
2.9
32
39
359
0.8
62
76
397
2.4
62
75
146
3.7
14
16
284
4.7
65
77
273
6.0
59
69
916
3.5
90
105
277
2.6
19
23
2,694
2.2
208 245
55.4
P/E (x)
FY16
11.0
16.7
11.5
21.8
10.5
15.8
14.2
11.0
5.5
6.0
14.6
7.7
6.0
4.4
6.1
4.7
5.5
4.7
5.9
5.3
5.9
4.6
4.5
7.3
16.2
10.5
5.8
6.4
10.6
4.4
4.7
10.1
14.3
13.0
11.5
BV (INR)
P/BV (x)
FY16
1.9
3.5
1.9
3.3
1.9
3.0
1.5
1.4
0.9
0.8
2.4
1.0
0.8
0.6
0.9
0.6
0.7
0.5
0.6
0.5
0.5
0.4
0.4
0.8
3.8
1.7
1.0
2.5
1.1
1.0
0.9
1.8
2.4
2.4
2.2
RoA (%)
RoE (%)
FY17 FY16 FY17
8.8
665 770
13.6 256 306
9.8
220 256
17.8 322 381
8.2
328 388
12.6 228 273
11.5 437 481
9.2
99
111
4.9
152 174
4.8
30
34
12.0
5.6 2,347 2,702
4.6 1,193 1,373
3.5
478 545
5.2
978 1,109
3.6
626 709
4.5
330 370
3.6
504 560
5.1
288 312
4.4
687 745
5.7
165 174
3.4
157 173
3.6
137 150
5.7
11.9 166 193
8.7
198 229
4.7
359 416
5.3
157 173
9.3
109 121
3.7
298 357
3.9
295 346
8.7
514 604
12.2 116 132
11.0 1,123 1,328
9.7
FY17 FY16 FY17 FY16 FY17
1.6 1.9
1.9 16.2 17.1
2.9 2.0
2.0 22.8 23.4
1.7 1.8
1.7 17.9 18.1
2.8 1.9
1.9 14.1 15.0
1.6 1.7
1.7 19.4 21.2
2.5 1.9
1.9 20.5 21.7
1.3 1.2
1.2 10.8 12.2
1.3 1.2
1.1 13.6 14.6
0.8 1.3
1.3 17.6 17.4
0.7 0.9
0.9 15.0 16.5
2.1
0.9 0.9
1.0 14.4 17.0
0.7 0.8
0.9 13.9 15.9
0.5 0.5
0.6 13.3 14.8
0.8 0.8
0.8 15.8 16.4
0.5 0.6
0.7 13.6 16.1
0.6 0.6
0.7 12.8 13.9
0.5 0.6
0.7 11.5 13.8
0.5 0.6
0.6 10.1 10.7
0.4 0.4
0.4 9.3 10.4
0.4 0.4
0.3 8.0 7.9
0.4 0.6
0.7 9.5 11.9
0.4 0.5
0.5 10.3 11.7
0.8
2.9 2.5
2.5 24.4 25.5
1.5 1.4
1.4 17.6 18.4
0.9 1.3
1.3 18.4 19.7
2.3 4.1
4.1 30.5 31.9
0.9 2.5
2.5 12.5 13.0
0.8 3.4
3.4 23.9 23.6
0.8 3.2
3.1 21.5 21.6
1.5 2.6
2.8 18.5 19.5
2.1 2.7
2.7 17.8 18.3
2.0 2.9
2.8 20.1 20.0
1.9
Dividend
Yield (%) #
1.7
1.0
1.1
0.1
1.3
0.8
1.1
1.5
2.9
2.8
1.5
1.3
2.3
2.9
3.3
2.4
3.4
2.8
2.5
3.6
2.4
3.4
1.5
1.5
2.8
7.0
1.9
3.9
3.9
0.9
1.4
1.3
*Multiples adj. for value of key ventures/Investments; For ICICI Bank and HDFC Ltd BV is adjusted for investments in subsidiaries
# Div Yield based on FY14 declared dividend; UR: Under Review
22 October 2014
10

Kotak Mahindra Bank
Financials and valuation
Income Statement (Standalone)
Y/E March
2014
Interes t Income
87,671
Interes t Expens e
50,471
Net Interest Income
37,201
Cha nge (%)
16.0
Non Interes t Income
13,997
Net Income
51,198
Cha nge (%)
17.3
Opera ti ng Expens es
25,426
Pre Provision Profits
25,772
Cha nge (%)
19.5
Provi s i ons (excl ta x)
3,047
PBT
22,725
Ta x
7,699
Ta x Ra te (%)
33.9
Standalone PAT
15,025
Cha nge (%)
10.4
Consolidated PAT
24,650
Cha nge (%)
12.6
Equity Dividend (Incl tax)
721
Core PPP (Standlone)*
22,149
Cha nge (%)
15.4
*Core PPP i s (NII+Fee i ncome-Opex)
2015E
96,416
54,095
42,321
13.8
18,066
60,387
17.9
31,526
28,861
12.0
1,588
27,273
9,273
34.0
18,000
19.8
29,760
20.7
870
24,861
12.2
(INR Million)
2016E
114,654
64,097
50,557
19.5
22,132
72,689
20.4
37,626
35,062
21.5
2,377
32,685
10,786
33.0
21,899
21.7
36,497
22.6
1,068
30,312
21.9
2017E
141,268
79,481
61,788
22.2
26,943
88,730
22.1
44,927
43,804
24.9
3,096
40,708
13,434
33.0
27,274
24.5
44,668
22.4
1,307
38,304
26.4
Ratios (Standalone)
Y/E March
Spreads Analysis (%)
Avg. Yield-Earning Assets
Avg. Yi el d on l oa ns
Avg. Yi el d on Inves tments
Avg. Cost-Int. Bear. Liab.
Avg. Cos t of Depos i ts
Interest Spread
Net Interest Margin
Profitability Ratios (%)
Cons ol i da ted RoE
Sta nda l one Core RoE
Sta nda l one RoA
Int. Expens e/Int.Income
Non Int. Inc./Net Income
Asset-Liability Profile (%)
Loa ns /Depos i t Ra ti o
Loa ns /(Depos i ts +Borrowi n
CASA Ra ti o
Inves tment/Depos i t Ra ti o
Inves t/(Depos i ts +Borrowi n
CAR
Ti er 1
2014
10.9
13.2
7.5
7.0
6.6
3.9
4.6
2015E
10.8
12.6
7.7
6.8
6.5
4.0
4.7
2016E
10.5
12.2
7.4
6.5
6.3
4.0
4.6
2017E
10.4
12.1
7.4
6.5
6.2
4.0
4.6
15.0
14.3
1.8
57.6
27.3
15.6
14.1
1.9
56.1
29.9
16.4
15.0
1.9
55.9
30.4
17.0
16.1
1.9
56.3
30.4
Balance Sheet (Standalone)
Y/E March
Equi ty Sha re Ca pi ta l
Res erves & Surpl us
Net Worth
Deposits
Cha nge (%)
of which CASA Dep
Cha nge (%)
Borrowi ngs
Other Li a bi l i ti es & Prov.
Total Liabilities
Current As s ets
Investments
Cha nge (%)
Loans
Cha nge (%)
Fi xed As s ets
Other As s ets
Total Assets
(INR Million)
2014
2015E
2016E
3,852
3,852
3,852
118,899 136,029 156,861
122,751 139,881 160,712
590,723 753,172 956,529
15.8
27.5
27.0
188,280 233,167 275,690
26.2
23.8
18.2
128,956 121,381 139,218
33,424
37,029
44,506
875,853 1,051,464 1,300,965
59,799
64,975
82,464
254,846 293,072 354,618
-11.7
15.0
21.0
530,276 657,543 821,928
9.4
24.0
25.0
11,069
11,044
10,919
19,863
24,829
31,036
875,853 1,051,464 1,300,965
2017E
3,852
182,828
186,680
1,205,226
26.0
334,653
21.4
159,505
53,513
1,604,924
98,937
429,087
21.0
1,027,410
25.0
10,693
38,796
1,604,924
89.8
73.7
31.9
43.1
35.4
18.8
17.8
87.3
75.2
31.0
38.9
33.5
19.2
17.7
85.9
75.0
28.8
37.1
32.4
17.9
16.5
85.2
75.3
27.8
35.6
31.4
16.9
15.6
Valuation
Book Va l ue (INR)
159.4
181.6
BV Growth (%)
25.9
14.0
AP/BV (x)
5.5
4.6
Cons ol BV (INR)
236.3
275.0
BV Growth (%)
15.7
16.4
Price-Consol BV (x)
4.5
3.9
Adjus ted BV (INR)*
149.5
171.5
AP/ABV (x)
5.9
4.8
Adjus ted Cons ol BV
230.9
269.4
Price-Consol ABV (x)
4.6
3.9
Sta nda l one EPS (INR)
18.9
22.6
EPS Growth (%)
6.6
19.8
Price-Earnings (x)
46.3
36.6
Cons ol EPS (INR)
33.0
39.9
Con. EPS Growth (%)
12.6
20.7
Price-Concol EPS (x)
32.1
26.6
Di vi dend Per Sha re (INR)
0.8
1.0
Dividend Yield (%)
0.1
0.1
E: MOSL Es ti ma tes ; * For Inves tments i n Subs a nd
Al l nos a re s ta nda l one unl es s s peci fi ed
* For Inves tments i n Subs a nd NPA,
208.6
14.9
3.8
322.5
17.3
3.3
197.8
4.0
316.0
3.4
27.5
21.7
28.5
48.9
22.6
21.7
1.2
0.1
NPA,
242.3
16.2
3.0
380.5
18.0
2.8
231.0
3.2
373.4
2.8
34.3
24.7
21.3
59.8
22.4
17.7
1.5
0.1
Asset Quality (Standalone) (Excl. acquired NPA)
GNPA (INR m)
NNPA (INR m)
GNPA Ra ti o
NNPA Ra ti o
PCR (Incl a cqui red NPA)
PCR (Excl a cqui red NPA)
E: MOSL Es ti ma tes
9,334
5,736
1.75
1.08
45.9
38.6
10,885
6,023
1.64
0.92
50.0
44.7
12,660
6,860
1.53
0.83
50.0
45.8
(%)
14,177
7,569
1.37
0.74
50.0
46.6
22 October 2014
11

This research report has been prepared by MOSt to provide information about the company(ies) and sector(s), if any, covered in the report and may be distributed by it and/or its affiliated company(ies). This
Kotak Mahindra Bank
report is for personal information of the select recipient and does not construe to be any investment, legal or taxation advice to you. This research report does not constitute an offer, invitation or inducement to
invest in securities or other investments and Motilal Oswal Securities Limited (hereinafter referred as MOSt) is not soliciting any action based upon it. This report is not for public distribution and has been
furnished to you solely for your general information and should not be reproduced or redistributed to any other person in any form. This report does not constitute a personal recommendation or take into
account the particular investment objectives, financial situations, or needs of individual clients. Before acting on any advice or recommendation in this material, investors should consider whether it is suitable
for their particular circumstances and, if necessary, seek professional advice. The price and value of the investments referred to in this material and the income from them may go down as well as up, and
investors may realize losses on any investments. Past performance is not a guide for future performance, future returns are not guaranteed and a loss of original capital may occur.
MOSt and its affiliates are a full-service, integrated investment banking, investment management, brokerage and financing group. We and our affiliates have investment banking and other business
relationships with a significant percentage of the companies covered by our Research Department Our research professionals provide important input into our investment banking and other business selection
processes. Investors should assume that MOSt and/or its affiliates are seeking or will seek investment banking or other business from the company or companies that are the subject of this material and that
the research professionals who were involved in preparing this material may participate in the solicitation of such business. The research professionals responsible for the preparation of this document may
interact with trading desk personnel, sales personnel and other parties for the purpose of gathering, applying and interpreting market information. Our research professionals are paid in part based on the
profitability of MOSt which include earnings from investment banking and other business. MOSt generally prohibits its analysts, persons reporting to analysts, and members of their households from
maintaining a financial interest in the securities or derivatives of any companies that the analysts cover. Additionally, MOSt generally prohibits its analysts and persons reporting to analysts from serving as an
officer, director, or advisory board member of any companies that the analysts cover. Our salespeople, traders, and other professionals or affiliates may provide oral or written market commentary or trading
strategies to our clients that reflect opinions that are contrary to the opinions expressed herein, and our proprietary trading and investing businesses may make investment decisions that are inconsistent with
the recommendations expressed herein. In reviewing these materials, you should be aware that any or all o the foregoing, among other things, may give rise to real or potential conflicts of interest . MOSt and
its affiliated company(ies), their directors and employees may; (a) from time to time, have a long or short position in, and buy or sell the securities of the company(ies) mentioned herein or (b) be engaged in
any other transaction involving such securities and earn brokerage or other compensation or act as a market maker in the financial instruments of the company(ies) discussed herein or act as an advisor or
lender/borrower to such company(ies) or may have any other potential conflict of interests with respect to any recommendation and other related information and opinions.
Unauthorized disclosure, use, dissemination or copying (either whole or partial) of this information, is prohibited. The person accessing this information specifically agrees to exempt MOSt or any of its
affiliates or employees from, any and all responsibility/liability arising from such misuse and agrees not to hold MOSt or any of its affiliates or employees responsible for any such misuse and further agrees to
hold MOSt or any of its affiliates or employees free and harmless from all losses, costs, damages, expenses that may be suffered by the person accessing this information due to any errors and delays. The
information contained herein is based on publicly available data or other sources believed to be reliable. Any statements contained in this report attributed to a third party represent MOSt’s interpretation of the
data, information and/or opinions provided by that third party either publicly or through a subscription service, and such use and interpretation have not been reviewed by the third party. This Report is not
intended to be a complete statement or summary of the securities, markets or developments referred to in the document. While we would endeavor to update the information herein on reasonable basis, MOSt
and/or its affiliates are under no obligation to update the information. Also there may be regulatory, compliance, or other reasons that may prevent MOSt and/or its affiliates from doing so. MOSt or any of its
affiliates or employees shall not be in any way responsible and liable for any loss or damage that may arise to any person from any inadvertent error in the information contained in this report. MOSt or any of
its affiliates or employees do not provide, at any time, any express or implied warranty of any kind, regarding any matter pertaining to this report, including without limitation the implied warranties of
merchantability, fitness for a particular purpose, and non-infringement. The recipients of this report should rely on their own investigations.
Recipients who are not institutional investors should seek advice of their independent financial advisor prior to taking any investment decision based on this report or for any necessary explanation of its
contents.
MOSt and/or its affiliates and/or employees may have interests/positions, financial or otherwise in the securities mentioned in this report. To enhance transparency, MOSt has incorporated a Disclosure of
Interest Statement in this document. This should, however, not be treated as endorsement of the views expressed in the report.
Disclosure of Interest Statement
Analyst ownership of the stock
KOTAK MAHINDRA BANK LTD
No
Disclosures
Analyst Certification
The views expressed in this research report accurately reflect the personal views of the analyst(s) about the subject securities or issues, and no part of the compensation of the research analyst(s) was, is, or
will be directly or indirectly related to the specific recommendations and views expressed by research analyst(s) in this report. The research analysts, strategists, or research associates principally responsible
for preparation of MOSt research receive compensation based upon various factors, including quality of research, investor client feedback, stock picking, competitive factors and firm revenues.
Regional Disclosures (outside India)
For U.K.
This report is not directed or intended for distribution to or use by any person or entity resident in a state, country or any jurisdiction, where such distribution, publication, availability or use would be contrary to
law, regulation or which would subject MOSt & its group companies to registration or licensing requirements within such jurisdictions.
This report is intended for distribution only to persons having professional experience in matters relating to investments as described in Article 19 of the Financial Services and Markets Act 2000 (Financial
Promotion) Order 2005 (referred to as "investment professionals"). This document must not be acted on or relied on by persons who are not investment professionals. Any investment or investment activity to
which this document relates is only available to investment professionals and will be engaged in only with such persons.
For U.S.
Motilal Oswal Securities Limited (MOSL) is not a registered broker - dealer under the U.S. Securities Exchange Act of 1934, as amended (the"1934 act") and under applicable state laws in the United States.
In addition MOSL is not a registered investment adviser under the U.S. Investment Advisers Act of 1940, as amended (the "Advisers Act" and together with the 1934 Act, the "Acts), and under applicable state
laws in the United States. Accordingly, in the absence of specific exemption under the Acts, any brokerage and investment services provided by MOSL, including the products and services described herein
are not available to or intended for U.S. persons.
This report is intended for distribution only to "Major Institutional Investors" as defined by Rule 15a-6(b)(4) of the Exchange Act and interpretations thereof by SEC (henceforth referred to as "major institutional
investors"). This document must not be acted on or relied on by persons who are not major institutional investors. Any investment or investment activity to which this document relates is only available to major
institutional investors and will be engaged in only with major institutional investors. In reliance on the exemption from registration provided by Rule 15a-6 of the U.S. Securities Exchange Act of 1934, as
amended (the "Exchange Act") and interpretations thereof by the U.S. Securities and Exchange Commission ("SEC") in order to conduct business with Institutional Investors based in the U.S., MOSL has
entered into a chaperoning agreement with a U.S. registered broker-dealer, Motilal Oswal Securities International Private Limited. ("MOSIPL"). Any business interaction pursuant to this report will have to be
executed within the provisions of this chaperoning agreement.
The Research Analysts contributing to the report may not be registered /qualified as research analyst with FINRA. Such research analyst may not be associated persons of the U.S. registered broker-dealer,
MOSIPL, and therefore, may not be subject to NASD rule 2711 and NYSE Rule 472 restrictions on communication with a subject company, public appearances and trading securities held by a research
analyst account.
Motilal Oswal Capital Markets Singapore Pte Limited is acting as an exempt financial advisor under section 23(1)(f) of the Financial Advisers Act(FAA) read with regulation 17(1)(d) of the Financial Advisors
Regulations and is a subsidiary of Motilal Oswal Securities Limited in India. This research is distributed in Singapore by Motilal Oswal Capital Markets Singapore Pte Limited and it is only directed in Singapore
to accredited investors, as defined in the Financial Advisers Regulations and the Securities and Futures Act (Chapter 289), as amended from time to time.
In respect of any matter arising from or in connection with the research you could contact the following representatives of Motilal Oswal Capital Markets Singapore Pte Limited:
Anosh Koppikar
Kadambari Balachandran
Email : anosh.Koppikar@motilaloswal.com
Email : kadambari.balachandran@motilaloswal.com
Contact : (+65)68189232
Contact : (+65) 68189233 / 65249115
Office Address : 21 (Suite 31),16 Collyer Quay,Singapore 04931
For Singapore
Motilal Oswal Securities Ltd
22 October 2014
Motilal Oswal Tower, Level 9, Sayani Road, Prabhadevi, Mumbai 400 025
Phone: +91 22 3982 5500 E-mail: reports@motilaloswal.com
12