4 November 2014
2QFY15 Results Update | Sector:
Metals
Jindal Steel & Power
BSE SENSEX
27,860
Bloomberg
Equity Shares (m)
52-Week Range (INR)
1, 6, 12 Rel. Per (%)
S&P CNX
8,324
JSP IN
914.9
350/128
-5/-54/-63
CMP: INR170
TP: INR198
Neutral
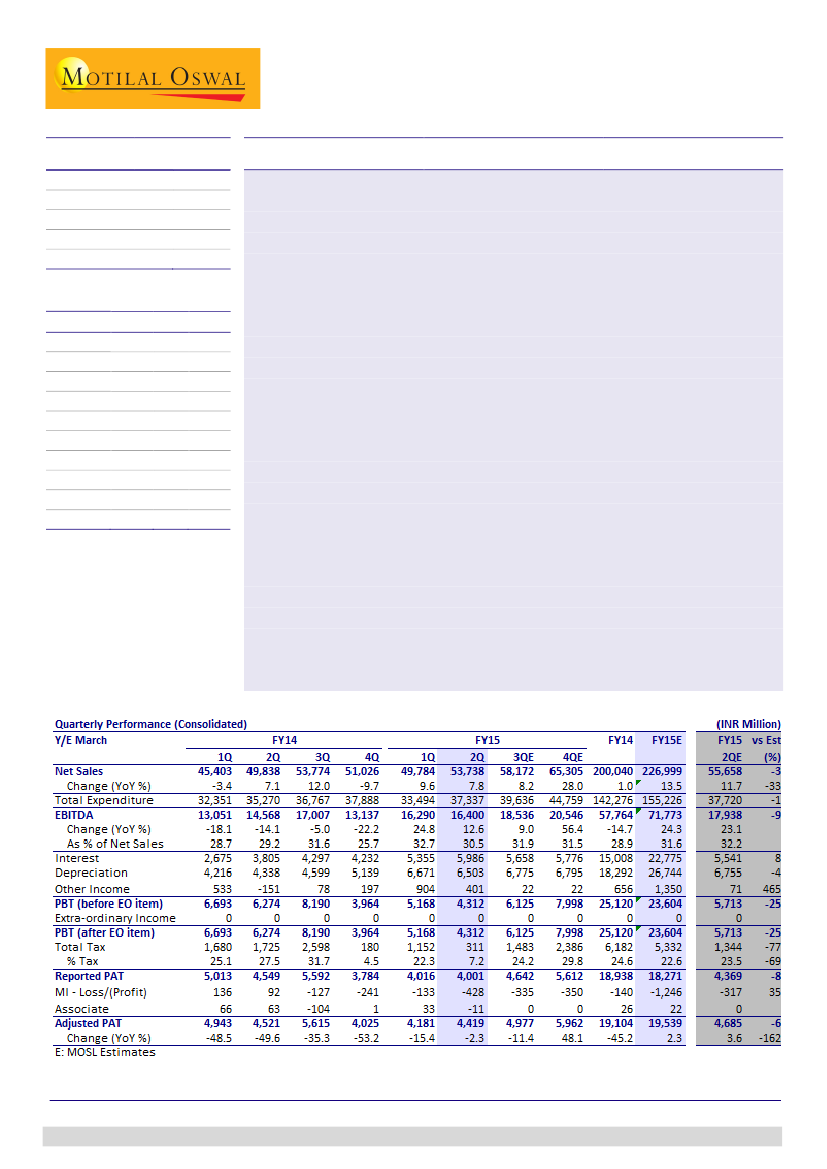
Operating performance in-line sans Wollongong coal mine
Consolidated EBITDA increased 1% QoQ to INR16.4b driven by better performance
of Jindal Power and Oman steel plant. WCL, Australia continues to incur heavy
losses. Standalone EBITDA was on expected line but for forex gains.
Raigarh steel plant’s capacity expansion to 3.6mtpa was completed in September,
while CGP and DRI units achieved 60% CU despite challenges in sourcing coal.
Pellet plant’s capacity utilization remained low at 50% due to shortage of iron ore.
PLF and rates improved at Jindal Power:
Jindal power achieved 22% QoQ growth
in power generation and EBITDA to INR5.2b. Power rates increased 8% QoQ to
INR3.56/kwh and EBITDA per unit remained flat QoQ at INR2/kwh.
PAT boosted by lower depreciation:
Depreciation declined 3% QoQ to INR6.5b
despite capitalization of new facilities. Pursuant to Companies’ act 2013, the
useful life of equipments has been recalculated. As a result, the PAT is higher by
INR397m. Consolidated PAT increased 6% QoQ to INR4.4b due to lower tax rate.
No provisioning for coal blocks:
JSPL has filed review petition in Supreme Court
regarding de-allocation of coal block and levy of INR295/ton of coal mined since
inception. Therefore, JSPL has not provided for it in the accounts.
Uncertain outlook:
The outlook remains uncertain due to de-allocation of coal
blocks and risk to long term iron ore supply pursuant to unfavorable observations
of recent CEC report on Sarda mines. We expect aggressive bidding for Gare Palma
coal blocks by number of steel and power units in Chhattisgarh and west Odisha.
Iron ore supply too will remain tight in Odisha/Jharkhand leading to higher costs.
Maintain Neutral:
We expect consolidated EBITDA to grow at CAGR of 13% over
FY14-17. Iron ore and coal availability/price and power PPA/FSA are potential risk
to our estimates. Stock is trading at FY16 PE of 8.3x and EV/EBITDA of 7.4x.
M.Cap. (INR b) / (USD b) 155.7/2.5
Financials & Valuation (INR Billion)
Y/E MAR
Net Sales
EBITDA
Adj PAT
EPS (INR)
Gr. (%)
RoE (%)
RoCE (%)
P/E (x)
P/BV (x)
EV/EBITDA(X)
2015E 2016E 2017E
227.0 282.7 321.3
71.8
18.4
20.1
-3.5
8.4
7.1
8.0
0.7
7.8
74.9
17.7
19.4
-3.9
8.1
6.8
8.3
0.6
7.4
82.7
21.3
23.3
20.3
9.0
7.8
6.9
0.6
6.5
Sanjay Jain
(SanjayJain@MotilalOswal.com); +91 22 3982 5412
Dhruv Muchhal
(Dhruv.Muchhal@MotilalOswal.com); +91 22 3027 8033
Investors are advised to refer through disclosures made at the end of the Research Report.