10 November 2014
2QFY15 Results Update | Sector:
Capital Goods
VA Tech Wabag
BSE SENSEX
27,875
Bloomberg
Equity Shares (m)
M.Cap. (INR b) / (USD b)
52-Week Range (INR)
1, 6, 12 Rel. Per (%)
S&P CNX
8,344
VATW IN
26.8
41.9/0.7
1,748/480
-9/76/110
CMP: INR1,565
n
TP: INR1,725
Buy
Performance below est., order inflows led by overseas projects
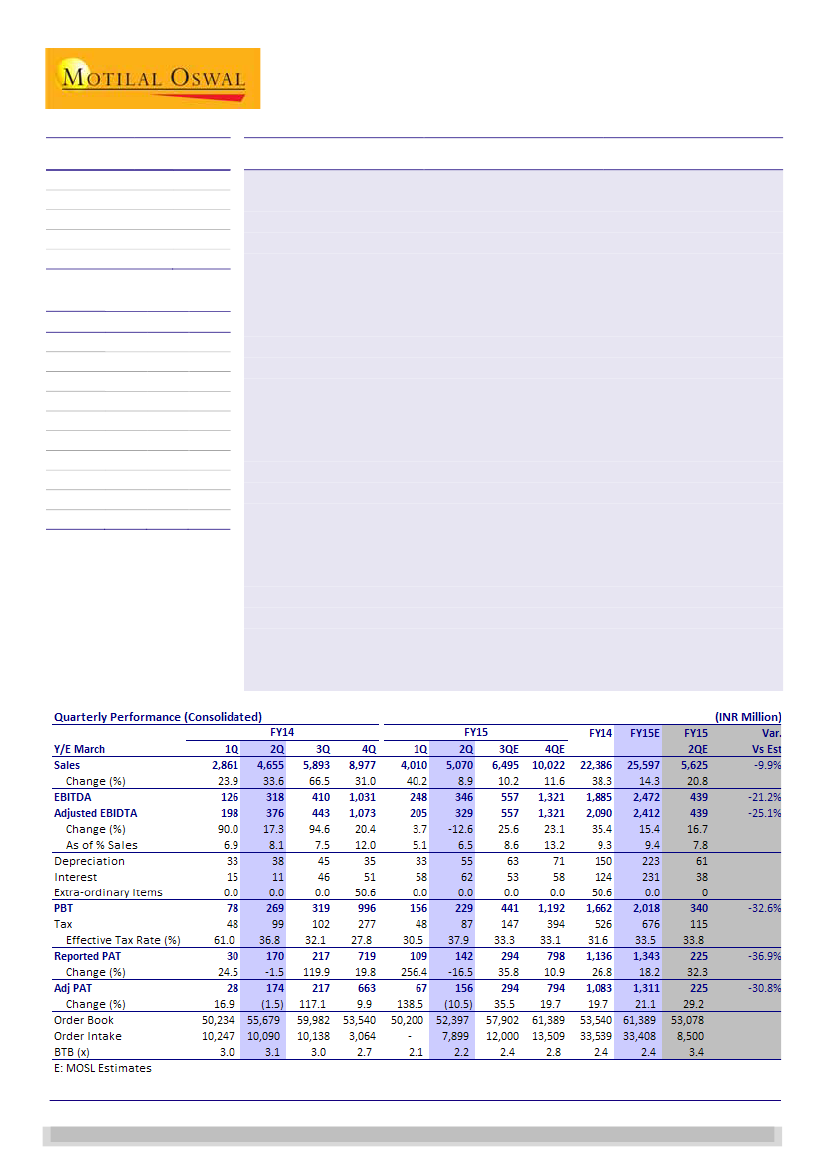
Operating performance below estimates:
2QFY15 consolidated revenue at
INR5.1b (up 8.9% YoY) was below estimate of INR5.6b, largely led by lower
revenue in overseas subsidiaries at INR2.7b (up 10% YoY) v/s estimate of INR3.3b.
Standalone revenue at INR2.4b (up 5% YoY) was in line. Management maintained
FY15 revenue guidance at INR26-27b v/s INR22.3b in FY14.
Adjusted EBITDA at INR329m (v/s est. of INR439m) was down 13% YoY and 25%
below estimate. Standalone EBITDA was in line at INR236m (v/s est. of INR250m),
while subsidiary EBITDA declined 51% YoY in 2QFY15 at INR93m and was
meaningfully below estimate of INR189m.
Achieves 25% of targeted firm order inflow in 1HFY15:
Order inflow in 1HFY15
stood at INR7.9b, led mainly by overseas orders (91% of inflows) and INR16.2b
including framework orders. For FY15, management maintained the order intake
guidance at INR32-34b and thus 1H represents ~50% of full year number.
Management stated that India orders are likely to remain constrained in FY15,
with contribution likely at ~15-20%. However, given the strong government
intent, several opportunities in treatment for sewage/effluent could open up with
Ganga Rejuvenation Plant (INR510b), Delhi Jal Board (INR190b) etc. VATW is
expanding into new geographies, including South East Asia, Sub-Sahara Africa,
Latam, Central Asia/Middle East (Turkey), with the initial orders having been
encouraging.
Valuation and view:
NWC stood at 72 days at end-2QFY15 v/s 49 in end-FY14,
given higher advances to sub-contractors and suppliers, and the attempt is to
curtail at FY14 levels. At CMP, VATW trades at 23x / 18x FY16E/17E EPS of
INR69.5 /85.2. Maintain
Buy
with a target price of INR1,725 (20x FY17E).
Financials & Valuation (INR billion)
Y/E MAR
Net Sales
EBITDA
Adj PAT
EPS(INR)
EPS Gr. (%)
BV/Sh.(INR)
RoE (%)
RoCE (%)
P/E (x)
P/BV (x)
2015E 2016E 2017E
25.6
2.5
1.3
49.5
21.1
356.9
13.8
22.2
31.6
4.4
32.1
3.2
1.8
69.5
40.5
412.4
16.8
25.3
22.5
3.8
36.8
3.8
2.3
85.2
22.5
480.0
17.7
26.7
18.4
3.3
n
n
n
n
Satyam Agarwal
(AgarwalS@MotilalOswal.com); +91 22 3982 5410
Amit Shah
(Amit.Shah@MotilalOswal.com) /
Nirav Vasa
(Nirav.Vasa@MotilalOswal.com)
Investors are advised to refer through disclosures made at the end of the Research Report.

VA Tech Wabag
2QFY15 Consolidated operating performance below expectations
n
n
2QFY15 consolidated revenues at INR5.1b (up 8.9% YoY) were below estimates
of INR5.6b; largely led by lower revenues in overseas subsidiaries at INR2.7b (up
10% YoY) vs estimate of INR3.3b, while standalone revenues at INR2.4b (up 5%
YoY) was in-line. Management has maintained FY15 revenue guidance at INR26-
27b, vs INR22.3b in FY14.
Municipal segment revenues were up 42% YoY (accounted for 68% of 2QFY15
revenues), while Industrial segment revenues declined 27% YoY. EPC revenues
grew just 6% YoY (accounted for 82% of 2QFY15 consolidated revenues), while
O&M revenues increased 25% YoY. O&M revenues have been supported by the
commissioning of the Nemmelli Desal project in Chennai.
Exhibit 2: EBITDA margins at 6.8% for 2QFY15
Cons EBITDA
1,200
Cons EBITDA (%)
20%
15%
10%
5%
0%
-5%
Exhibit 1: 2QFY15 consolidated revenue increased 9% YoY
Consolidated (INR - b)
34
YoY
66
24
2
31
40
9
32
16
6
0
11
-7
9
30
21
800
400
0
-400
-19
Source: MOSL, Company
Exhibit 3: Standalone revenues in line with expectations
Quarterly Performance
(Standalone)
Y/E March
Sales
Change (%)
EBITDA
Adjusted EBIDTA
Change (%)
As of % Sales
Depreciation
Interest
Extra-ordinary Items
PBT
Tax
Effective Tax Rate
(%)
Reported PAT
Change (%)
Adj PAT
Change (%)
E: MOSL Estimates
1Q
1,157
7.5
99
155
88.2
13.4
17
-9
0.0
91
30
33.3
61
5.2
61
31.8
FY14
2Q
3Q
2,199 2,912
4.8
5.1
265
272
296
274
8.8
6.8
13.5
9.4
18
20
-8
6
0.0
0.0
255
246
85
82
33.2
170
7.7
170
(3.2)
33.1
165
5.6
165
(2.8)
4Q
5,255
4.0
776
797
3.3
15.2
27
18
0.0
731
241
32.9
491
9.3
491
(3.8)
1Q
1,295
8.4
125
115
-25.9
8.9
-24
11
0.0
138
46
FY15
2Q
2,361
5.1
229
236
-20.5
10.0
33
20
0.0
175
59
FY14
3QE
3,145
4.5
363
363
32.5
11.6
37
18
0.0
308
102
33.0
207
207
25.6
FY15E
4QE
5,751 11,522 12,551
2.6
4.9
4.5
981 1,411 1,697
981 1,523 1,694
23.0
0.0
17.1
0.0
42
81
88
22
7
71
0.0
0.0
0.0
917 1,323 1,538
301
437
508
32.8
616
616
25.6
33.0
886
886
(INR Million)
FY15
2QE
2,375
4.4
250
250
-15.6
10.5
36
3
0
211
70
Var.
Vs Est
-0.6%
-8.5%
-5.7%
-17.1%
33.6
33.4
92
116
7.1
92
116
51.4
(31.6)
33.0
33.0
1,031
141
0.0
0.0
1,031
141
-
(17.0)
-17.6%
-17.6%
n
Adjusted consolidated EBIDTA at INR329m (vs est of INR439), was down 13%
YoY and 25% below estimates. Standalone EBIDTA was in-line at INR236m (vs
estimate of INR250m) and was impacted by provisions of INR50m towards
2
10 November 2014

VA Tech Wabag
n
receivables. As per the accounting practice, receivables exceeding 365 days are
charged off and this led to cumulative provisions of INR160m in 1HFY15.
Subsidiary EBITDA declined 51% YoY in 2QFY15 at INR93m and was meaningfully
below estimates of INR189m.
Adjusted consolidated PAT for 2QFY15 was at INR156m, down 11% YoY and
below estimates of INR225m. PAT was also impacted by higher debt servicing
charges which stood at INR62m for 2QFY15 vs est of INR38m.
Exhibit 4: Ten projects accounted for 39% of 1HFY15 revenues (INR M)
Project name
Al Gubrah
DAWASA
Nemmeli
Izmir
GECOL
RIL
Ajud & Ocna Mures
Ujmas
Madinah phase A
Melamchi
Country
Oman
Tanzania
Chennai
Turkey
Libya
India
Romania
Namibia
Saudi Arabia
Nepal
Capacity details
191 MLD, SWRO
130 MLD, WTP
100 MLD, Desal, O&M
360 MLD WTP
Demi & ECL
ETP
WWTP
WWTP
STP
85 MLD, WTP
Revenue recognized
989
373
350
333
312
248
245
227
225
220
Source: MOSL, Company
Achieved ~50% of order inflows guidance in 1HFY15 led by overseas / O&M
projects; Order inflow guidance maintained
n
n
n
n
n
n
Order inflow for 1HFY15 was at INR7.9b was led mainly by overseas orders
which accounted for 91% of order inflows at INR7.2b. Order inflows from Indian
operations were at INR734m, down 94% YoY. Including framework contracts,
order intake in 1HFY15 stood at INR16.2b; for FY15 the management has
maintained order intake guidance at INR32-34b and thus 1H represents ~50% of
the full year number.
Break-through orders received includes: i) INR1.4b from one of the largest oil
fields in Romania ii) INR3.1b O&M contract for managing all the waste
treatment plants in Istanbul iii) INR1.9b Waste Water treatment plant in Saudi
Arabia iv) Framework order of INR6.7b for an integrated water supply and
treatment project in Sri Lanka.
The management stated that India orders are likely to remain constrained in
FY15, with contribution likely at ~15-20%. Still, given the strong government
intent, several opportunities in treatment for sewage / effluent could open up,
with Ganga Rejuvenation Plant (INR510b), Delhi Jal Board (INR190b), etc.
Finalization of industrial orders remained lower for 1HFY15 at just INR781m vs
INR 7.6b, representing tepid pace of project finalization across industrial
segment. Municipal orders finalized for 1HFY15 were at INR7.2b down 44% YoY.
Order book at the end of 2QFY15 stood at INR52.4b (excluding INR 16.6b
framework contracts). EPC orders accounted for 2/3
rd
of the closing order book.
At the end of 2QFY15, consolidated BTB ratio stands at 2.2x down vs 3.1x in YoY.
10 November 2014
3

VA Tech Wabag
Exhibit 5: EPC orders account for 2/3 of closing order book
Municipal Order book
Industrial Order book
rd
Exhibit 6: O&M order book stable as compared to EPC orders
Wabag India Order book
Wabag Overseas Order book
23
10
23
11
25
13
25
13
28
13
27
14
29
14
29
14
36
21
23
30
21
29
25
27
34
37
Source: MOSL, Company
Exhibit 7: Major orders currently under execution / O&M phase
Project name
Nemmeli
Ulhasnagar
Istanbul
OWSSB
DAWASA
BWSSB
Melamchi
Ilugin
Al Ghubrah
Izmir
Country
India
India
Turkey
India
Tanzania
India
Nepal
Philippines
Oman
Turkey
Capacity details
100 MLD Desalination plant with O&M
195 MLD WTP with O&M
O&M
100 MLD STP
130 MLD WTP
90 MLD WWTP
85 MLD WTP
100 STP
191 MLD SWRO
360 MLD WTP
Order value (INR - b)
4.5
3.3
2.8
2.8
2.0
1.9
1.4
1.2
1.1
0.9
Source: MOSL, Company
NWC impacted given tight liquidity conditions
n
n
NWC on consolidated basis stood at 72 days at the end of 2QFY15 vs 49 days at
the end of FY14. Deterioration in NWC was mainly because of higher advances
to sub-contractors and suppliers, which are severely impacted by tight liquidity
conditions. Inventory days also increased from 6 at the end of FY14 to 13 at the
end of 2QFY15.
Outstanding debt increased to INR 2.5b at the end of 2QFY15, leading to Net
cash balance of INR855m on consolidated basis (vs INR3.1b in FY14).
Management stated that given the various initiatives, the intent is to curtail
NWC at similar levels in FY15 (vs FY14).
Exhibit 8: NWC deteriorates, impacting net cash
NWC days
Net Cash / (Debt) balance (INR M)
Cash & Bank balance
Borrowings
Net Cash / (Debt)
4QFY13
67
3,825
822
3,003
2QFY14
83
3,075
1,445
1,630
4QFY14
49
2QFY15
72
4,676
3,406
1,583
2,551
3,093
855
Source: MOSL, Company
10 November 2014
4

VA Tech Wabag
Valuation and outlook
n
n
n
At CMP of INR 1585, VATW trades 23x / 18x its FY16E / FY17E EPS of INR 69.5 /
85.2. For the period between FY15 – FY17E, we model Revenue / PAT CAGR of
20% / 30%.
VATW is attempting to expand into new geographies, including South East Asia
(from Philippines), Sub-Sahara Africa (from India), LatAm (from Spain), Central
Asia / ME (from Turkey), etc. Also, India is seeing strong government interest in
terms of sewage / effluent treatment into rivers (Ganga Plan INR510b, Delhi Jal
Board INR200b, etc) and this could open up interesting medium term
possibilities.
Maintain
Buy
rating on the stock with TP of INR 1725 (20x PER FY17E).
10 November 2014
5

VA Tech Wabag
VA Tech Wabag: an investment profile
Company description
VA Tech wabag (VATW) is one of the leading players in
water treatment industry, having its base of operation
globally operating from Chennai. VATW’s operations are
stretched across countries like Austria, Czech Republic,
Algeria, Tunisia, Romania, Turkey and Philippines.
Wabag has been operational in water treatment
industry since last 90 years and its has specialization in
treating municipal, industrial, sludge treatment and sea
water desalination projects.
Key investment risks
n
n
VATW’s global operations expose it to multiple
currencies. Exchange rate volatility could
significantly impact its earnings.
VATW is present in politically unstable countries
like Libya and Iran, where its peers have reported
delays in project execution. However, these
projects are backed by Dollar denominated LC’s,
which results in limited impact on Wabag’s
financials.
Order inflow for 1HFY15 was at INR7.9b. Major
orders bagged in 1HFY15 include a) O&M contract
in Istanbul (Euro 38m) b) Phase III of Al Karj WWTP
in Saudi Arabia (Euro 23m) and public water
treatment plant in Romania (Euro 17m).
Additionally, VATW also bagged framework
contract worth USD108m from Sri Lanka (funded by
EXIM Bank of India). Other framework contracts
bagged by Wabag would include INR 8.3b orders
from Libya.
Maintain
Buy,
with TP of INR1,725.
We remain
Positive
on the sector
Recent developments
Key investment arguments
n
n
n
n
VATW is attempting to expand into new
geographies, including South East Asia, Sub-Sahara
Africa, LatAm, Central Asia, etc.
In FY14, the company received initial orders in
Nepal, Tanzania, etc which also opens up interesting
growth possibilities to ramp-up the business. Order
intake in overseas subsidiaries has increased from
INR6-7b in FY12-13 to INR16.4b in FY14
O&M business contributed 20% of FY14 revenues
(where margins are higher at ~18-20%), vs ~12-13%
in projects. VATW intends to increase contribution
from O&M segment and intent is to move up the
value curve in terms of Refurbishment, Spare Parts,
Plant rehabilitation and automation, etc.
Wabag
21.1
40.5
4.4
3.8
1.6
1.2
16.1
11.6
Thermax
43.3
30.4
5.4
4.9
2.0
1.7
25.2
17.6
L&T
38.5
26.9
4.1
3.7
2.5
2.0
22.8
18.8
n
Valuation and view
n
Sector view
n
Comparative valuations
P/E (x)
P/BV (x)
EV/Sales (x)
EV/EBITDA (x)
FY15E
FY16E
FY15E
FY16E
FY15E
FY16E
FY15E
FY16E
EPS: MOSL forecast v/s consensus (INR)
MOSL
Forecast
FY15
FY16
49.4
69.4
Consensus
Forecast
54.5
67.8
Variation
(%)
-9.4
2.4
Target price and recommendation
Current
Price (INR)
1,565
Target
Price (INR)
1,725
Upside
(%)
10.2
Reco.
Buy
Shareholding pattern (%)
Sep-14
Promoter
DII
FII
Others
29.4
21.4
28.6
20.6
Jun-14
30.2
22.0
26.0
21.9
Sep-13
31.0
20.6
29.7
18.7
Stock performance (1-year)
Note: FII Includes depository receipts
10 November 2014
6

VA Tech Wabag
Financials and valuations
10 November 2014
7

Disclosures
This research report has been prepared by MOSt to provide information about the company(ies) and sector(s), if any, covered in the report and may be distributed by it and/or its affiliated company(ies). This
VA Tech Wabag
report is for personal information of the select recipient and does not construe to be any investment, legal or taxation advice to you. This research report does not constitute an offer, invitation or inducement to
invest in securities or other investments and Motilal Oswal Securities Limited (hereinafter referred as MOSt) is not soliciting any action based upon it. This report is not for public distribution and has been
furnished to you solely for your general information and should not be reproduced or redistributed to any other person in any form. This report does not constitute a personal recommendation or take into
account the particular investment objectives, financial situations, or needs of individual clients. Before acting on any advice or recommendation in this material, investors should consider whether it is suitable
for their particular circumstances and, if necessary, seek professional advice. The price and value of the investments referred to in this material and the income from them may go down as well as up, and
investors may realize losses on any investments. Past performance is not a guide for future performance, future returns are not guaranteed and a loss of original capital may occur.
MOSt and its affiliates are a full-service, integrated investment banking, investment management, brokerage and financing group. We and our affiliates have investment banking and other business
relationships with a significant percentage of the companies covered by our Research Department Our research professionals provide important input into our investment banking and other business selection
processes. Investors should assume that MOSt and/or its affiliates are seeking or will seek investment banking or other business from the company or companies that are the subject of this material and that
the research professionals who were involved in preparing this material may participate in the solicitation of such business. The research professionals responsible for the preparation of this document may
interact with trading desk personnel, sales personnel and other parties for the purpose of gathering, applying and interpreting market information. Our research professionals are paid in part based on the
profitability of MOSt which include earnings from investment banking and other business. MOSt generally prohibits its analysts, persons reporting to analysts, and members of their households from
maintaining a financial interest in the securities or derivatives of any companies that the analysts cover. Additionally, MOSt generally prohibits its analysts and persons reporting to analysts from serving as an
officer, director, or advisory board member of any companies that the analysts cover. Our salespeople, traders, and other professionals or affiliates may provide oral or written market commentary or trading
strategies to our clients that reflect opinions that are contrary to the opinions expressed herein, and our proprietary trading and investing businesses may make investment decisions that are inconsistent with
the recommendations expressed herein. In reviewing these materials, you should be aware that any or all o the foregoing, among other things, may give rise to real or potential conflicts of interest . MOSt and
its affiliated company(ies), their directors and employees may; (a) from time to time, have a long or short position in, and buy or sell the securities of the company(ies) mentioned herein or (b) be engaged in
any other transaction involving such securities and earn brokerage or other compensation or act as a market maker in the financial instruments of the company(ies) discussed herein or act as an advisor or
lender/borrower to such company(ies) or may have any other potential conflict of interests with respect to any recommendation and other related information and opinions.
Unauthorized disclosure, use, dissemination or copying (either whole or partial) of this information, is prohibited. The person accessing this information specifically agrees to exempt MOSt or any of its
affiliates or employees from, any and all responsibility/liability arising from such misuse and agrees not to hold MOSt or any of its affiliates or employees responsible for any such misuse and further agrees to
hold MOSt or any of its affiliates or employees free and harmless from all losses, costs, damages, expenses that may be suffered by the person accessing this information due to any errors and delays. The
information contained herein is based on publicly available data or other sources believed to be reliable. Any statements contained in this report attributed to a third party represent MOSt’s interpretation of the
data, information and/or opinions provided by that third party either publicly or through a subscription service, and such use and interpretation have not been reviewed by the third party. This Report is not
intended to be a complete statement or summary of the securities, markets or developments referred to in the document. While we would endeavor to update the information herein on reasonable basis, MOSt
and/or its affiliates are under no obligation to update the information. Also there may be regulatory, compliance, or other reasons that may prevent MOSt and/or its affiliates from doing so. MOSt or any of its
affiliates or employees shall not be in any way responsible and liable for any loss or damage that may arise to any person from any inadvertent error in the information contained in this report. MOSt or any of
its affiliates or employees do not provide, at any time, any express or implied warranty of any kind, regarding any matter pertaining to this report, including without limitation the implied warranties of
merchantability, fitness for a particular purpose, and non-infringement. The recipients of this report should rely on their own investigations.
Recipients who are not institutional investors should seek advice of their independent financial advisor prior to taking any investment decision based on this report or for any necessary explanation of its
contents.
MOSt and/or its affiliates and/or employees may have interests/positions, financial or otherwise in the securities mentioned in this report. To enhance transparency, MOSt has incorporated a Disclosure of
Interest Statement in this document. This should, however, not be treated as endorsement of the views expressed in the report.
Disclosure of Interest Statement
§
Analyst ownership of the stock
VA TECH WABAG
No
Analyst Certification
The views expressed in this research report accurately reflect the personal views of the analyst(s) about the subject securities or issues, and no part of the compensation of the research analyst(s) was, is, or
will be directly or indirectly related to the specific recommendations and views expressed by research analyst(s) in this report. The research analysts, strategists, or research associates principally responsible
for preparation of MOSt research receive compensation based upon various factors, including quality of research, investor client feedback, stock picking, competitive factors and firm revenues.
Regional Disclosures (outside India)
For U.K.
This report is not directed or intended for distribution to or use by any person or entity resident in a state, country or any jurisdiction, where such distribution, publication, availability or use would be contrary to
law, regulation or which would subject MOSt & its group companies to registration or licensing requirements within such jurisdictions.
This report is intended for distribution only to persons having professional experience in matters relating to investments as described in Article 19 of the Financial Services and Markets Act 2000 (Financial
Promotion) Order 2005 (referred to as "investment professionals"). This document must not be acted on or relied on by persons who are not investment professionals. Any investment or investment activity to
which this document relates is only available to investment professionals and will be engaged in only with such persons.
For U.S.
Motilal Oswal Securities Limited (MOSL) is not a registered broker - dealer under the U.S. Securities Exchange Act of 1934, as amended (the"1934 act") and under applicable state laws in the United States.
In addition MOSL is not a registered investment adviser under the U.S. Investment Advisers Act of 1940, as amended (the "Advisers Act" and together with the 1934 Act, the "Acts), and under applicable state
laws in the United States. Accordingly, in the absence of specific exemption under the Acts, any brokerage and investment services provided by MOSL, including the products and services described herein
are not available to or intended for U.S. persons.
This report is intended for distribution only to "Major Institutional Investors" as defined by Rule 15a-6(b)(4) of the Exchange Act and interpretations thereof by SEC (henceforth referred to as "major institutional
investors"). This document must not be acted on or relied on by persons who are not major institutional investors. Any investment or investment activity to which this document relates is only available to major
institutional investors and will be engaged in only with major institutional investors. In reliance on the exemption from registration provided by Rule 15a-6 of the U.S. Securities Exchange Act of 1934, as
amended (the "Exchange Act") and interpretations thereof by the U.S. Securities and Exchange Commission ("SEC") in order to conduct business with Institutional Investors based in the U.S., MOSL has
entered into a chaperoning agreement with a U.S. registered broker-dealer, Motilal Oswal Securities International Private Limited. ("MOSIPL"). Any business interaction pursuant to this report will have to be
executed within the provisions of this chaperoning agreement.
The Research Analysts contributing to the report may not be registered /qualified as research analyst with FINRA. Such research analyst may not be associated persons of the U.S. registered broker-dealer,
MOSIPL, and therefore, may not be subject to NASD rule 2711 and NYSE Rule 472 restrictions on communication with a subject company, public appearances and trading securities held by a research
analyst account.
Motilal Oswal Capital Markets Singapore Pte Limited is acting as an exempt financial advisor under section 23(1)(f) of the Financial Advisers Act(FAA) read with regulation 17(1)(d) of the Financial Advisors
Regulations and is a subsidiary of Motilal Oswal Securities Limited in India. This research is distributed in Singapore by Motilal Oswal Capital Markets Singapore Pte Limited and it is only directed in Singapore
to accredited investors, as defined in the Financial Advisers Regulations and the Securities and Futures Act (Chapter 289), as amended from time to time.
In respect of any matter arising from or in connection with the research you could contact the following representatives of Motilal Oswal Capital Markets Singapore Pte Limited:
Anosh Koppikar
Kadambari Balachandran
Email : anosh.Koppikar@motilaloswal.com
Email : kadambari.balachandran@motilaloswal.com
Contact : (+65)68189232
Contact : (+65) 68189233 / 65249115
Office Address : 21 (Suite 31),16 Collyer Quay,Singapore 04931
For Singapore
Motilal Oswal Securities Ltd
10 November 2014
Motilal Oswal Tower, Level 9, Sayani Road, Prabhadevi, Mumbai 400 025
Phone: +91 22 3982 5500 E-mail: reports@motilaloswal.com
8