13 November 2014
2QFY15 Results Update | Sector:
Metals
SAIL
BSE SENSEX
27,941
Bloomberg
Equity Shares (m)
52-Week Range (INR)
1, 6, 12 Rel. Per (%)
S&P CNX
8,358
SAIL IN
4,130.1
113/54
2/-12/-51
CMP: INR80
n
n
TP: INR104
Neutral
Operating leverage, lower staff and RM cost expanded margin
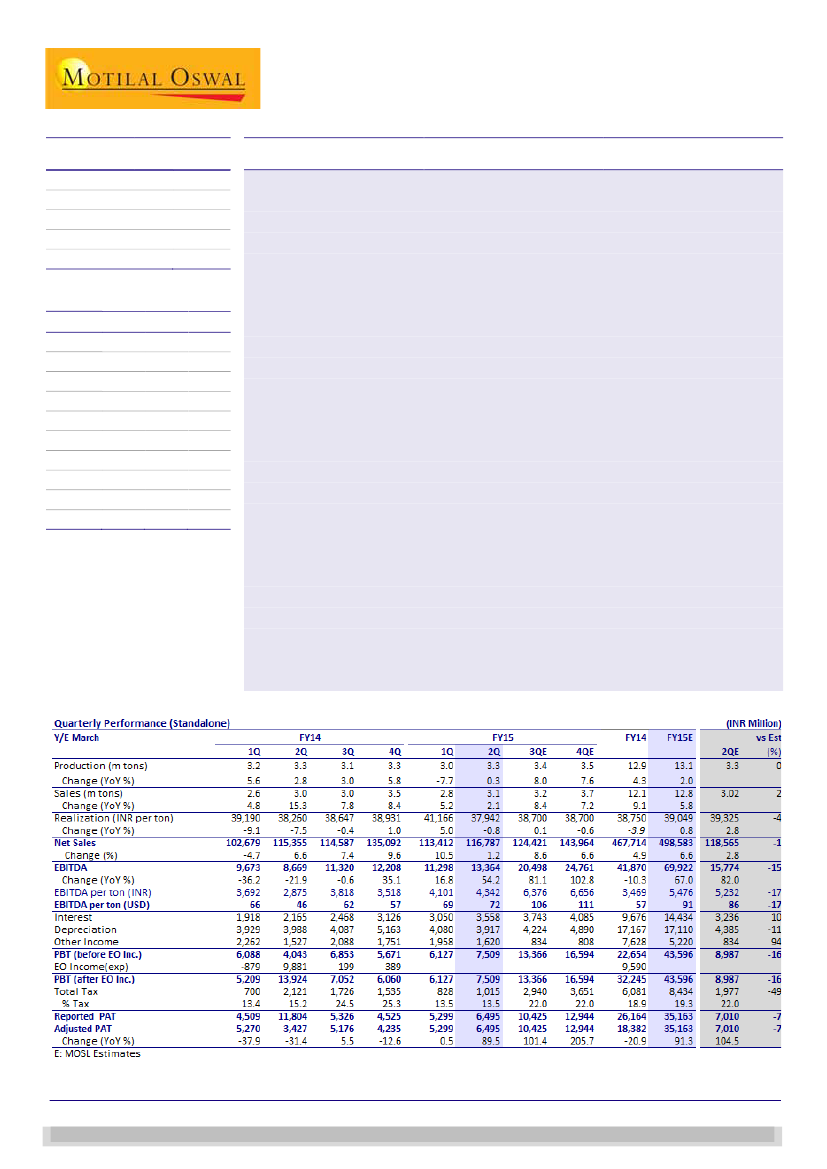
2QFY15 EBITDA grew a healthy 18% QoQ (54% YoY) to INR13.3b, it was 15% below
our estimate driven primarily by lower-than-expected realization.
While we had estimated realization to decline 4% QoQ on pricing pressure, the
decline was steeper at 8%. EBITDA per ton still improved 6% QoQ to INR4,342/t on
lower wage bill, raw material cost and operating leverage. Steel production
increased 11% QoQ to 3.3mt. Sales volumes increased 12% QoQ to 3.1mt.
Segmental EBIT of Bhilai steel plant increased 60% QoQ to INR8b, while other
plants witnessed no improvement in EBIT.
Interest expense increased 17% QoQ on capitalization of new production facilities.
Depreciation remained flat QoQ on reassessment of useful life of plants and
machinery pursuant to Companies Act 2013 becoming effective from April 1, 2014.
Other income remains high as SAIL continues to maintain high amount of liquid
funds. Adjusted PAT increased 23% QoQ to INR6.5b. Net debt remained
unchanged at ~INR230b. Capex was largely funded from internal accruals.
Company is likely to benefit from the commissioning of new 2.4mtpa steel
capacity at ISP, Burnpur, unlike Roorkela whose products are oversupplied. ISP,
Burnpur is likely to get fully commissioned during 2HFY15. We expect ISP to
contribute additional 2mt volumes in FY16E. This plant is well placed to cater to
the expected demand growth from construction sector.
Though Indian steel demand has so far failed to pick up, we expect a pick-up in
4QFY15.
We expect EBITDA to post a CAGR of 33% to INR107b over FY14-17E aided by the
benefit of operating leverage. Stock trades at FY16E EV/EBITDA of 6.5x. Maintain
Neutral.
M.Cap. (INR b) / (USD b) 331.6/5.4
Financials & Valuation (INR Billion)
Y/E MAR
Net Sales
EBITDA
Adj PAT
EPS (INR)
Gr. (%)
RoE (%)
RoCE (%)
P/E (x)
P/BV (x)
EV/EBITDA
( )
2015E 2016E 2017E
502.6
75.7
37.0
9.0
95.4
8.3
8.2
9.0
0.7
7.7
575.5
97.1
40.8
9.9
10.3
8.6
8.7
8.1
0.7
6.5
652.9
106.6
39.4
9.5
-3.5
7.8
8.2
8.4
0.6
6.1
n
n
n
n
n
n
Sanjay Jain
(SanjayJain@MotilalOswal.com); +91 22 3982 5412
Dhruv Muchhal
(Dhruv.Muchhal@MotilalOswal.com); +91 22 3027 8033
Investors are advised to refer through disclosures made at the end of the Research Report.