15 November 2014
2QFY15 Results Update | Sector:
Travels
Cox & Kings
BSE SENSEX
28,047
Bloomberg
Equity Shares (m)
M.Cap. (INR b) / (USD b)
52-Week Range (INR)
1, 6, 12 Rel. Per (%)
S&P CNX
8,390
COXK IN
136.5
42.1/0.7
366/94
0/79/131
CMP: INR306
TP: INR380
Buy
Financials & Valuation (INR m)
Y/E MAR
Net Sales
EBITDA
Adj PAT
EPS (INR)
Gr.h (%)
RoE (%)
RoCE (%)
P/E (x)
P/BV (x)
2015E 2016E 2017E
25,179 24,029 27,151
10,068 9,419 10,616
3,828
28.0
50.0
23.1
12.7
10.9
2.7
3,738
27.4
-2.4
139.7
21.6
14.3
11.2
2.2
4,549
33.3
21.7
170.7
21.5
16.2
9.2
1.8
BV/Sh.INR 114.1
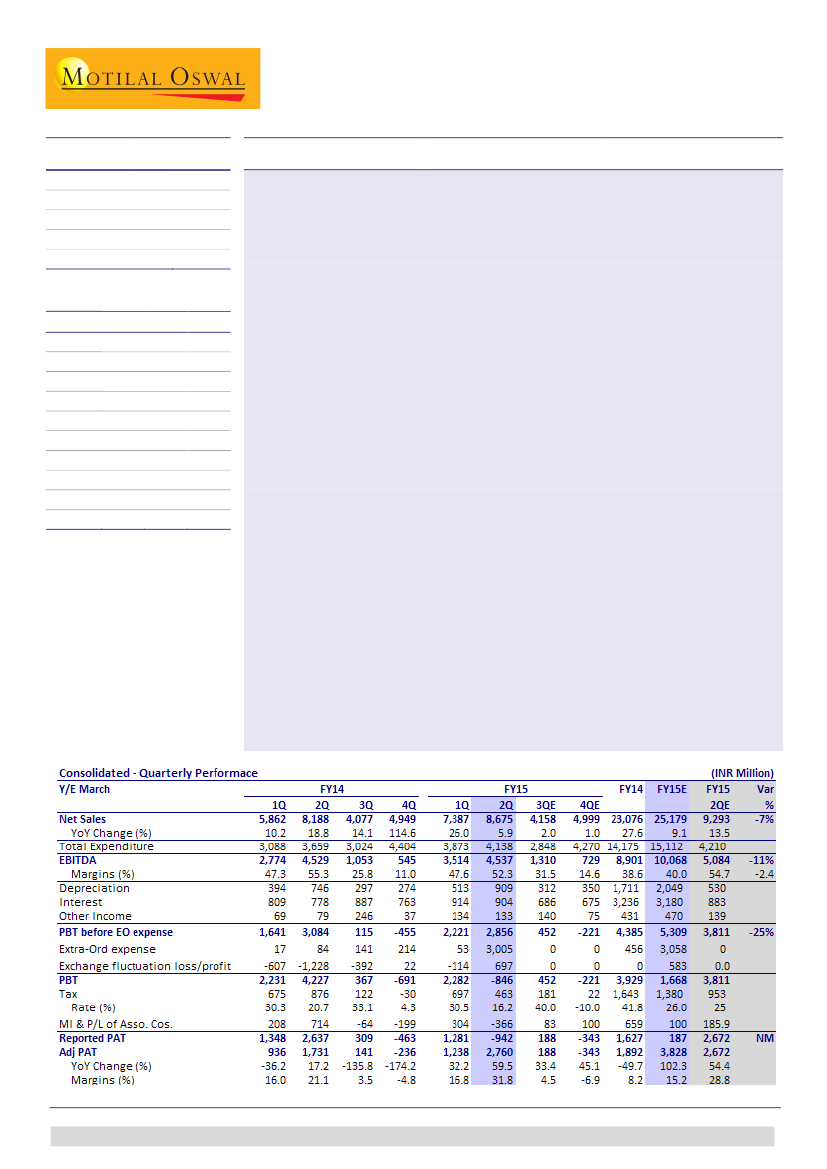
Results below estimates:
COXK reported overall revenue of INR8.8b (est. INR9.2b)
in 2QFY15, against INR8.2b in 2QFY14, marking a YoY growth of 6%. EBITDA
margin de-grew by 300bp, from 55.3% in 2QFY14 to 52.3% (est. 54.7%). Margin in
Leisure India and Education business expanded while Leisure international
business declined. PAT stood at INR(-942m) (est. INR2.67b), against INR2.63b in
2QFY14, primarily due to extraordinary writeoffs of goodwill on account of
camping sale amounting to INR5.5b and cancellation charges of forward contract
amounting to INR1b. Adjusting for this, PAT stood at INR2.7b, against INR1.7b,
making a YoY growth of 59.5%.
Strong growth in Education and Meininger business to drive margins:
During the
quarter, Education business posted revenue of INR2b, growing at 10% YoY, while
EBITDA grew 19% to INR1.1b. PGL and NST are showing strong performance, with
65% capacity utilization assisted by better utilization in lean season. Management
is planning to add 1,000 beds going forward in Australia and France, which will
drive growth. Meininger reported a revenue growth of 9% to INR950m, while
EBITDA growth was 17% to INR470m. It marked occupancy of 92%, against 87% in
FY14. Realization improved by 5.4% from 36 euro/bed to 27.4 euro/bed.
Management believes that demand exceeds supply, thus driving the higher
occupancy. Pre-booking for Meininger has already reached ~80% for FY16 and
12% for FY17, a testimony of robust demand.
Debt reduction on course:
With the sale of camping business, debt reduction in
on course, with net debt standing at INR34.7b, against INR39.6b in 1QFY15.
Management guided for further debt reduction of INR2b in FY15 and INR5b in
FY16 and FY17 each. We believe the company is on course for a debt reduction,
which will reduce net debt/equity to 1.2 by FY17E.
Valuation and view:
We remain optimistic on Education and Meininger business’
growth, given the capacity addition. We believe COXK is on the path of
deleveraging its balance sheet led by the sale of camping business. Company is
expected to post ~21% PAT CAGR over FY14-17E. The stock trades at 10.9x FY15E
and 11.2x FY16E earnings. We value COXK at 14x FY16E earnings of INR27.4, with a
target price of INR380. Maintain
Buy.
Niket Shah
(Niket.Shah@MotilalOswal.com); +91 22 3982 5426
Atul Mehra
(Atul.Mehra@MotilalOswal.com); +91 22 3982 5417
Investors are advised to refer through disclosures made at the end of the Research Report.

Cox & Kings
Results below estimates
COXK reported overall revenue of INR8.8b (est INR9.2b)in 2QFY15 as against
INR8.2b in 2QFY14 marking a YoY growth of 6%.
EBITDA margins de-grew by 300bps from 55.3% in 2QFY14 to 52.3% (est.54.7%)
primarily due to higher personnel expense of 140bps and increase in other
expense by 150bps.
Consequently, PAT stood at INR-942m (est.INR2.67b) as against INR2.63b in
2QFY14 primarily due to extraordinary write offs of goodwill on account of
camping sale amounting to INR5.5b and cancellation charges of forward
contract amounting to INR1b. Adjusting for extra ordinaries, PAT stood at
INR2.7b, against INR1.7b, making a YoY growth of 59.5%.
Exhibit 1: Sales trend
Sales (INR m)
404
7,387
239
5,320
6,890
5,862
3,572
25
4,077
2,306
-12
10.2
14.1
4,949
114.6
YoY growth (%)
8,675
26.0
26.0
Q1FY13
Q2FY13
Q3FY13
Q4FY13
Q1FY14
Q3FY14
Q4FY14
Q1FY15
Q2FY15
Source: Company, MOSL
Exhibit 2: EBITDA trend
EBITDA (INR m)
58.4
56.6
28.3
3,105
3,901
14.8
1,009 341
2,774
47.3
25.8
11.0
3,514
1,053
545
Margin (%)
47.6
52.3
Exhibit 3: PAT trend
PAT (INR m)
438.5
285.9
4,537
1,776 2,367
22
420.3
32.2
-942
-2,119 1,348 309 -463 1,281
36.7
-36.2 -135.8 -174.2
YoY Growth (%)
-297.9
Source: Company, MOSL
15 November 2014
2

Cox & Kings
Exhibit 4: Revenue mix
Revenues (INR m)
Leisure India
Leisure international
Education (Including Meininger)
Camping
Others
Total
EBITDA (INR m)
Leisure India
Leisure international
Education (Including Meininger)
Camping
Total
EBITDA margins (INR m)
Leisure India
Leisure international
Education (Including Meininger)
Camping
Total
Q1FY14
1,450
1,080
2,410
890
32
5,862
Q1FY14
890
230
1,320
390
2,774
Q1FY14
61.4%
21.3%
54.8%
43.8%
47.3%
Q2FY14
850
1,830
2,700
2,770
38
8,188
Q2FY14
390
900
1,380
1,890
4,560
Q2FY14
45.9%
49.2%
51.1%
68.2%
55.7%
Q3FY14
950
1,750
1,170
120
87
4,077
Q3FY14
430
610
310
-270
1,080
Q3FY14
45.3%
34.9%
26.5%
-225.0%
26.5%
Q4FY14
930
1,460
2,410
70
79
4,949
Q4FY14
360
330
270
-400
560
Q4FY14
38.7%
22.6%
11.2%
-571.4%
11.3%
Q1FY15
1,660
1,200
3,510
900
117
7,387
Q1FY15
1,020
270
2,020
240
3,550
Q1FY15
61.4%
22.5%
57.5%
26.7%
48.1%
Q2FY15
1000
1870
2940
2,630
235
8,675
Q2FY15
460
830
1630
1770
4,690
Q2FY15
46.0%
44.4%
55.4%
67.3%
54.1%
Source: Company, MOSL
Strong growth in Education business
During the quarter, education business posted revenue of INR2b growing at 10%
YoY while EBITDA grew 19% to INR1.1b. PGL and NST are showing strong
performance with 65% capacity utilization assisted by better utilization in lean
season.
Management is planning to add 1000 beds going forward in Australia and France
which will drive growth.
Meininger reported a revenue growth of 9% to INR950m while EBITDA growth
of 17% to INR470m. It marked occupancy of 92% as against 87% in FY14.
Realization improved by 5.4% from 36 euro’s/bed to 27.4 euro’s/bed.
Management believes that demand exceeds supply driving the higher
occupancy. Pre-booking for Meininger has already reached ~80% for FY16E and
12% for FY17E, testimony of robust demand
Leisure India business grew 17.6% to INR1b while Leisure International business
grew by 5.5% to INR1.8b.
Management expects 25% growth in India outbound business going forward.
15 November 2014
3

Cox & Kings
Exhibit 5: Education revenue growing strong
Total Education revenue (INR m)
15%
11%
7,119
6,386
FY15E
FY16E
FY17E
YoY Growth
14%
Exhibit 6: Number of beds to improve going forward
Total number of beds
13%
8,113
8,150
8,150
8,900
9,250
9,650
10,150
4,906
5,539
FY14
FY13
FY12
FY13
FY14
FY15E
FY16E
FY17E
Source: Company, MOSL
Exhibit 7: Meininger revenue trend
Exhibit 8: Strong expansion in Meininger
Number of beds
7,340
6,616
FY13
FY14
7,740
8,240
10,240
FY15E
FY16E
FY17E
Source: Company, MOSL
Exhibit 9: Net D/E to reduce significantly going forward
2.8
2.2
33,044
41,592
29,406
34,217
31,844
FY16E
Net Debt (INR m)
2.4
2.2
1.7
1.2
Net D/E
27,787
FY17E
FY12
FY13
FY14
FY15E
Source: Company, MOSL
Debt reduction on course
With the sale of camping business, debt reduction in on course with Net Debt
standing at INR34.7b as against 39.6b in 1QFY15.
Management has guided a further debt reduction of INR2b in FY15E and INR5b
in FY16E and FY17E each. We believe that company is on course for debt
reduction which will reduce net debt/equity to 1.2 by FY17E.
15 November 2014
4

Cox & Kings
Story in charts
Exhibit 10: Franchisee addition to drive growth
Number of Franchisee
150
94
56
153
155
155
165
175
185
Exhibit 11: Franchisee share revenues set to increase
Retail revenues breakup for FY14
Own store
and other
outlet , 50%
Franchisee
, 50%
FY09 FY10 FY11 FY12 FY13 FY14 FY15E FY16E FY17E
Source: Company, MOSL
Exhibit 12: Education and Leisure international business biggest contributor
Leisure India
Leisure International
Education (PGL + NST)
Meininger
Camping
32%
33%
35%
FY12
18%
27%
34%
21%
FY13
17%
14%
24%
27%
18%
FY14
15%
25%
27%
19%
FY15E
16%
30%
31%
23%
FY16E
17%
30%
30%
23%
FY17E
Source: Company, MOSL
Exhibit 13: Travel business is highly unorganized…
Exhibit 14: ..which will move towards organized market
Market Share FY12
Organised,
C&K, 4%
9%
Market Share FY15E
Organised, 1C&K, 7%
3%
Unorganise
d , 87%
Unorganised,
80%
Source: Company, MOSL
15 November 2014
5

Cox & Kings
Cox & Kings: an investment profile
Company description
Cox & Kings is the longest established travel company in
the world. Its India operations are headquartered in
Mumbai and have the status of a limited company.
Today, Cox & Kings is a premium brand in all travel
related services in the Indian subcontinent, employing
over 5000 trained professionals. It has over 12 fully
owned offices in India across key cities such as New
Delhi, Chennai, Bangalore, Kolkata, Ahmedabad, Kochi,
Hyderabad, Pune, Goa, Nagpur and Jaipur. The
worldwide offices are located in UK, USA, Japan, Russia,
Singapore and Dubai. It has associate offices in
Germany, Italy, Spain, South Africa, Sweden & Australia.
Key Investments
COXK is a largest player in domestic outbound travel
market enjoying 30% market share with industry
highest gross margins of ~20-22%.
COXK has 12 owned centers and also operates
through 156 franchisees across 110 cities in India
which contributes 50% of total domestic retail
revenues. It plans to add 10-15 franchisees every
year which will drive growth.
Through its world class infrastructure coupled with
high safety standards and superior customer
experience, it will be able to pull Local Education
Authorities’ (LEA) customers. LEA operates ~230
centers in UK, compared to PGL’s16 centres, thus
leaving a huge opportunity to gain market share.
Target price and recommendation
Current
Price (INR)
306
Target
Price (INR)
380
Upside
(%)
24.2
Reco.
Buy
All properties of the Meininger are on leased
basis, thus reducing stress on balance sheet and
making it an asset light model.
Superbreak was acquired in September 2011 as a
part of Holidaybreak acquisition which contributes
30% of the revenue and expected to grow at 15%
going forward.
Valuation and View
We remain optimistic on Education and Meininger
business’ growth, given the capacity addition. We
believe COXK is on the path of deleveraging its
balance sheet led by the sale of camping business.
Company is expected to post ~21% PAT CAGR over
FY14-17E. The stock trades at 10.9x FY15E and
11.2x FY16E earnings. We value COXK at 14x FY16E
earnings of INR27.4, with a target price of INR380.
Maintain
Buy.
EPS: MOSL forecast v/s consensus (INR)
MOSL
Forecast
FY15
FY16
28.0
27.4
Consensus
Forecast
23.8
28.6
Variation
(%)
17.6
-4.2
Shareholding pattern (%)
Sep-14
Promoter
DII
FII
Others
59.5
3.5
22.8
14.1
Jun-14
59.5
4.9
20.7
14.9
Sep-13
59.9
8.3
15.6
16.3
Stock performance (1-year)
Note: FII Includes depository receipts
15 November 2014
6

Cox & Kings
Financials and valuations
Income statement
Y/E March
Net Sales
Change (%)
EBITDA
EBITDA Margin (%)
Depreciation
EBIT
Interest
Other Income
Extraordinary items
PBT
Tax
Tax Rate (%)
Min. Int. & Assoc. Share
Reported PAT
Adjusted PAT
Change (%)
2014
23,076
27.6
8,901
38.6
1,711
7,190
3,236
431
-1,748
6,133
1,643
26.8
-659
3,832
2,552
-12.7
2015E
25,179
9.1
10,068
40.0
2,049
8,019
3,180
470
3,641
1,668
1,380
82.8
-100
187
3,828
50.0
(INR Million)
2016E
24,029
-4.6
9,419
39.2
1,297
8,122
2,421
448
0
6,150
1,722
28.0
-690
3,738
3,738
-2.4
2017E
27,151
13.0
10,616
39.1
1,646
8,970
2,061
507
0
7,415
2,076
28.0
-790
4,549
4,549
21.7
Ratios
Y/E March
Basic (INR)
EPS
Cash EPS
Book Value
DPS
Payout (incl. Div. Tax.)
Valuation(x)
P/E
Cash P/E
Price / Book Value
EV/Sales
EV/EBITDA
Dividend Yield (%)
Profitability Ratios (%)
RoE
RoCE
Turnover Ratios (%)
Asset Turnover (x)
Debtors (No. of Days)
Inventory (No. of Days)
Creditors (No. of Days)
Leverage Ratios (%)
Net Debt/Equity (x)
2014
18.7
31.2
128.5
1.0
4.2
16.4
9.8
2.4
3.6
9.4
0.3
16.6
11.4
0.3
180
3
340
3.2
2015E
28.0
43.0
114.1
1.0
85.0
10.9
7.1
2.7
3.0
7.6
0.3
23.1
12.7
0.4
180
3
332
2.9
2016E
27.4
36.9
139.7
1.5
6.4
11.2
8.3
2.2
3.1
7.9
0.5
21.6
14.3
0.3
180
3
337
2.1
2017E
33.3
45.4
170.7
2.0
7.0
9.2
6.7
1.8
2.6
6.6
0.7
21.5
16.2
0.4
185
3
332
1.5
Balance sheet
Y/E March
Share Capital
Reserves
Net Worth
Debt
Deferred Tax
Total Capital Employed
Gross Fixed Assets
Less: Acc Depreciation
Net Fixed Assets
Capital WIP
Investments
Current Assets
Inventory
Debtors
Cash & Bank
Loans & Adv, Others
Curr Liabs & Provns
Curr. Liabilities
Provisions
Net Current Assets
Total Assets
2014
683
16,867
17,549
55,981
700
82,435
32,739
8,123
24,616
1,506
602
37,551
199
11,356
13,786
12,209
22,373
21,485
888
15,178
82,435
2015E
683
14,895
15,577
44,981
700
69,563
30,299
10,172
20,127
1,506
602
36,195
212
12,391
10,162
13,430
23,882
22,905
977
12,313
69,563
(INR Million)
2016E
2017E
683
683
18,393 22,624
19,076 23,306
39,981 34,981
700
700
68,752 68,772
32,049 33,799
11,468 13,115
20,580 20,684
1,506
1,506
602
602
34,338 36,837
205
232
11,825 13,762
7,534
6,592
14,773 16,251
23,289 25,872
22,214 24,690
1,075
1,182
11,049 10,965
68,751 68,772
E: MOSL Estimates
Cash flow statement
Y/E March
OP/(Loss) before Tax
Depreciation
Others
Interest
Direct Taxes Paid
(Inc)/Dec in Wkg Cap
CF from Op. Activity
(Inc)/Dec in FA & CWIP
(Pur)/Sale of Invt
Others
CF from Inv. Activity
Inc/(Dec) in Net Worth
Inc / (Dec) in Debt
Interest Paid
Divd Paid (incl Tax)
CF from Fin. Activity
Inc/(Dec) in Cash
Add: Opening Balance
Closing Balance
2014
4,385
1,711
0
2,805
-1,643
-1,008
5,772
-19,982
4,062
2,635
-13,285
0
9,218
-3,236
-159
8,606
1,093
12,693
13,786
2015E
5,309
2,049
0
2,710
-1,380
-760
4,287
7,959
0
-1,530
6,429
0
-11,000
-3,180
-159
-14,340
-3,624
13,786
10,162
(INR Million)
2016E
6,150
1,297
0
1,973
-1,722
-1,363
6,335
-1,750
0
448
-1,302
0
-5,000
-2,421
-239
-7,660
-2,627
10,162
7,534
2017E
7,415
1,646
0
1,555
-2,076
-859
7,681
-1,750
0
507
-1,243
0
-5,000
-2,061
-319
-7,380
-942
7,534
6,592
15 November 2014
7

Disclosures
This research report has been prepared by MOSt to provide information about the company(ies) and sector(s), if any, covered in the report and may be distributed by it and/or its affiliated company(ies). This
Cox & Kings
report is for personal information of the select recipient and does not construe to be any investment, legal or taxation advice to you. This research report does not constitute an offer, invitation or inducement to
invest in securities or other investments and Motilal Oswal Securities Limited (hereinafter referred as MOSt) is not soliciting any action based upon it. This report is not for public distribution and has been
furnished to you solely for your general information and should not be reproduced or redistributed to any other person in any form. This report does not constitute a personal recommendation or take into
account the particular investment objectives, financial situations, or needs of individual clients. Before acting on any advice or recommendation in this material, investors should consider whether it is suitable
for their particular circumstances and, if necessary, seek professional advice. The price and value of the investments referred to in this material and the income from them may go down as well as up, and
investors may realize losses on any investments. Past performance is not a guide for future performance, future returns are not guaranteed and a loss of original capital may occur.
MOSt and its affiliates are a full-service, integrated investment banking, investment management, brokerage and financing group. We and our affiliates have investment banking and other business
relationships with a significant percentage of the companies covered by our Research Department Our research professionals provide important input into our investment banking and other business selection
processes. Investors should assume that MOSt and/or its affiliates are seeking or will seek investment banking or other business from the company or companies that are the subject of this material and that
the research professionals who were involved in preparing this material may participate in the solicitation of such business. The research professionals responsible for the preparation of this document may
interact with trading desk personnel, sales personnel and other parties for the purpose of gathering, applying and interpreting market information. Our research professionals are paid in part based on the
profitability of MOSt which include earnings from investment banking and other business. MOSt generally prohibits its analysts, persons reporting to analysts, and members of their households from
maintaining a financial interest in the securities or derivatives of any companies that the analysts cover. Additionally, MOSt generally prohibits its analysts and persons reporting to analysts from serving as an
officer, director, or advisory board member of any companies that the analysts cover. Our salespeople, traders, and other professionals or affiliates may provide oral or written market commentary or trading
strategies to our clients that reflect opinions that are contrary to the opinions expressed herein, and our proprietary trading and investing businesses may make investment decisions that are inconsistent with
the recommendations expressed herein. In reviewing these materials, you should be aware that any or all o the foregoing, among other things, may give rise to real or potential conflicts of interest . MOSt and
its affiliated company(ies), their directors and employees may; (a) from time to time, have a long or short position in, and buy or sell the securities of the company(ies) mentioned herein or (b) be engaged in
any other transaction involving such securities and earn brokerage or other compensation or act as a market maker in the financial instruments of the company(ies) discussed herein or act as an advisor or
lender/borrower to such company(ies) or may have any other potential conflict of interests with respect to any recommendation and other related information and opinions.
Unauthorized disclosure, use, dissemination or copying (either whole or partial) of this information, is prohibited. The person accessing this information specifically agrees to exempt MOSt or any of its
affiliates or employees from, any and all responsibility/liability arising from such misuse and agrees not to hold MOSt or any of its affiliates or employees responsible for any such misuse and further agrees to
hold MOSt or any of its affiliates or employees free and harmless from all losses, costs, damages, expenses that may be suffered by the person accessing this information due to any errors and delays. The
information contained herein is based on publicly available data or other sources believed to be reliable. Any statements contained in this report attributed to a third party represent MOSt’s interpretation of the
data, information and/or opinions provided by that third party either publicly or through a subscription service, and such use and interpretation have not been reviewed by the third party. This Report is not
intended to be a complete statement or summary of the securities, markets or developments referred to in the document. While we would endeavor to update the information herein on reasonable basis, MOSt
and/or its affiliates are under no obligation to update the information. Also there may be regulatory, compliance, or other reasons that may prevent MOSt and/or its affiliates from doing so. MOSt or any of its
affiliates or employees shall not be in any way responsible and liable for any loss or damage that may arise to any person from any inadvertent error in the information contained in this report. MOSt or any of
its affiliates or employees do not provide, at any time, any express or implied warranty of any kind, regarding any matter pertaining to this report, including without limitation the implied warranties of
merchantability, fitness for a particular purpose, and non-infringement. The recipients of this report should rely on their own investigations.
Recipients who are not institutional investors should seek advice of their independent financial advisor prior to taking any investment decision based on this report or for any necessary explanation of its
contents.
MOSt and/or its affiliates and/or employees may have interests/positions, financial or otherwise in the securities mentioned in this report. To enhance transparency, MOSt has incorporated a Disclosure of
Interest Statement in this document. This should, however, not be treated as endorsement of the views expressed in the report.
Disclosure of Interest Statement
Analyst ownership of the stock
COX AND KINGS
No
Analyst Certification
The views expressed in this research report accurately reflect the personal views of the analyst(s) about the subject securities or issues, and no part of the compensation of the research analyst(s) was, is, or
will be directly or indirectly related to the specific recommendations and views expressed by research analyst(s) in this report. The research analysts, strategists, or research associates principally responsible
for preparation of MOSt research receive compensation based upon various factors, including quality of research, investor client feedback, stock picking, competitive factors and firm revenues.
Regional Disclosures (outside India)
For U.K.
This report is not directed or intended for distribution to or use by any person or entity resident in a state, country or any jurisdiction, where such distribution, publication, availability or use would be contrary to
law, regulation or which would subject MOSt & its group companies to registration or licensing requirements within such jurisdictions.
This report is intended for distribution only to persons having professional experience in matters relating to investments as described in Article 19 of the Financial Services and Markets Act 2000 (Financial
Promotion) Order 2005 (referred to as "investment professionals"). This document must not be acted on or relied on by persons who are not investment professionals. Any investment or investment activity to
which this document relates is only available to investment professionals and will be engaged in only with such persons.
Motilal Oswal Securities Limited (MOSL) is not a registered broker - dealer under the U.S. Securities Exchange Act of 1934, as amended (the"1934 act") and under applicable state laws in the United States.
In addition MOSL is not a registered investment adviser under the U.S. Investment Advisers Act of 1940, as amended (the "Advisers Act" and together with the 1934 Act, the "Acts), and under applicable state
laws in the United States. Accordingly, in the absence of specific exemption under the Acts, any brokerage and investment services provided by MOSL, including the products and services described herein
are not available to or intended for U.S. persons.
This report is intended for distribution only to "Major Institutional Investors" as defined by Rule 15a-6(b)(4) of the Exchange Act and interpretations thereof by SEC (henceforth referred to as "major institutional
investors"). This document must not be acted on or relied on by persons who are not major institutional investors. Any investment or investment activity to which this document relates is only available to major
institutional investors and will be engaged in only with major institutional investors. In reliance on the exemption from registration provided by Rule 15a-6 of the U.S. Securities Exchange Act of 1934, as
amended (the "Exchange Act") and interpretations thereof by the U.S. Securities and Exchange Commission ("SEC") in order to conduct business with Institutional Investors based in the U.S., MOSL has
entered into a chaperoning agreement with a U.S. registered broker-dealer, Motilal Oswal Securities International Private Limited. ("MOSIPL"). Any business interaction pursuant to this report will have to be
executed within the provisions of this chaperoning agreement.
The Research Analysts contributing to the report may not be registered /qualified as research analyst with FINRA. Such research analyst may not be associated persons of the U.S. registered broker-dealer,
MOSIPL, and therefore, may not be subject to NASD rule 2711 and NYSE Rule 472 restrictions on communication with a subject company, public appearances and trading securities held by a research
analyst account.
Motilal Oswal Capital Markets Singapore Pte Limited is acting as an exempt financial advisor under section 23(1)(f) of the Financial Advisers Act(FAA) read with regulation 17(1)(d) of the Financial Advisors
Regulations and is a subsidiary of Motilal Oswal Securities Limited in India. This research is distributed in Singapore by Motilal Oswal Capital Markets Singapore Pte Limited and it is only directed in Singapore
to accredited investors, as defined in the Financial Advisers Regulations and the Securities and Futures Act (Chapter 289), as amended from time to time.
In respect of any matter arising from or in connection with the research you could contact the following representatives of Motilal Oswal Capital Markets Singapore Pte Limited:
Anosh Koppikar
Kadambari Balachandran
Email : anosh.Koppikar@motilaloswal.com
Email : kadambari.balachandran@motilaloswal.com
Contact : (+65)68189232
Contact : (+65) 68189233 / 65249115
Office Address : 21 (Suite 31),16 Collyer Quay,Singapore 04931
For U.S.
For Singapore
Motilal Oswal Securities Ltd
15 November 2014
Motilal Oswal Tower, Level 9, Sayani Road, Prabhadevi, Mumbai 400 025
Phone: +91 22 3982 5500 E-mail: reports@motilaloswal.com
8