7 January 2015
Mahindra CIE
spotlight
The Idea Junction
Stock Info
Bloomberg
MACA IN
CMP (INR)
207
Equity Shares (m)
322.0
M.Cap. (INR b)/(USD b)
66.6/1.1
52-Week Range (INR)
251/47
1,6,12 Rel. Perf. (%)
-11/19/256
Focused management to drive turnaround
Mahindra Forgings Europe (MFE) already witnessing sharp improvement
Financials & Valuation (INR m)
Y/E March*
Sales
EBITDA
NP
Adj. EPS (INR)
EPS Gr. (%)
BV/Sh. (INR)
RoE (%)
RoCE (%)
Valuations
P/E (x)
P/BV (x)
EV/EBITDA (x)
27.2
2.8
12.3
18.1
2.4
9.4
13.6
2.1
7.3
2015E 2016E 2017E
54,101 59,986 67,716
6,260 7,739 9,370
2,450 3,684 4,906
8
LP
74
13.1
12.1
11
0.5
85
14.4
13.7
15
0.3
100
16.5
15.9
Management change brings focus, expertise and experience
Synergistic alliance, with complementary product portfolio
Key drivers - turnaround in MFE, growth in India
Margin expansion, improving asset turnover to drive EPS growth and RoE
Management change brings focus, expertise and experience
Mahindra CIE (MACA), an amalgamation of Mahindra Systech's auto components
business and CIE's Europe forgings business, has witnessed management change.
CIE Automotive now has ~53% stake, while M&M has ~20%. CIE is a focused global
player in auto components, with demonstrated ability to improve performance
of inefficient companies. CIE has an objective of profitable growth, led by financial
prudence, targeting FCF of at least 40% of EBITDA, RoCE of >15%, and net debt-
EBITDA of <2x.
* Assuming merger w.e.f 1/Apr/2013
Synergistic alliance, with complementary product portfolio
This alliance consolidates the two entities into a large global components supplier,
creating a global forgings player, having presence across key markets (except
Japan and Korea). Mahindra CIE would have a complementary product portfolio
and market mix. It also ensures a larger product and technology portfolio,
addressing the need to continuously upgrade operations. MACA will benefit from
leveraging the group's product portfolio and CIE's global customers to drive growth
in India. MACA will help CIE to drive market share in Asia, resulting in balanced
market mix for CIE.
Shareholding pattern (%)
As on
Jun-14 Mar-14
Promoter 41.3
41.6
DII
0.3
0.2
FII
13.8
14.4
Others
44.6
43.8
Jun-13
41.7
0.2
11.4
46.7
Notes: FII includes depository receipts
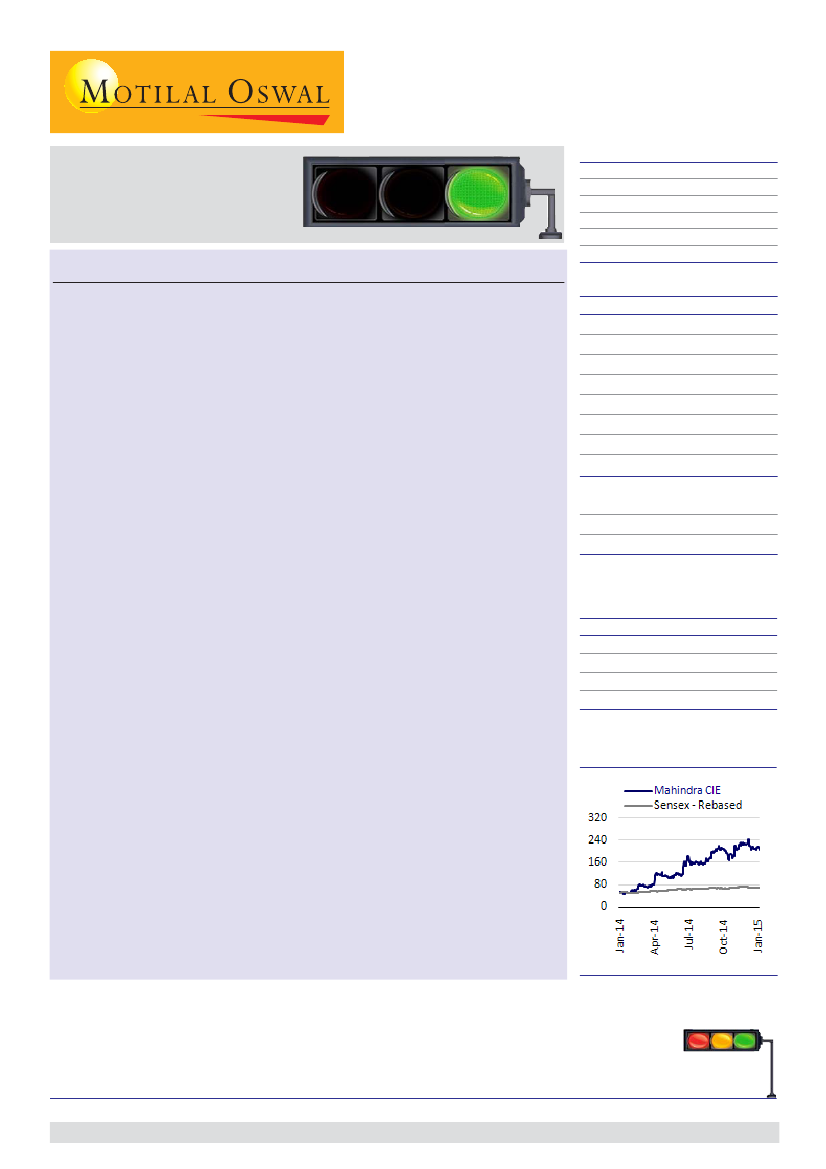
Stock performance (1 year)
Key drivers - turnaround in MFE, growth in India
CIE has set out the key medium-term focus areas for MACA as (1) turning around
MFE, and (b) improving productivity and entry in CIE's product and customer base
in India. MFE's operating performance has begun improving, led by (a) new
management team, (b) headcount reduction, (c) price renegotiation for select
parts with customers, and (d) process improvement. In 9MCY14, MFE's EBIT margin
expanded to 6.3% (target of ~6% by CY16). MCI (India) would be the key growth
driver for MACA and CIE, as it expands its horizons, leveraging on CIE's product
Spotlight
is a new offering from the Research team at Motilal Oswal. While our Coverage Universe
is a wide representation of investment opportunities in India, there are many emerging names in the
Mid Cap Universe that are not under coverage. Spotlight is an attempt to feature such mid cap stocks
by visiting such companies. We are not including these stocks under our active coverage at this point
in time. Motilal Oswal Research may or may not follow up on stocks under Spotlight.
RED: Caution
AMBER: In transition
GREEN: Interesting
1
Jinesh Gandhi
(Jinesh@MotilalOswal.com); +91 22 3982 5416
Investors are advised to refer through disclosures made at the end of the Research Report.

spotlight
| Mahindra CIE
portfolio and customers; it would be the key company for expanding into Asian markets (CIE's
target of ~33% revenue from Asia by CY17 from ~16% currently).
Margin expansion, improving asset turnover to drive EPS growth and RoE
Improving EBITDA margin and asset turnover (~3.1x by FY17E v/s 2.4x in FY15) would drive
improvement in capital efficiencies. We expect RoE/RoCE to improve 8.5pp/12.4pp to 16.5%/
15.9% by FY17. The stock trades at 18.1x FY16E EPS of INR11 and 13.6x FY17E EPS of INR15.
Valuations are attractive, considering (a) focused management with global expertise and
experience, (b) CIE group's prudent financial objectives, (c) scope to leverage CIE's products and
customers by MACA, (d) MACA playing key role for scaling up presence in Asia, and (e) sharp
improvement in MACA's financials.
Not Rated.
Comparative Valuation
Auto Comp’s
CMP *
Rev. Gr.(%)
EPS Growth (%)
RoE
P/E
(INR) FY15E FY16E FY17E FY15E FY16E FY17E FY15E FY16E FY17E FY15E FY16E FY17E
13.2
LP
17.4 49.2
16.7 25.2
17.0 10.1
19.3
9.3
5.5
-8.5
Price in EURO
50.3
39.6
27.9
36.0
27.2
47.6
33.2
28.9
22.4
18.5
30.7
19.2
13.1
22.5
26.3
14.0
26.6
14.1
14.4
25.8
27.0
16.6
27.4
17.7
16.5 27.2 18.1 13.6
26.7 31.6 22.6 17.5
26.7 26.7 20.9 17.1
17.1 27.2 20.0 16.9
28.7 34.4 27.0 20.7
18.1 19.5 13.3 11.3
Source: Bloomberg, MOSL
Mahindra CIE
207
3.5 10.7
Bharat Forge
900 13.4 21.9
Suprajit Eng.
136 22.8 22.2
Exide
184 17.8 15.5
Amara Raja
814 21.3 24.7
CIE Automotive 11.4* 26.1 19.8
NR:- Not Rated; *CIE Automotive Stock
7 January 2015
2

spotlight
| Mahindra CIE
Management change brings focus and expertise
Merger creates larger, diversified auto ancillary
Following the global alliance between Mahindra Systech and CIE Automotive (Spain),
all auto component businesses of Mahindra Systech and CIE’s forgings business in
Spain and Lithuania have been merged.
This has also resulted in a change in the management of the merged entity, with CIE
Automotive holding ~53% stake in the merged entity, Mahindra CIE (MACA). M&M
holds ~20% stake.
Unlike M&M, CIE is a focused global player in auto components (~90% of revenues),
with demonstrated ability of improving performance of inefficient companies.
Further, CIE has an objective of profitable growth, led by financial prudence. It follows
a prudent financial matrix for all its operations (independently evaluated for each
operation), targeting FCF of at least 40% of EBITDA, RoCE of >15%, and net debt-
EBITDA of <2x.
Deal structure: Creation of one unified company
All of Mahindra Systech’s component companies have been merged into
Mahindra CIE Automotive (MACA), a joint venture with Spain’s CIE Automotive.
MACA comprises of the following:
All of Mahindra Systech’s automotive components businesses, with
operations in India, UK, Italy, and Germany (FY13 revenue of ~INR40b).
CIE’s European forgings business, with operations in Spain and Lithuania
(CY12 revenue of ~INR10.5b).
CIE has ~53% stake in MACA, acquired by purchasing stakes in listed and
unlisted auto components businesses of M&M, and merging its European
forgings business.
M&M has invested in CIE Automotive (Spain), taking ~13.5% stake. It has also
retained ~20% stake in MACA.
The Mahindra-CIE Automotive alliance has been structured into three divisions:
CIE Forgings Europe (CFE):
Capacity of 110,000 tons for PVs across three
factories (two in Spain and one in Lithuania).
Mahindra-CIE Forging Europe (MFE):
Forgings capacity of 185,000 tons for
CVs across four factories in Germany and one in the UK.
Mahindra-CIE India (MCI):
PV-focused facilities, consisting of four stamping
plants, one forging plant, three gear machining units, two composite
material units, one iron smelting plant, and one magnet plant.
Further, CIE plans to consolidate its remaining forgings business in Brazil,
Mexico and China, contingent upon MACA’s gearing (net debt-EBITDA) going
below 2x.
7 January 2015
3

spotlight
| Mahindra CIE
Exhibit 1:
Exhibit 1: MACA – a “Global Forgings Powerhouse”
Source: Company, MOSL
CIE gets management control and three board seats
CIE, by virtue of majority stake in MACA, would get three board seats.
Joint pool of business leaders would be created.
The team would be led by:
Mr Hemant Luthra (Chairman)
Mr K Ramaswami (Managing Director)
Mr Pedro Echegaray (Executive Director; from CIE)
The importance of MACA for CIE Automotive can be gauged from the fact that it
has appointed its Chairman and CEO on MACA’s Board of Directors.
Exhibit 2:
Deal structure between M&M and CIE
Source: Company, MOSL
7 January 2015
4

spotlight
| Mahindra CIE
Exhibit 3: Exhibit 3: No of shares of Mahindra CIE (erstwhile Mahindra Forgings)
to be issued for
Company
MUSCO
Mahindra Composites (MCL)
Mahindra Hinoday (MHIL)
MIIPL
MGIL
PIA 3
Mahindra CIE
Swap Ratio
No. of. MFL
Shares
284
92
90
4
110
51
17
3
20
4
105
168
322
Source: Company, MOSL
Profile of three CIE appointees on MACA’s Board of Directors
Antonio María Pradera Jáuregui, Non-Executive Director
Mr Jáuregui has a University Degree in Engineering. He began his career in BBV, and
joined CIE Automotive Group in 1995. He has served as Managing Director and is
now Chairman of the Group.
Jesus Maria Herrera Barandiaran, Non-Executive Director
Mr Barandiaran has a University Degree in Economics. He is an expert in
International Business. He joined CIE Automotive in 1995 as Managing Director of
the America division, and became CEO of the CIE Automotive Group in 2013.
Pedro Echegaray, Executive Director
Mr Echegaray has over 35 years of experience in the industry and at CIE Automotive
Group, having worked in Spain, USA, Brazil, and now in India. Prior to joining
Mahindra CIE, Mr Pedro had been COO of Autometal, Managing Director of the
Forging and Machining Division of Autometal Brazil, Managing Director of Gamesa
Automotiva, COO of the Automotive Division of Gamesa Spain, and Purchasing
Manager of IBM Valencia Plant. Mr Pedro holds a Bachelor’s degree in Mechanical
Engineering from the ETSII de Bilbao and an MBA from the Universidad de Valencia.
CIE Automotive: Global player in auto components
CIE Automotive specializes in supplying components and subassemblies. It is
listed in Spain. It has presence in four continents and 15 countries, and focuses
its resources on three strategic business areas – Automotive Components,
BioFuels, and Dominion (industrial).
Despite M&A being integral part of its growth strategy, CIE has been able to
manage its gearing considerably well. It has demonstrated its ability to adapt its
business culture to different emerging markets through successful alliances with
local partners and decentralized decision-making.
7 January 2015
5

spotlight
| Mahindra CIE
Exhibit 4:
M&A has been an integral part of CIE’s strategy
Source: Company, MOSL
Exhibit 5:
Despite M&A being an integral part of its strategy, CIE has managed its balance sheet impressively…
Source: Company, MOSL
7 January 2015
6

spotlight
| Mahindra CIE
Exhibit 6:
…with demonstrated ability to improve operating performance of acquired assets
Source: Company, MOSL
CIE brings focus, expertise and clear financial objectives
Focus on global auto components:
The CIE group is focused on the auto
components business, contributing ~90% of its revenue. In case of M&M, the
auto components business was a drop in the ocean, with ~5% contribution to
consolidated revenue and no PBIT contribution.
Clear financial objectives:
CIE’s group history shows that focus on financial
performance is core to its own fundamentals. It has the following targets: EBIT
margin of >10%, FCF of at least 40% of EBITDA, RoCE of >15%, and net debt-
EBITDA of <2x for businesses across the globe.
Key differentiators of CIE’s management
Lean and decentralized management – CIE treats an acquired business as a
distinct SBU that needs to grow in its own rights.
CIE Automotive views each plant as a complete profit center responsible for
its own P&L.
Low corporate overheads:
The decentralized nature of operations has an effect
on the corporate’s overheads. At the group level, the company has less than 1%
of sales as corporate overheads.
High experience in company integration:
CIE has a successful track record of
acquisitions, which have helped drive its growth over the past decade. This
success has much to do with the company’s basic acquisition philosophy, which
differs from the approach adopted in the sector. It tries to have an operational
payback period of about three years.
7 January 2015
7

spotlight
| Mahindra CIE
Exhibit 7:
Financial strategy focused on generating FCF, controlling leverage, and improving
capital efficiencies
EBIT>=10%
Profit in all
Plants
around the
world
Focus on
Prudent
Financial
Parameters
RONA>=20
%
Net Debt <
2xEBITDA
FCF>50%
of EBITDA
Source: Company, MOSL
Exhibit 8:
CIE Automotive - Snapshot of financials
Eur M
Net Sales
Growth (%)
EBITDA Margins (%)
PAT
RoE (%)
CFO
FCF
CY07
1,278
33.3
12.3
51
19.9
171
72
CY08
1,455
13.9
12.4
52
21.3
74
-88
CY09
1,149
-21.0
10.1
15
4.5
104
19
CY10
1,694
47.4
11.8
46
8.1
94
5
CY11
1,833
8.2
13.3
88
19.7
226
123
CY12
1,646
-10.2
13.9
112
15.6
121
43
CY13
1,760
7.0
13.6
88
14.9
153
62
Source: Company, MOSL
7 January 2015
8

spotlight
| Mahindra CIE
Synergistic alliance with complementary products
Scope to leverage on individual strengths
With increasing globalization of platforms and standardization, OEMs are seeking
global suppliers with localization capabilities. This coupled with need for increasing
investment in technology is driving consolidation of suppliers.
This alliance consolidates both group’s entities into a large global component supplier,
creating a global forgings player having presence across all key markets (except Japan
and Korea).
The merging entities have complementary product portfolios and market mix. While
CFE serves the PV market in Europe, MFE serves the CV market in Europe and MCI
caters to the PV market in India. The larger product and technology portfolio
addresses the need to continuously upgrade.
MACA will benefit from a larger product portfolio and CIE’s global customers to drive
growth in India. MACA will help CIE to drive market share in Asia, resulting in balanced
market mix for CIE.
Rationale for alliance
Globally, the auto ancillary industry is consolidating, driven by (a) need for
critical mass for meeting increasingly stringent technology and financial
requirements of OEMs, and (b) OEMs seeking global suppliers with local
presence for global platforms.
This alliance consolidates both group’s entities into a large global component
supplier, creating a global forgings player. While it globalizes Mahindra Systech
beyond India and the EU, it gives CIE access to high growth markets of India.
The merging entities have complementary product portfolios and market mix.
While CFE serves the PV market in Europe, MFE serves the CV market in Europe
and MCI caters to the PV market in India. The larger product and technology
portfolio addresses the need to continuously upgrade.
Mahindra will help to drive market share in Asia and achieve balanced
geographical diversification across Asia, Europe and the Americas.
The alliance results in presence in every important global market (except Japan
and Korea), in the forged automotive parts market.
Synergies from alliance
CIE products can be introduced in India:
Products like Cross Car Beams, Window
Hashing, Common Rails, Break Boosters and Oil Pans can be leveraged upon.
Cross-selling to customers:
This alliance can support CIE customers in India, and
Mahindra customers in other markets. It gives Mahindra access to car markets
of Europe, Brazil and Mexico, while CIE gets access to Indian auto markets, along
with truck and off-road markets of Europe.
Market share gain in India:
The alliance will help MACA to gain market share in
India by expanding into CIE’s technologies and customers (Volkswagen, GM,
Renault, Ford, BMW, etc).
Other benefits:
Among the other benefits are synergies in corporate finance
(cash pooling, tax optimization, forex risk management), rationalization of
support services (Admin, Finance and HR), common operational benefits
(common operations such as procurement, design, logistics), and enhanced
ability to make investments.
7 January 2015
9

spotlight
| Mahindra CIE
Exhibit 9:
Alliance gets presence in all key markets (except Korea/Japan)
Source: Company, MOSL
Exhibit 10:
Geographic presence across markets except Japan and Korea
Source: Company, MOSL
7 January 2015
10

spotlight
| Mahindra CIE
Exhibit 11:
Synergies of the alliance
Source: Company, MOSL
Exhibit 12:
CIE’s vast product portfolio can be tapped for Indian markets
Source: Company, MOSL
7 January 2015
11

spotlight
| Mahindra CIE
Exhibit 13:
Strong global presence in forgings
Source: Company, MOSL
Exhibit 14:
CIE’s target to have meaningful contribution from Asia augurs well for MACA
Asia (incl India)
0
55
64
48
35
33
33
33
Europe
Americas
49
45
36
Mahindra CIE
48
2
Mah. Systech
CIE Parent (Pre)
16
CIE Parent (Post) CIE Parent (CY17E)
Source: Company, MOSL
7 January 2015
12

spotlight
| Mahindra CIE
Key drivers: Turnaround in MFE, growth in India
MFE seeing improvement, with EBIT margin expanding to 6.3% in 9MCY14
CIE has set out the key medium-term focus areas for MACA as (1) turning around MFE,
and (b) improving productivity and entry in CIE’s product and customer base in India.
MFE’s operating performance has begun improving, led by (a) new management team,
(b) headcount reduction, (c) price renegotiation for select parts with customers, and
(d) process improvement. In 9MCY14, MFE’s EBIT margin expanded to 6.3% (target of
~6% by CY16).
MCI (India) would be the key growth driver for MACA and CIE, as it expands its
horizons, leveraging on CIE’s product portfolio and customers; it would be the key
company for expanding into Asian markets (CIE’s target of ~33% revenue from Asia by
CY17 from ~16% currently).
European operations turning around; margin expansion evident
With the help of the CIE management’s process-driven approach, MFE aims to
improve operational performance of the European business. It is taking the
following steps:
New management team would be replacing Mahindra Systech’s team
Headcount would be reduced by ~200 to ~1,300 people
Renegotiate prices with customers on select parts; new agreement with
Daimler already in place
Operational efficiency would be optimized by improving process flow and
layout, reducing cycle times, and increasing die life
Automating processes
Outsourcing low-value-adding services
The German government scheme to subsidize high cost renewable energy (to
replace nuclear power) would reduce MFE’s energy cost by EUR4m-5m after it
passes energy audit every year.
As a result of the above measures, MFE’s EBITDA should improve to EUR30m
and EBIT margin to ~6% by CY16 (v/s -3.7% in CY13). It has already achieved EBIT
margin of ~6.3% in 9MCY14 (v/s EBIT margin of 8.9% for CIE’s European
operations).
Further, steps have been taken to refinance high cost debt with low cost debt
with support from CIE Group.
Exhibit 15:
MFE on path of turnaround with ~10.8% EBITDA margin and 6.3% EBIT margin in 9MCY14
MFE EBITDA Margins (%)
16.9
10.8
5.1
2.4
4.3
0.5
9.7
11.3
12.3
6.2
6.3
5.4
MFE EBIT Margins (%)
7.2
8.7
-1.0
-1.9
-0.4
-3.4
Source: Company, MOSL
7 January 2015
13

spotlight
| Mahindra CIE
Exhibit 16:
CIE’s Europe operations enjoy ~16% EBITDA margin and ~9% EBIT margin
CIE Region-Wise EBITDA Margins
16.7
12.6
16.1
10.8
11.9
8
CIE Region-Wise EBIT Margins
13.4
8.9
6.3
6.9
Brazil
Nafta
Europe
Mahindra
Europe
Asia (India
& China)
Brazil
Nafta
Europe
Mahindra
Europe
Asia (India
& China)
Source: Company, MOSL
Increase productivity and expand product/customer/market mix from India
CIE’s strategy for India (MCI) is based on:
Productivity improvement, led by market growth
Entry into CIE’s products and customers
Gain market share by expanding CIE multi-technology model
Introducing Aluminum, Plastic, Painting
Entry into other Asian markets (Thailand, Indonesia, Malaysia, etc)
In future, use M&A to expand
MACA is expected to play a key role in expanding CIE’s presence in Asia. CIE is
targeting 33% revenue contribution from Asia by CY17 (from ~16% based on
MACA and China), which augurs well for MACA’s growth.
Exhibit 17:
CIE products and customers can be introduced in India
Source: Company, MOSL
7 January 2015
14

spotlight
| Mahindra CIE
Exhibit 18:
Focus on gaining market share in India by expanding into all CIE technologies
Source: Company, MOSL
Exhibit 19:
CIE’s focus on Asia augurs well for MACA, as it would play key role in ramping-up in Asia
Source: Company, MOSL
Exhibit 20:
India revenue growth to be key driver
Revenue Growth India (%)
20.8%
20.3%
-0.7%
5.0%
20.0%
25.0%
Exhibit 21:
India EBITDA margin to expand
EBITDA Margins India (%)
13.5%
9.5%
6.5%
3.8%
14.8%
15.8%
-27.7%
2011
2012
2013
2014
2015E
2016E
2017E
0.8%
2010
2011
4.4%
2012
2013
2014 2015E 2016E 2017E
Source: Company, MOSL
7 January 2015
Source: Company, MOSL
15

spotlight
| Mahindra CIE
Margin expansion, improving asset turnover to
drive EPS and RoE
Expect 104% EPS CAGR over FY15-17, driven by turnaround in MFE and ramp-up in MCI
We expect consolidated revenue to grow at a CAGR of 13% over FY15-17, driven by ~26% CAGR
in MCI revenue. With EBITDA margin improvement in both MFE (+330bp over FY15-17) and MCI
(+330bp), consolidated EBITDA margin should expand 220bp to 13.8% by FY17 (v/s CIE
Automotive’s 15% EBITDA margin in CY13). We estimate EPS CAGR at 41% over FY15-17.
Improving EBITDA margin and asset turnover (~3.1x by FY17E v/s 2.4x in FY15) would drive
improvement in capital efficiencies. We expect RoE/RoCE to improve 8.5pp/12.4pp to
16.5%/15.9% by FY17.
The stock trades at 18.1x FY16E EPS of INR11 and 13.6x FY17E EPS of INR15. Valuations are
attractive, considering (a) focused management with global expertise and experience, (b) CIE
group’s prudent financial objectives, (c) scope to leverage CIE’s products and customers by
MACA, (d) MACA playing key role for scaling up presence in Asia, and (e) sharp improvement in
MACA’s financials. Not Rated.
Key challenges: Ramp-up in Asia, where Japanese players are very strong, and CIE has a weak
presence in Japan and Korea.
Exhibit 22:
Comparative Valuation
CMP * Rev. Growth (%)
Auto Comp's
Mahindra CIE
Bharat Forge
Suprajit Eng.
Exide
Amara Raja
3.5 10.7 13.2
13.4 21.9 17.4
22.8 22.2 16.7
17.8 15.5 17.0
21.3 24.7 19.3
26.1 19.8
5.5
EPS Growth (%)
RoE
P/E
2.8
6.5
6.7
3.8
8.3
2.6
P/B
2.4
5.3
5.3
3.3
6.7
2.3
EV/EBITDA
2.1 12.3
9.4
7.3
9.6
9.9
5.7
(INR) FY15E FY16E FY17E FY15E FY16E FY17E FY15E FY16E FY17E FY15E FY16E FY17E FY15E FY16E FY17E FY15E FY16E FY17E
207
900
136
184
814
LP 50.3 33.2 13.1 14.4 16.5 27.2 18.1 13.6
49.2 39.6 28.9 22.5 25.8 26.7 31.6 22.6 17.5
25.2 27.9 22.4 26.3 27.0 26.7 26.7 20.9 17.1
10.1 36.0 18.5 14.0 16.6 17.1 27.2 20.0 16.9
9.3 27.2 30.7 26.6 27.4 28.7 34.4 27.0 20.7
-8.5 47.6 19.2 14.1 17.7 18.1 19.5 13.3 11.3
4.2 16.0 12.2
2.9 16.7 12.1
2.0
7.5
6.2
4.4 16.2 13.1 10.9
5.3 19.1 15.2 11.8
Source: Company, MOSL
CIE Automotive 11.4*
Exhibit 23:
Mahindra CIE revenue contribution
Mahindra CIE Automotive (INR 52b)
Forgings (INR 32b)
Mahindra Forgings
(INR 22b)
MF India
(INR 4.2b)
MF Europe
(INR 17.9b)
Gears (INR 5b)
CIE
Metalcastello
Mahindra Hinoday
Mahindra Gears
Forgings
SpA
(INR 4.7b)
(INR 1.0b)
(INR
(INR 4b)
10.5b)
Domestic Exports
Domestic Exports
(INR 3.3b) (INR 1.4b)
(INR 0.7b) (INR 0.3b)
Castings and Magnets
(INR 4.7b)
Composites (INR 500mn)
Mahindra Composites
(INR 500m)
Domestic
(INR 460m)
Exports
(INR 40m)
Stampings (INR 7.6b)
MUSCO
(INR 7.6b)
Domestic
(INR 7.5b)
Exports
(INR 140m)
Source: Company, MOSL
7 January 2015
16

spotlight
| Mahindra CIE
Key operating and financial indicators
Exhibit 24:
Net sales continue to grow
Sales in (INR m)
41.6%
67,716
52,124
54,101
59,986
10.7%
3.5%
1.9
2014
2015E
2016E
2017E
8.7
10.5
10.3
Exhibit 25:
EBITDA and EBIT margins to expand
Growth (%)
EBITDA Margins (%)
EBIT Margins
11.7
11.7
13.2%
4.3
8.5
2014
2015E
2016E
2017E
Source: Company, MOSL
Exhibit 26:
Improvement in RoE and RoCE
ROE (%)
13.1
8.0
12.1
14.4
13.7
ROCE
16.5
15.9
Exhibit 27:
Debt-Equity ratio
1.1
Net Debt
0.9
15,706
13,648
0.7
9,836
5,047
0.6
Debt-Equity Ratio
3.5
2014
2015E
2016E
2017E
2014
2015E
2016E
2017E
Source: Company, MOSL
Exhibit 26: Fixed asset turnover to improve with utilization levels
Fixed Asset Turnover Ratio
3.1
2.7
2.4
2.7
Source: Company, MOSL
Exhibit 28:
Region-wise revenue mix
India Business
100%
75%
50%
25%
0%
Mahindra Forgings Europe
CIE Spain
2014
2015E
2016E
2017E
2014
2015E
2016E
2017E
Source: Company, MOSL
7 January 2015
17

spotlight
| Mahindra CIE
Exhibit 29:
Region-wise EBITDA mix
India Business
100%
75%
50%
25%
0%
2014
2015E
2016E
2017E
Mahindra Forgings Europe
CIE Spain
Exhibit 29: Strong operating performance drives 104%
EPS CAGR
17
13
9
5
1
-3
-7
2014
2015E
2016E
2017E
(6)
8
EPS (INR)
11
15
Source: Company, MOSL
Exhibit 30:
CFO, FCF and capex
CFO
FCF
8,534
6,792
3,563
3,563
4,292
2,500
2015E
6,034
Capex
10,243
7,743
Exhibit 31:
Business mix
Business Mix (INR b)
Stampings,
Composites 7.6
, 0.5
Gears, 5
Casting and
Magnets,
4.7
2,500
2016E
2,500
2017E
Forgings, 32
2014
Source: Company, MOSL
7 January 2015
18

spotlight
| Mahindra CIE
Financials and valuations - Consolidated
Income Statement
Y/E March
Net Sales
Change (%)
Total Expenditure
EBITDA
EBITDA Margins (%)
Change (%)
Depreciation
EBIT
EBIT Margins (%)
Interest
Other Income
Profit Before Tax
Tax rate (%)
EO Income/ (Exp)
Reported Net Profit
Adjusted Net Profit
Change (%)
2014E
52,124
49,205
2,919
5.6%
2,188
731
1.4
1,342
252
-360
-238%
2,214
999
-1,215
2015E
54,101
4%
47,841
6,260
11.6%
114%
2,338
3,922
7.2
1,536
657
3,043
19%
0
2,450
2,450
LP
2016E
59,986
11%
52,247
7,739
12.9%
24%
2,534
5,205
8.7
1,432
996
4,769
23%
0
3,684
3,684
50%
(INR Million)
2017E
67,716
13%
58,347
9,370
13.8%
21%
2,701
6,669
9.8
1,432
1,229
6,467
24%
0
4,906
4,906
33%
Balance Sheet
Y/E March
Share Capital
Total Shareholders Funds
Total Debt
Total Capital Employed
Gross Block
Capex
Less : Accumulated Depreciation
Net Block
Capital Work in Progress
Investments
Current Assets, Loans & Advances
Inventories
Sundry Debtors
Cash and Bank
Loans and Advances
Total Current Assets
Current Liabilities
Provisions
Total Current Liabilities
Net Current Assets
Net Deferred Tax Assets
Other Assets
Total Assets
2014E
1,911
13,715
16,728
32,354
41,946
25,002
22,167
445
685
6,451
5,259
1,022
1,672
14,404
9,199
238
9,452
4,952
502
756
32,354
2015E
3,217
23,681
16,668
43,566
57,336
2,500
35,074
22,262
445
3,435
6,758
5,581
3,020
1,672
17,031
9,295
238
9,548
7,482
502
756
43,566
2016E
3,217
27,365
16,668
47,250
59,836
2,500
37,608
22,228
445
3,435
7,214
6,303
6,832
1,672
22,022
10,569
238
10,822
11,200
502
756
47,250
2017E
3,217
32,271
16,668
52,156
62,336
2,500
40,309
22,028
445
3,435
7,955
7,308
11,621
1,672
28,556
11,996
238
12,249
16,306
502
756
52,156
7 January 2015
19

spotlight
| Mahindra CIE
Financials and valuations - Consolidated
Ratios
Y/E March
Basic (INR)
EPS
EPS growth (%)
Cash EPS
Book Value per Share
Valuation (x)
P/E
Cash P/E
EV/EBITDA
P/BV
Profitability Ratios (%)
RoE
RoCE
Turnover Ratios
Debtors (Days)
Inventory (Days)
Payable (Days)
Working Capital (Days)
Fixed Asset Turnover
Leverage Ratio
Net Debt/Equity (x)
Net Debt/Equity (x)
1.1
5.4
0.6
2.2
0.4
1.3
0.2
0.5
37
45
49
33
2.7
38
46
41
42
2.4
38
44
25
57
2.7
39
43
8
74
3.1
8.0
3.5
13.1
12.1
14.4
13.7
16.5
15.9
-32.6
12.4
18.7
2.9
27.2
13.9
12.3
2.8
18.1
10.7
9.4
2.4
13.6
8.8
7.3
2.1
16.7
71.8
2014E
2015E
2016E
2017E
-6.4
7.6
LP
14.9
73.6
11.5
50%
19.3
85.1
15.3
33%
23.6
100.3
7 January 2015
20

spotlight
| Mahindra CIE
NOTES
7 January 2015
21

Disclosures
This research report has been prepared by MOSt to provide information about the company(ies) and sector(s), if any, covered in the report and may be distributed by
spotlight
| Mahindra CIE
it and/or its affiliated company(ies). This
report is for personal information of the select recipient and does not construe to be any investment, legal or taxation advice to you. This research report does not constitute an offer, invitation or inducement to
invest in securities or other investments and Motilal Oswal Securities Limited (hereinafter referred as MOSt) is not soliciting any action based upon it. This report is not for public distribution and has been
furnished to you solely for your general information and should not be reproduced or redistributed to any other person in any form. This report does not constitute a personal recommendation or take into
account the particular investment objectives, financial situations, or needs of individual clients. Before acting on any advice or recommendation in this material, investors should consider whether it is suitable
for their particular circumstances and, if necessary, seek professional advice. The price and value of the investments referred to in this material and the income from them may go down as well as up, and
investors may realize losses on any investments. Past performance is not a guide for future performance, future returns are not guaranteed and a loss of original capital may occur.
We are under the process of seeking registration under SEBI (Research Analyst) Regulations, 2014. There are no disciplinary action that have been taken by any regulatory authority impacting equity
research analysis activities.
MOSt and its affiliates are a full-service, integrated investment banking, investment management, brokerage and financing group. We and our affiliates have investment banking and other business
relationships with a significant percentage of the companies covered by our Research Department Our research professionals provide important input into our investment banking and other business selection
processes. Investors should assume that MOSt and/or its affiliates are seeking or will seek investment banking or other business from the company or companies that are the subject of this material and that
the research professionals who were involved in preparing this material may participate in the solicitation of such business. The research professionals responsible for the preparation of this document may
interact with trading desk personnel, sales personnel and other parties for the purpose of gathering, applying and interpreting market information. Our research professionals are paid in part based on the
profitability of MOSt which include earnings from investment banking and other business. MOSt generally prohibits its analysts, persons reporting to analysts, and members of their households from
maintaining a financial interest in the securities or derivatives of any companies that the analysts cover. Additionally, MOSt generally prohibits its analysts and persons reporting to analysts from serving as an
officer, director, or advisory board member of any companies that the analysts cover. Our salespeople, traders, and other professionals or affiliates may provide oral or written market commentary or trading
strategies to our clients that reflect opinions that are contrary to the opinions expressed herein, and our proprietary trading and investing businesses may make investment decisions that are inconsistent with
the recommendations expressed herein. In reviewing these materials, you should be aware that any or all o the foregoing, among other things, may give rise to real or potential conflicts of interest . MOSt and
its affiliated company(ies), their directors and employees may; (a) from time to time, have a long or short position in, and buy or sell the securities of the company(ies) mentioned herein or (b) be engaged in
any other transaction involving such securities and earn brokerage or other compensation or act as a market maker in the financial instruments of the company(ies) discussed herein or act as an advisor or
lender/borrower to such company(ies) or may have any other potential conflict of interests with respect to any recommendation and other related information and opinions.
Unauthorized disclosure, use, dissemination or copying (either whole or partial) of this information, is prohibited. The person accessing this information specifically agrees to exempt MOSt or any of its
affiliates or employees from, any and all responsibility/liability arising from such misuse and agrees not to hold MOSt or any of its affiliates or employees responsible for any such misuse and further agrees to
hold MOSt or any of its affiliates or employees free and harmless from all losses, costs, damages, expenses that may be suffered by the person accessing this information due to any errors and delays. The
information contained herein is based on publicly available data or other sources believed to be reliable. Any statements contained in this report attributed to a third party represent MOSt’s interpretation of the
data, information and/or opinions provided by that third party either publicly or through a subscription service, and such use and interpretation have not been reviewed by the third party. This Report is not
intended to be a complete statement or summary of the securities, markets or developments referred to in the document. While we would endeavor to update the information herein on reasonable basis, MOSt
and/or its affiliates are under no obligation to update the information. Also there may be regulatory, compliance, or other reasons that may prevent MOSt and/or its affiliates from doing so. MOSt or any of its
affiliates or employees shall not be in any way responsible and liable for any loss or damage that may arise to any person from any inadvertent error in the information contained in this report. MOSt or any of
its affiliates or employees do not provide, at any time, any express or implied warranty of any kind, regarding any matter pertaining to this report, including without limitation the implied warranties of
merchantability, fitness for a particular purpose, and non-infringement. The recipients of this report should rely on their own investigations.
Recipients who are not institutional investors should seek advice of their independent financial advisor prior to taking any investment decision based on this report or for any necessary explanation of its
contents.
MOSt and/or its affiliates and/or employees may have interests/positions, financial or otherwise in the securities mentioned in this report. To enhance transparency, MOSt has incorporated a Disclosure of
Interest Statement in this document. This should, however, not be treated as endorsement of the views expressed in the report.
Disclosure of Interest Statement
Analyst ownership of the stock
MAHINDRA CIE
No
Analyst Certification
The views expressed in this research report accurately reflect the personal views of the analyst(s) about the subject securities or issues, and no part of the compensation of the research analyst(s) was, is, or
will be directly or indirectly related to the specific recommendations and views expressed by research analyst(s) in this report. The research analysts, strategists, or research associates principally responsible
for preparation of MOSt research receive compensation based upon various factors, including quality of research, investor client feedback, stock picking, competitive factors and firm revenues.
Regional Disclosures (outside India)
For U.K.
This report is not directed or intended for distribution to or use by any person or entity resident in a state, country or any jurisdiction, where such distribution, publication, availability or use would be contrary to
law, regulation or which would subject MOSt & its group companies to registration or licensing requirements within such jurisdictions.
This report is intended for distribution only to persons having professional experience in matters relating to investments as described in Article 19 of the Financial Services and Markets Act 2000 (Financial
Promotion) Order 2005 (referred to as "investment professionals"). This document must not be acted on or relied on by persons who are not investment professionals. Any investment or investment activity to
which this document relates is only available to investment professionals and will be engaged in only with such persons.
Motilal Oswal Securities Limited (MOSL) is not a registered broker - dealer under the U.S. Securities Exchange Act of 1934, as amended (the"1934 act") and under applicable state laws in the United States.
In addition MOSL is not a registered investment adviser under the U.S. Investment Advisers Act of 1940, as amended (the "Advisers Act" and together with the 1934 Act, the "Acts), and under applicable state
laws in the United States. Accordingly, in the absence of specific exemption under the Acts, any brokerage and investment services provided by MOSL, including the products and services described herein
are not available to or intended for U.S. persons.
This report is intended for distribution only to "Major Institutional Investors" as defined by Rule 15a-6(b)(4) of the Exchange Act and interpretations thereof by SEC (henceforth referred to as "major institutional
investors"). This document must not be acted on or relied on by persons who are not major institutional investors. Any investment or investment activity to which this document relates is only available to major
institutional investors and will be engaged in only with major institutional investors. In reliance on the exemption from registration provided by Rule 15a-6 of the U.S. Securities Exchange Act of 1934, as
amended (the "Exchange Act") and interpretations thereof by the U.S. Securities and Exchange Commission ("SEC") in order to conduct business with Institutional Investors based in the U.S., MOSL has
entered into a chaperoning agreement with a U.S. registered broker-dealer, Motilal Oswal Securities International Private Limited. ("MOSIPL"). Any business interaction pursuant to this report will have to be
executed within the provisions of this chaperoning agreement.
The Research Analysts contributing to the report may not be registered /qualified as research analyst with FINRA. Such research analyst may not be associated persons of the U.S. registered broker-dealer,
MOSIPL, and therefore, may not be subject to NASD rule 2711 and NYSE Rule 472 restrictions on communication with a subject company, public appearances and trading securities held by a research
analyst account.
Motilal Oswal Capital Markets Singapore Pte Limited is acting as an exempt financial advisor under section 23(1)(f) of the Financial Advisers Act(FAA) read with regulation 17(1)(d) of the Financial Advisors
Regulations and is a subsidiary of Motilal Oswal Securities Limited in India. This research is distributed in Singapore by Motilal Oswal Capital Markets Singapore Pte Limited and it is only directed in Singapore
to accredited investors, as defined in the Financial Advisers Regulations and the Securities and Futures Act (Chapter 289), as amended from time to time.
In respect of any matter arising from or in connection with the research you could contact the following representatives of Motilal Oswal Capital Markets Singapore Pte Limited:
Anosh Koppikar
Kadambari Balachandran
Email : anosh.Koppikar@motilaloswal.com
Email : kadambari.balachandran@motilaloswal.com
Contact : (+65)68189232
Contact : (+65) 68189233 / 65249115
Office Address : 21 (Suite 31),16 Collyer Quay,Singapore 04931
For U.S.
For Singapore
Motilal Oswal Securities Ltd
7 January 2015
Motilal Oswal Tower, Level 9, Sayani Road, Prabhadevi, Mumbai 400 025
Phone: +91 22 3982 5500 E-mail: reports@motilaloswal.com
22