15 January 2015
3QFY15 Results Update | Sector:
Technology
TCS
BSE SENSEX
28,076
Bloomberg
Equity Shares (m)
S&P CNX
8,494
TCS IN
1,958.7
CMP: INR2,545
TP: INR2,650 (+4%)
Disappointing growth in Services revenue
n
Neutral
M.Cap (INR b)/(USD b) 5,288/86.2
52-Week Range (INR) 2,834/1,970
1, 6, 12 Rel. Per (%)
Avg Val/Vol ‘000
Free float (%)
Financials & Valuation (INR b)
Y/E March
Sales
EBITDA
PAT
EPS (INR)
EPS Gr. (%)
BV/Sh.INR)
RoE (%)
P/E (x)
Div.Yld (%)
2015E 2016E 2017E
953 1,089 1,248
274
212
11.1
333
35.2
23.5
1.6
309
246
16.0
407
34.0
20.2
15.1
1.7
359
288
17.0
493
32.7
17.3
12.7
2.0
n
n
n
5/-5/-24
2,998/1,279
26.1
108.4 125.8 147.2
EV/EBITDA(x) 17.3
Estimate change
TP change
Rating change
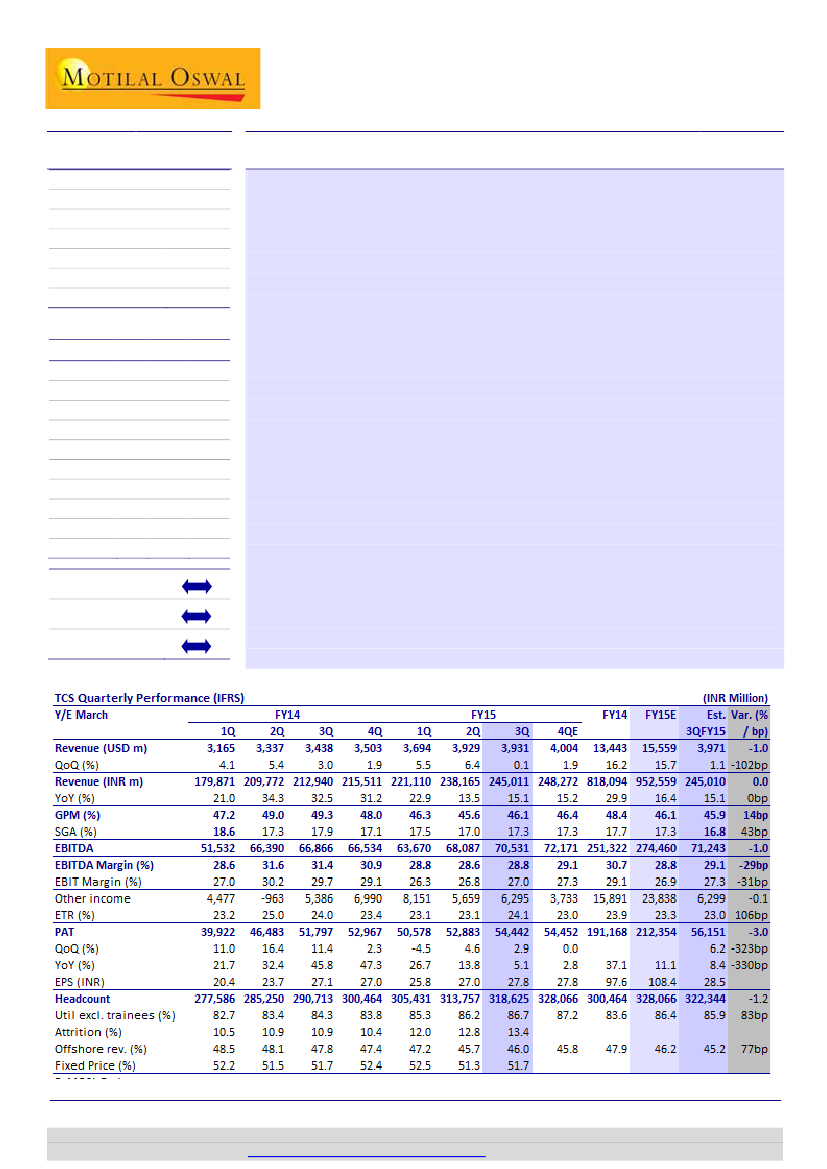
Disappointing services growth:
TCS’ 3QFY15 constant currency (CC) revenue
growth was 2.5% QoQ (v/s est. of 3.1%), but excluding the sale of equipment
(2.3% of business) services, CC revenue growth was 1.6% QoQ, below our
estimate. Volume growth of 0.4% QoQ is a 23-quarter low. EBIT margin was in
line at 27% (+20bp QoQ). PAT grew 2.9% QoQ to INR54.4b, below our estimate of
INR56.1b, on a tax rate of 24% v/s estimate of 23% and lower absolute operating
profit.
Contrasting trends across TCS and INFO:
The trend of volume-pricing split across
TCS and INFO contrasted in 3QFY15 – INFO’s CC realization declined 1.6% QoQ
and TCS’ rose by 2.3%. TCS’ volume growth was 0.4%, against INFO’s 4.2% QoQ.
Positive read through for industry:
TCS’ comments of larger structured programs
around Digital, likely recovery in Retail and positive growth outlook in the US and
Europe are positive. However, cost structure transformation initiatives in BFSI on
the back of multiple fines could lead to elongated deal cycles.
Valuation and view:
We have lowered the FY16E/17E revenue and EPS estimates
by ~3% mainly due to cross currency MTM. We note a catch-up in INFO’s
performance to TCS’ for the second consecutive quarter and continue to expect a
gradual convergence in the valuation gap. TCS’ growth will continue to lead peers
in the near term, but we expect continued tapering of outperformance delta. Our
target price of INR2,650 discounts FY17E EPS by 18x, in line with the long term
average. Higher multiple will be a function of sustained high growth delta to
peers, though there are few indicators of the same. Maintain
Neutral.
Ashish Chopra
(Ashish.Chopra@MotilalOswal.com); +91 22 3982 5424
Siddharth Vora
(Siddharth.Vora@MotilalOswal.com); +91 22 3982 5585
Investors are advised to refer through disclosures made at the end of the Research Report.
Motilal Oswal research is available on
www.motilaloswal.com/Institutional-Equities,
Bloomberg, Thomson Reuters, Factset and S&P Capital.

TCS
Constant currency Services revenue growth disappoints
n
n
n
TCS’ 3QFY15 revenue was flat QoQ to USD3,931m, below our estimate of
USD3,971m. In constant currency, revenues grew 2.5% QoQ, v/s our est. of 3.1%
QoQ.
Excluding sale of equipment (2.3% of business) services CC revenue growth was
1.6% QoQ, below our estimate of 3.2% QoQ.
Revenue growth was led by strong realization growth of 2.3% QoQ but volume
growth was a low 0.4% QoQ largely due to lower number of working days
caused by holiday season and furloughs across retail, telecom, hi-tech and BFSI
vertical. In rupee terms, revenues were INR245b, +2.9% QoQ, in line with our
estimate due to higher rupee realized rate of INR62.33 v/s estimate of INR61.7.
Exhibit 1:
Adjusted for equipment sales, revenue growth was below estimate
USD Revenues
2.4%
2.4%
3.0%
4.6%
3.3%
3.1%
4.1%
QoQ Growth (%)
5.4%
3.0%
5.5%
1.9%
6.4%
0.1%
2,586 2,648 2,728 2,853 2,948 3,040 3,165 3,337 3,438 3,503 3,694 3,929 3,931
Source: Company, MOSL
Exhibit 2:
Breakup of revenue growth
3QFY15: USD revenue growth impacts
Volume
Realization decline
Cross currency movements
Offshore revenue shift
QoQ revenue growth (%)
Percentage
0.4
2.3
-2.4
-0.2
0.1
Source: Company, MOSL
n
Growth during the quarter was broad based and impacted by cross currency
movements. Among verticals Retail, Insurance and Energy & Utilities were weak.
Outlook remains weak for Energy & Utilities and Insurance in the coming
quarters as well, while Retail should recover. Among geographies, decline in
Europe and APAC was driven by cross currency movements; DIligenta (insurance
platform acquired by TCS) drove weakness in UK. Among services, ADM, EAS and
Engg Services declined due to loss of volumes from furloughs and holiday
season.
15 January 2014
2

TCS
Exhibit 3:
Retail, Energy & Utilities and Telecom were a drag on overall growth
Verticals
BFSI
Mfg
Telecom
LS & Healthcare
Retail & Distr
Transportation
Energy and Utilities
Media & Entmnt
Hi-Tech
Others
Contr. to
overall rev (%)
40.5
10.1
8.9
6.4
13.4
3.5
4.2
2.7
5.9
4.4
QoQ
Gr. (%)
4 Quarter
CQGR
0.3
2.0
0.1
7.0
0.1
1.5
1.6
5.5
(0.7)
2.6
0.1
3.4
(2.3)
6.0
0.1
7.6
3.6
6.2
(4.3)
4.0
Source: Company, MOSL
Exhibit 4:
Decline in Europe and APAC was driven by cross currency impact, CC growth was
positve
Geographies
North America
Latin America
UK
Continental Europe
India
APAC
MEA
Contr. to
overall rev (%)
51.9
2.1
16.1
11.7
6.5
9.7
2.0
QoQ
Gr. (%)
4 Quarter
CQGR
1.8
3.0
10.6
1.1
(5.8)
1.3
1.8
3.6
0.1
4.2
(3.9)
10.6
5.3
1.0
Source: Company, MOSL
Exhibit 5:
ADM, Engineering Services and EAS declined due to furloughs and holidays
Services
ADM
Engg Services
IMS
EAS
Consulting
Products
Testing
BPO
Contr. to
overall rev (%)
39.5
4.5
14.3
15.4
3.7
2.4
8.5
11.7
QoQ
Gr. (%)
4 Quarter
CQGR
(2.4)
2.2
(2.1)
2.8
3.7
8.0
(1.2)
2.9
15.7
5.6
4.4
4.5
1.2
3.4
0.9
2.5
Source: Company, MOSL
Margins in line, PAT marginally below estimate
n
EBITDA margin expanded 20bp QoQ 28.8%, in line with our estimate 29.1% -
contributed by: [1] 50bp from currency movements (seen in gross margins) and
[2] -30bp from higher SGA.
15 January 2014
3

TCS
Exhibit 6:
Slight improvement in EBIT margin on the back of currency
SGA (% of Revenues)
26.2 27.1
29.2
27.7 27.5 26.8 27.3
26.5 27.0
EBIT Margin (%)
30.2 29.7 29.1
26.3 26.8 27.0
19.4 18.6
17.5 17.5 17.1 18.3 18.1 18.0 18.4
17.3 17.9 17.1 17.5 17.0 17.3
Source: Company, MOSL
Exhibit 7:
Utilization made a historical peak for the second consecutive quarter
Utilization Excl. Trainees (%)
82.0
74.0
80.6
71.3
81.3
72.3
81.6
72.8
81.7
72.1
82.0
72.2
82.7
Utilization Incl. Trainees (%)
86.2
84.3 83.8 85.3
83.4
81.3
79.8
77.5 77.9
75.0
86.7
82.1
72.5
Source: Company, MOSL
n
EBIT margin was 27%, in line with our estimate of 27.3%. PAT grew 2.9% QoQ to
INR54.4b, below est. of INR56.1b, on tax rate of 24% v/s est. of 23% and lower
absolute operating profit.
Contrasting construction of CC revenue growth at TCS and INFO
n
Trend of volume-pricing split across TCS and INFO contrasted in 3QFY15. – With
the former’s CC per capita productivity down 1.6% QOQ, and that at TCS up
2.3%. TCS’ volume growth of 0.4% QoQ compares with INFO’s 4.2% QoQ.
Exhibit 8:
Contrasting construction of CC revenue growth
Volume growth (%)
CC Pricing (%)
4.2
2.3
0.4
TCS
INFOSYS
-1.6
Source: Company, MOSL
15 January 2014
4

TCS
n
Pricing uptick at TCS is a function of 3Q seasonality, substantiated by similar
movements in the third quarter of previous years as well.
Exhibit 9:
Uptick in 3Q realization in line with historical trends
TCS CC pricing QoQ(%)
2.0
-0.5
-1.0
-1.0
-1.0
-0.5
1.3
0.0
-1.6
-0.9
0.7
-0.8
-1.1
-1.5
2.3
Source: Company, MOSL
n
n
This is the first time in eight quarters when INFO’s sequential constant currency
revenue growth (2.6% QoQ) shaded that of TCS (1.6% QoQ in Services and 2.5%
including equipment sales).
For the second consecutive quarter, TCS’ YoY EBITDA growth lagged that at
INFO. While TCS’ EBITDA growth stands at 5.5% YoY, growth at INFO was 9.2%.
In 2QFY15, INFO’s YoY EBITDA growth of 11.4% compared with 2.6% at TCS.
Exhibit 10:
YoY EBITDA growth at INFO edged TCS for the first time in 2QFY15 since FY09,
sustained in 3Q
Difference in YoY EBITDA growth between INFO and TCS
5.0
-15.0
-35.0
Source: Company, MOSL
Takeaways from Management commentary
n
Positive read through for the industry:
US is in a strong position this year v/s
last year. Trend in Digital is significantly positive. Latin America and India – two
segments which were weak in recent quarters, are looking up from here. Japan
did well in the last quarter, and the company expects to make the strong client
base count going forward. TCS is not witnessing any account-specific headwinds.
Diligenta declined last two quarters and that could continue for another 2-3
quarters.
n
Geared to benefit from the huge opportunity:
The technology business is at the
cusp of tremendous opportunity. Rate of change in technology is very fast, and
as a result of this, customers need partnerships. TCS’ scale and partnerships
with clients and investments in skills will help benefit from the trend. Customers
15 January 2014
5

TCS
n
n
n
n
are moving on from merely pilot engagements and the programs are coming
together. With many customers, TCS is citing an opportunity to become a
partner of choice in the long journey.
BFSI:
Client spending on fines will result in lot of transformative opportunities.
Cost structure could move towards simplification, cloudification. However, as a
result of the same, the decision cycles may be elongated.
Retail:
All retailers are committed to going Digital. It a big bet for them to
compete with online players. The growth in the segment should improve going
forward.
Captives:
All large customers have some form of captive. They have a very
specific purpose. It is a case co-existence and not a threat to growth for Indian IT
players
Hiring:
35000 campus offers are planned for FY16. TCS has already visited 417
campuses and made 32000 offers. Remaining 3000 will be completed by
February. There has been no change to entry level salaries.
Estimates cut by ~3%, majorly on the back of currency MTM
n
n
n
We have cut our FY16/17 USD revenue and earnings estimates by ~3%, majorly
on the back of factoring cross currency impact in 3QFY15 (250bp v/s estimate of
200bp) and further ~200bp residual impact in FY16. The impact is more severe
at TCS compared to peers like INFO due to higher exposure to Japanese Yen,
after the merger with Mitsubishi’s ITF.
Our USD revenue growth estimate of 12.8% in FY16 is constituted as follows: [1]
CC organic growth: +14%, [2] Residual impact from merger with ITF: +0.8%, [2]
Impact from movements in cross currencies: -2%.
Our EBIT margins are unchanged, and we expect the company to operate in its
targeted band of 26-28%. Consequently, our EPS estimates for FY16/17 are
lower by 3.2%/2.7% to INR125.8/147.2.
Exhibit 11:
Change in estimates
Revised
FY15E FY16E FY17E FY15E
INR/USD
61.2
62.0
62.0 61.1
USD Revenue - m
15,559 17,557 20,132 15,706
USD revenue growth (%) 15.8
12.8
14.7 16.8
EBIT Margin (%)
26.9
26.8
27.3 27.1
EPS - INR
108.4 125.8 147.2 110.8
Earlier
Change
FY16E FY17E FY15E FY16E FY17E
62.0
62.0
0.2%
0.0%
0.0%
18,083 20,768
-0.9%
-2.9% -3.1%
15.1
14.8
-109bp -230bp -18bp
27.2
27.3
-22bp
-47bp
-3bp
129.9 151.3
-2.2%
-3.2% -2.7%
Source: Company, MOSL
15 January 2014
6

TCS
Valuation and view
n
n
n
n
n
Over the past four years, TCS has led the incremental revenues as well as
operating profits not just domestically, but also in the global arena (compared to
peers multiple times its size); and its market cap is second only to IBM.
During the period of outperformance, TCS’ traction has been impressively
broad-based, unlike select pockets of stress across its peer group. However,
over the past couple of quarters, some factors that have led relative softness in
performance v/s the company’s expectations have had secular elements,
considering citations of similar trends by peers as well (Retail, Insurance,
Energy). We see likelihood of growth converging gradually for the company,
though it may continue to lead by a lesser margin.
Also, having started the year with expectation of growth acceleration, organic
constant currency growth will fall short (at 14.6%). This explains lacking visibility
in the budget spend trajectory of the client. BFSI (40.5% of company’s revenues)
may see elongated decision cycles in FY16, given the fines being imposed on
large banks under multiple pretexts. This could cast a shadow on the growth
outlook next year.
Despite that, we expect growth at TCS to remain healthy, given its strides in
Digital capabilities, anticipated recovery in Retail, opportunity in Japan and
uptick in India and Latin America.
We expect TCS to grow its USD revenues at a CAGR of 13.7% over FY15-17E and
EPS at a CAGR of 16.5% during this period. TCS currently trades at 20x FY16E and
17x FY17E EPS. Our target price of INR2,650 discounts FY17E EPS by 18x, which
is the company’s long term average. Higher multiple will be a function of
sustained high growth delta to peers, but there are little indicators of the same
for the near-to-medium term. Maintain
Neutral.
Key triggers
n
n
n
Positive momentum in BFSI client spending.
Uptick in Japan revenues.
Digital-led resurgence in growth leadership.
Key risk factors
n
n
n
Faster convergence of growth to peers.
Rapid appreciation in INR.
Pricing intensity in troubled European region.
15 January 2014
7

TCS
Exhibit 1: TCS 1 year forward PE chart
30
24
18
12
6
7.0
18.2
PE (x)
Median(x)
Peak(x)
Min(x)
18.8
19.7
Avg(x)
25.8
Exhibit 2: TCS 1-year forward PB chart
11.5
9.5
7.5
5.5
3.5
1.5
6.3
6.0
2.3
PB (x)
Median(x)
Peak(x)
Min(x)
Avg(x)
10.5
6.2
Exhibit 12:
Comparative Valuation
Company Mkt cap Rating
(USD b)
TCS
80.6 Neutral
Infosys
39.4 Buy
Wipro
22.3 Neutral
HCL Tech
18.2 Buy
TechM
10.5 Buy
Cognizant
33.2 Not Rated
Tier-I Agg
204.3
TP Upside
EPS (INR)
(INR)
(%) FY15E FY16E
2,650 4.1 108.4 125.8
2,500 17.2 108.7 120.1
625
11.7 34.5
39.3
2,000 25.4 105.5 114.3
3,100 11.5 136.4 170.2
2.3
2.8
FY17E
147.2
137.8
44.6
127.8
200.2
3.3
P/E (x)
RoE (%)
FY15E FY16E FY17E FY15E FY16E
23.5
20.2
17.3
35.2
34.0
19.6
17.8
15.5
26.2
24.8
16.2
14.2
12.5
23.1
22.6
15.1
14.0
12.5
32.7
29.4
20.4
16.3
13.9
28.5
28.0
23.3
19.6
16.3
20.6
19.8
19.7
17.0
14.7
27.7
26.4
FY17E
32.7
24.6
21.9
26.6
26.6
19.6
25.3
Source: Company, MOSL
FY14-17E CAGR (%)
USD rev.
EPS
14.4
14.7
10.4
13.9
10.6
12.1
13.4
12.3
20.3
18.3
17.3
18.4
15 January 2014
8

TCS
Story in charts
Exhibit 13:
TCS continues to lead industry growth..
TCS
Infosys
Wipro (IT Services)
HCL Tech
Exhibit 14:
… India growth back in FY15, outlook positive
India (INR)
International (USD)
11.1
5.5
6.2
5.9
3.7
2.0
-0.4
-7.3
1QFY14 2QFY14 3QFY14 4QFY14 1QFY15 2QFY15 3QFY15
Source: Company, MOSL
-5.5
5.3
4.2
6.1
2.9
0.1
FY11
FY12
FY13
FY14
FY15E
Source: Company, MOSL
Exhibit 15:
Revenue growth finally getting delinked to
headcount..
Headcount
150
140
130
120
110
100
USD revenues
Exhibit 16:
..as competitive intensity gradually pulls down
pricing
Picing indexed at 100
102
100
98
96
94
Source: Company, MOSL
Exhibit 17:
Operating at peak efficiency, reflected in
utilization…
Utilization Excl. Trainees (%)
Utilization Incl. Trainees (%)
Exhibit 18:
..Expect margins to settle lower and EPS to lag
rev. growth
SGA (% of Revenues)
EBIT Margin (%)
30.2 29.7
29.1
27.5 26.8 27.3 26.5 27.0
26.3 26.8 27.0
19.4 18.6
18.1 18.0 18.4
17.3 17.9 17.1 17.5 17.0 17.3
88
84
80
76
72
68
Source: Company, MOSL
15 January 2014
9

TCS
Exhibit 19:
Operating metrics
1QFY13 2QFY13 3QFY13 4QFY13 1QFY14 2QFY14 3QFY14 4QFY14 1QFY15 2QFY15 3QFY15
Service lines (%)
ADM
Engineering and Industrial Services
Infrastructure Services
Enterprise Solutions
Global Consulting
Asset Leverage Solutions
Assurance Services
BPO
Industry verticals (%)
BFSI
Manufacturing
Telecom
Life Sciences & Healthcare
Retail & Distribution
Transportation
Energy and Utilities
Media & Entertainment
Hi-Tech
Others
Geographies (%)
America
UK
Rest of Europe
Europe
India
APAC
Latin America
MEA
Others
Revenue mix (%)
Offshore
Onsite
GDC
Utilization (%)
Excluding Trainees
Including Trainees
Total Employees
Trainee Additions
Lateral Additions
Overseas Additions
Gross Additions
Net Additions
Attrition (LTM %)
43.4
4.6
10.6
15.2
2.8
2.8
7.6
13.0
43.1
4.6
11.4
14.9
3.0
2.7
7.7
12.6
42.4
4.7
11.7
15.1
3.2
2.8
7.7
12.4
42.4
4.6
12.1
15.5
3.1
2.5
7.8
12.0
42.3
4.7
11.9
15.1
3.5
2.5
8.1
11.9
41.7
4.7
11.8
15.4
3.3
2.7
8.5
11.9
41.4
4.6
12.0
15.7
3.4
2.3
8.5
12.1
41.0
4.8
12.0
15.7
3.4
2.6
8.4
12.1
40.8
4.5
12.6
15.9
3.2
2.5
8.6
11.9
40.5
4.6
13.8
15.6
3.2
2.3
8.4
11.6
39.5
4.5
14.3
15.4
3.7
2.4
8.5
11.7
43.0
7.9
10.3
5.3
13.2
3.7
3.6
2.2
6.0
4.8
42.8
8.2
10.3
5.2
13.4
3.6
3.6
2.2
5.9
4.8
43.0
8.5
9.5
5.2
13.4
3.6
3.8
2.1
5.8
5.1
43.5
8.5
9.3
5.1
13.4
3.4
3.8
2.1
5.7
5.2
43.0
8.4
9.6
5.5
14.0
3.4
3.7
2.1
5.5
4.8
43.1
8.4
9.3
5.7
13.9
3.4
3.8
2.2
5.4
4.8
42.7
8.8
9.6
5.9
13.8
3.5
3.8
2.3
5.3
4.3
42.9
8.6
9.3
6.1
13.5
3.5
3.8
2.6
5.3
4.4
41.7
8.6
9.4
6.3
13.8
3.6
3.9
2.7
5.5
4.5
40.4
10.1
8.9
6.3
13.5
3.5
4.3
2.7
5.7
4.6
40.5
10.1
8.9
6.4
13.4
3.5
4.2
2.7
5.9
4.4
53.5
17.0
9.6
26.6
7.1
7.4
3.3
2.1
19.9
52.8
17.1
9.5
26.6
7.5
7.6
3.4
2.1
20.6
52.6
17.5
9.1
26.6
7.6
7.5
3.6
2.1
20.8
53.2
16.8
9.4
26.2
8.8
7.3
2.4
2.1
20.6
54.1
17.0
9.9
26.9
7.6
6.9
2.4
2.1
19.0
53.2
17.3
11.2
28.5
6.9
7.1
2.3
2.0
18.3
52.7
17.5
11.6
29.1
6.3
7.4
2.3
2.2
18.2
52.2
17.8
12.1
29.9
6.2
7.4
2.2
2.1
17.9
52.2
17.7
12.0
29.7
6.3
7.6
2.2
2.0
18.1
51.0
17.1
11.5
28.6
6.5
10.1
1.9
1.9
20.4
51.9
16.1
11.7
27.8
6.5
9.7
2.1
2.0
20.3
50.5
44.7
4.8
49.1
45.8
5.1
49.4
45.6
5.0
48.3
46.5
5.2
48.5
46.3
5.2
48.1
46.5
5.4
47.8
46.8
5.4
47.4
47.0
5.6
47.2
47.1
5.7
45.7
48.9
5.4
46.0
48.2
5.8
81.3
72.3
81.6
72.8
81.7
72.1
82.0
72.2
82.7
72.5
83.4
75.0
84.3
77.5
83.8
77.9
85.3
79.8
86.2
81.3
86.7
82.1
243,545 254,076 263,637 276,196 277,586 285,250 290,713 300,464 305,431 313,757 318,625
4,313 10,205
9,831 11,420
751
6,296
6,342
7,572
3,452
7,583
5,529
7,041
5,764
5,072
5,630
6,605
6,423
5,490
7,401
8,488
8,924
6,129
2,477
2,685
2,242
3,048
3,255
4,643
2,831
3,591
3,877
3,843
4,903
13,831 18,654 17,145 20,098 10,611 17,362 14,663 18,564 15,817 20,350 16,561
4,962 10,531
9,561 12,559
1,390
7,664
5,463
9,751
4,967
8,326
4,868
12.0
11.4
11.2
10.6
10.5
10.9
10.9
10.4
12.0
12.8
13.4
Source: Company, MOSL
15 January 2014
10

TCS
Exhibit 20:
Operating metrics
QoQ growth (%)
1QFY13 2QFY13 3QFY13 4QFY13 1QFY14 2QFY14 3QFY14 4QFY14 1QFY15 2QFY15 3QFY15
Service Lines
ADM
0.7
3.8
1.7
3.1
3.9
3.9
2.3
0.9
4.9
5.6
-2.4
Engineering and Industrial Services
3.0
4.6
5.6
0.9
6.4
5.4
0.8
6.3
-1.1
8.7
-2.1
Infrastructure Services
5.0
12.5
6.1
6.7
2.4
4.6
4.8
1.9
10.7
16.5
3.7
Enterprise Solutions
3.0
2.5
4.7
5.9
1.4
7.5
5.0
1.9
6.8
4.3
-1.2
Global Consulting
6.8
12.0
10.2
-0.1
17.5
-0.6
6.1
1.9
-0.7
6.4
15.7
Asset Leverage Solutions
-26.0
0.8
7.2
-7.9
4.1
13.9
-12.2
15.2
1.4
-2.2
4.4
Assurance Services
7.3
5.9
3.3
4.5
8.1
10.7
3.0
0.7
8.0
3.9
1.2
BPO
16.5
1.3
1.7
-0.2
3.2
5.4
4.8
1.9
3.7
3.7
0.9
Industry Verticals
BFSI
Manufacturing
Telecom
Life Sciences & Healthcare
Retail & Distribution
Transportation
Energy and Utilities
Media & Entertainment
Hi-Tech
Others
Geographies
America
UK
Rest of Europe
Europe
India
APAC
Latin America
MEA
Others
Offshore
Onsite
GDC
Overall International business
Domestic Business
5.0
3.0
6.1
3.0
8.8
3.0
-2.4
3.0
3.0
-22.7
4.1
8.5
4.6
2.6
6.2
1.7
4.6
4.6
2.8
4.6
3.8
7.1
-4.7
3.3
3.3
3.3
9.1
-1.4
1.6
9.8
4.3
3.1
1.0
1.1
3.1
-2.6
3.1
3.1
1.3
5.1
2.9
2.9
7.5
12.3
8.8
4.1
1.4
4.1
0.4
-3.9
5.7
5.4
2.1
9.3
4.7
5.4
8.3
10.5
3.5
5.4
2.1
7.9
6.4
6.6
2.3
6.1
3.0
7.7
1.1
-7.7
2.4
-0.4
-1.3
5.3
-0.3
1.9
1.9
15.2
1.9
4.3
2.5
5.5
6.6
8.9
7.8
8.5
8.2
9.5
9.4
7.9
3.0
24.9
0.7
6.4
4.0
3.4
17.3
6.4
10.2
8.7
0.3
0.1
0.1
1.6
-0.7
0.1
-2.3
0.1
3.6
-4.3
2.8
15.2
0.9
9.6
-13.9
-1.0
9.7
3.0
-4.2
5.0
3.4
11.6
4.6
-13.9
3.2
5.2
3.5
4.6
10.5
7.4
7.7
4.6
8.2
1.2
6.7
10.6
4.1
10.5
2.9
5.8
-1.0
3.3
4.7
2.0
9.4
3.3
4.3
3.9
2.8
1.2
3.2
4.6
4.3
-1.0
6.5
1.6
19.4
0.4
-31.2
3.1
2.1
-0.5
3.8
5.8
1.8
19.6
5.9
5.3
9.6
6.9
-10.1
-1.6
4.1
4.1
-4.0
5.9
5.0
5.5
5.5
-10.1
3.7
7.3
19.3
11.7
-4.3
8.5
1.1
0.4
1.6
5.4
6.7
10.3
6.3
-4.4
2.1
4.2
6.7
5.2
-5.9
7.4
3.0
13.3
2.5
3.0
4.4
3.7
3.7
-5.8
0.9
3.6
6.3
4.7
0.3
1.9
-2.5
-2.7
0.2
1.1
2.4
5.8
2.0
0.4
5.5
4.9
4.6
4.8
7.2
8.3
5.5
0.4
6.6
3.9
2.7
1.9
2.4
9.7
41.3
-8.1
1.0
19.9
1.8
-5.8
1.8
-2.7
0.1
-3.9
10.6
5.3
-0.4
4.9
2.7
0.7
5.6
10.2
-1.4
7.2
0.5
7.5
5.4
6.1
0.1
6.9
9.9
0.0
Source: Company, MOSL
15 January 2014
11

TCS
Corporate profile
Company description
TCS is the largest IT services company in India, with (LTM)
revenue of over USD~15b. It employs over 318,000 people
and provides IT and BPO services to over 1,000 global
clients. It is one of the preferred IT vendors for most
Fortune 500/Global 1,000 companies.
Exhibit 21: Sensex rebased
3,500
3,100
2,700
2,300
1,900
Jan-14
Apr-14
Jul-14
Oct-14
Jan-15
TCS
Sensex - Rebased
Exhibit 22:
Shareholding pattern (%)
Sep-14
Promoter
DII
FII
Others
73.9
4.8
16.8
4.5
Jun-14
73.9
5.1
16.5
4.5
Sep-13
74.0
5.6
16.1
4.4
Exhibit 23:
Top holders
Holder Name
LIC of India
Franklin Templeton Investment Funds
% Holding
2.2
1.2
Note: FII Includes depository receipts
Exhibit 24:
Top management
Name
Cyrus Mistry
N Chandrasekaran
Rajesh Gopinathan
Ajoyendra Mukherjee
Designation
Chairman
MD & CEO
CFO
Head, Global HR
Exhibit 25:
Director
Name
Cyrus Mistry
N Chandrasekaran
O P Bhatt*
Ron Sommer*
Aman Mehta*
Name
Vijay Kelkar*
Ishaat Hussain
Phiroz A Vandrevala
Clayton M Christensen*
Venkatraman Thyagarajan*
*Independent
Exhibit 26:
Auditors
Name
Deloitte Haskins & Sells LLP
Statutory
Type
Exhibit 27:
MOSL forecast v/s consensus
EPS (INR)
FY15
FY16
FY17
MOSL forecast
108.4
125.8
147.2
Consensus
forecast
110.0
127.0
145.9
Variation (%)
-1.5
-1.0
0.9
15 January 2014
12

TCS
Financials and valuations
Key Assumptions
Y/E March
INR/USD Rate
Revenues (USD m)
Offshore Revenue (%)
Total Headcount
Net Addition
Per Capita Productivity
Utilization excl. trainees (%)
Utilization incl. trainees (%)
2010
47.4
6,339
51.0
160,429
16,668
41,678
80.5
68.1
2011
45.6
8,187
51.0
198,614
38,185
45,603
83.2
69.4
2012
48.1
10,171
50.6
238,583
39,969
46,528
82.2
68.7
2013
54.4
11,568
49.3
276,196
37,613
44,945
81.7
68.3
2014
60.9
13,443
47.9
300,464
24,268
46,623
83.6
75.4
2015E
61.2
15,559
46.2
328,066
27,602
49,508
86.4
80.5
2016E
62.0
17,557
45.8
372,631
44,565
50,112
87.4
80.4
2017E
62.0
20,132
45.7
419,349
46,718
50,839
87.5
81.0
Income statement
Y/E March
Sales
Change (%)
Cost of Services
SG&A Expenses
EBITDA
% of Net Sales
Depreciation
Other Income
PBT
Tax
Rate (%)
Minority Interest
PAT
Change (%)
2010
300,289
8.0
157,243
56,246
86,800
28.9
7,209
2,255
81,846
12,088
14.8
1,019
68,729
32.9
2011
373,245
24.3
198,505
62,848
111,892
30.0
7,990
5,247
109,149
21,203
19.4
1,116
86,827
26.3
2012
488,938
31.0
258,773
85,988
144,177
29.5
9,036
4,041
139,182
31,688
22.8
1,110
106,384
22.5
2013
629,895
28.8
332,545
116,480
180,870
28.7
10,792
11,174
181,252
40,344
22.3
1,494
139,413
31.0
2014
818,094
29.9
422,065
144,707
251,322
30.7
13,243
15,891
253,969
60,712
23.9
2,089
191,168
37.1
2015E
952,559
16.4
513,643
164,456
274,460
28.8
18,310
23,838
279,988
65,267
23.3
2,367
212,354
11.1
2016E
1,088,513
14.3
593,147
186,344
309,022
28.4
17,723
32,035
323,335
74,367
23.0
2,568
246,400
16.0
(INR Million)
2017E
1,248,178
14.7
681,020
207,863
359,295
28.8
19,074
37,506
377,727
86,877
23.0
2,568
288,282
17.0
Balance Sheet
Y/E March
Share Capital
Reserves
Net Worth
Preference shares
Minority Interest
Loans
Capital Employed
Gross Block
Less : Depreciation
Net Block
Other LT Assets
Investments
Curr. Assets
Debtors
Cash & Bank Balance
Other Current Assets
Current Liab. & Prov
Current Liabilities
Net Current Assets
Application of Funds
E: MOSL Estimates
2010
1,957
207,427
209,384
1,000
4,056
9,110
223,549
67,532
25,826
41,706
54,920
37,799
140,120
70,109
10,249
59,762
50,996
50,996
89,124
223,549
2011
1,957
250,432
252,389
1,000
4,663
10,718
268,771
86,156
33,816
52,340
89,929
18,390
171,948
95,479
47,401
29,068
63,837
63,837
108,111
268,771
2012
1,957
323,276
325,233
1,000
5,276
12,306
343,815
107,400
42,852
64,548
110,269
0
237,173
137,469
34,617
65,087
68,175
68,175
168,998
343,815
2013
1,957
407,524
409,481
1,000
6,561
10,894
427,936
135,587
53,644
81,944
88,815
33,765
315,022
172,366
79,035
63,621
91,609
91,609
223,413
427,936
2014
1,959
551,393
553,352
0
6,905
12,561
572,817
170,530
66,887
103,644
118,105
37,673
429,703
222,360
156,495
50,848
116,308
116,308
313,395
572,817
2015E
1,959
633,998
635,956
15,927
8,309
16,642
676,834
222,907
85,197
137,711
140,634
7,228
578,052
251,496
259,708
66,848
186,791
186,791
391,261
676,834
2016E
1,959
779,332
781,291
15,927
8,309
18,946
824,472
255,098
102,919
152,178
159,636
7,228
708,108
289,166
342,082
76,860
202,679
202,679
505,429
824,472
(INR Million)
2017E
1,959
947,746
949,704
15,927
8,309
21,414
995,354
287,288
121,994
165,294
181,421
7,228
860,447
329,527
443,331
87,588
219,037
219,037
641,410
995,354
15 January 2014
13

TCS
Financials and valuations
Ratios
Y/E March
Basic (INR)
EPS
Cash EPS
Book Value
DPS
Payout %
Valuation (x)
P/E
Cash P/E
EV/EBITDA
EV/Sales
Price/Book Value
Dividend Yield (%)
Profitability Ratios (%)
RoE
RoCE
Turnover Ratios
Debtors (Days)
Fixed Asset Turnover (x)
2010
35.1
38.8
107.5
20.0
57.0
2011
44.4
48.4
129.5
14.0
31.6
57.4
52.5
44.0
13.2
19.7
0.6
37.4
41.0
88
7.6
37.4
42.2
81
7.9
2012
54.4
59.0
166.7
25.0
46.0
46.8
43.2
34.4
10.1
15.3
1.0
36.7
44.1
87
8.4
2013
71.2
76.7
209.7
22.0
30.9
35.7
33.2
27.0
7.7
12.1
0.9
37.8
44.1
90
8.6
2014
97.6
104.4
282.5
32.0
32.8
26.1
24.4
19.1
5.9
9.0
1.3
39.7
47.6
88
8.8
2015E
108.4
117.8
332.8
40.0
36.9
23.5
21.6
17.3
5.0
7.6
1.6
35.2
41.0
91
7.9
2016E
125.8
134.8
407.0
43.0
34.2
20.2
18.9
15.1
4.3
6.3
1.7
34.0
38.8
91
7.5
2017E
147.2
156.9
493.0
51.0
34.7
17.3
16.2
12.7
3.6
5.2
2.0
32.7
37.4
90
7.9
Cash Flow Statement
Y/E March
CF from Operations
Cash for Working Capital
Net Operating CF
Net Purchase of FA
Net Purchase of Invest.
Net Cash from Invest.
Proc. from equity issues
Proceeds from LTB/STB
Dividend Payments
Cash Flow from Fin.
Free Cash Flow
Net Cash Flow
Opening Cash Bal.
Add: Net Cash
Closing Cash Bal.
E: MOSL Estimates
2010
75,856
-44,271
31,584
-3,987
-20,461
-24,448
30,864
4,605
-45,797
-10,328
27,597
-3,191
13,440
-3,191
10,249
2011
94,817
18,165
112,982
-53,633
19,409
-34,224
-11,155
1,608
-32,058
-41,604
59,349
37,153
10,249
37,153
47,402
2012
115,419
-73,671
41,747
-41,584
18,390
-23,193
24,319
1,588
-57,246
-31,339
164
-12,785
47,402
-12,785
34,617
2013
150,205
-9,997
140,208
-6,733
-33,765
-40,498
-3,504
-1,412
-50,377
-55,292
133,475
44,418
34,617
44,418
79,035
2014
204,411
-12,522
191,890
-64,233
-3,909
-68,142
25,371
1,666
-73,325
-46,287
127,656
77,461
79,035
77,461
156,495
2015E
230,664
25,347
256,012
-74,906
30,445
-44,461
-18,405
4,082
-94,014
-108,337
181,105
103,213
156,495
103,213
259,708
2016E
264,122
-31,795
232,328
-51,192
0
-51,192
0
2,303
-101,065
-98,762
181,136
82,374
259,708
82,374
342,082
(INR Million)
2017E
307,356
-34,732
272,624
-53,975
0
-53,975
0
2,468
-119,868
-117,400
218,649
101,249
342,082
101,249
443,331
15 January 2014
14

TCS
NOTES
15 January 2014
15

Disclosures
This document has been prepared by Motilal Oswal Securities Limited (hereinafter referred to as Most) to provide information about the company(ies) and/sector(s), if any, covered in the report and may be
distributed by it and/or its affiliated company(ies). This report is for personal information of the selected recipient/s and does not construe to be any investment, legal or taxation advice to you. This research report does
TCS
not constitute an offer, invitation or inducement to invest in securities or other investments and Motilal Oswal Securities Limited (hereinafter referred as MOSt) is not soliciting any action based upon it. This report is not
for public distribution and has been furnished to you solely for your general information and should not be reproduced or redistributed to any other person in any form. This report does not constitute a personal
recommendation or take into account the particular investment objectives, financial situations, or needs of individual clients. Before acting on any advice or recommendation in this material, investors should consider
whether it is suitable for their particular circumstances and, if necessary, seek professional advice. The price and value of the investments referred to in this material and the income from them may go down as well as
up, and investors may realize losses on any investments. Past performance is not a guide for future performance, future returns are not guaranteed and a loss of original capital may occur.
MOSt and its affiliates are a full-service, integrated investment banking, investment management, brokerage and financing group. We and our affiliates have investment banking and other business relationships with a
some companies covered by our Research Department. Our research professionals may provide input into our investment banking and other business selection processes. Investors should assume that MOSt and/or
its affiliates are seeking or will seek investment banking or other business from the company or companies that are the subject of this material and that the research professionals who were involved in preparing this
material may educate investors on investments in such business. The research professionals responsible for the preparation of this document may interact with trading desk personnel, sales personnel and other
parties for the purpose of gathering, applying and interpreting information. Our research professionals are paid on the profitability of MOSt which may include earnings from investment banking and other business.
MOSt generally prohibits its analysts, persons reporting to analysts, and members of their households from maintaining a financial interest in the securities or derivatives of any companies that the analysts cover.
Additionally, MOSt generally prohibits its analysts and persons reporting to analysts from serving as an officer, director, or advisory board member of any companies that the analysts cover. Our salespeople, traders,
and other professionals or affiliates may provide oral or written market commentary or trading strategies to our clients that reflect opinions that are contrary to the opinions expressed herein, and our proprietary
trading and investing businesses may make investment decisions that are inconsistent with the recommendations expressed herein. In reviewing these materials, you should be aware that any or all of the foregoing
among other things, may give rise to real or potential conflicts of interest. MOSt and its affiliated company(ies), their directors and employees and their relatives may; (a) from time to time, have a long or short position
in, act as principal in, and buy or sell the securities or derivatives thereof of companies mentioned herein. (b) be engaged in any other transaction involving such securities and earn brokerage or other compensation
or act as a market maker in the financial instruments of the company(ies) discussed herein or act as an advisor or lender/borrower to such company(ies) or may have any other potential conflict of interests with
respect to any recommendation and other related information and opinions.; however the same shall have no bearing whatsoever on the specific recommendations made by the analyst(s), as the recommendations
made by the analyst(s) are completely independent of the views of the affiliates of MOSt even though there might exist an inherent conflict of interest in some of the stocks mentioned in the research report
Reports based on technical and derivative analysis center on studying charts company's price movement, outstanding positions and trading volume, as opposed to focusing on a company's fundamentals and, as
such, may not match with a report on a company's fundamental analysis. In addition MOST has different business segments / Divisions with independent research separated by Chinese walls catering to different set
of customers having various objectives, risk profiles, investment horizon, etc, and therefore may at times have different contrary views on stocks sectors and markets.
Unauthorized disclosure, use, dissemination or copying (either whole or partial) of this information, is prohibited. The person accessing this information specifically agrees to exempt MOSt or any of its affiliates or
employees from, any and all responsibility/liability arising from such misuse and agrees not to hold MOSt or any of its affiliates or employees responsible for any such misuse and further agrees to hold MOSt or any of
its affiliates or employees free and harmless from all losses, costs, damages, expenses that may be suffered by the person accessing this information due to any errors and delays. The information contained herein is
based on publicly available data or other sources believed to be reliable. Any statements contained in this report attributed to a third party represent MOSt’s interpretation of the data, information and/or opinions
provided by that third party either publicly or through a subscription service, and such use and interpretation have not been reviewed by the third party. This Report is not intended to be a complete statement or
summary of the securities, markets or developments referred to in the document. While we would endeavor to update the information herein on reasonable basis, MOSt and/or its affiliates are under no obligation to
update the information. Also there may be regulatory, compliance, or other reasons that may prevent MOSt and/or its affiliates from doing so. MOSt or any of its affiliates or employees shall not be in any way
responsible and liable for any loss or damage that may arise to any person from any inadvertent error in the information contained in this report. MOSt or any of its affiliates or employees do not provide, at any time,
any express or implied warranty of any kind, regarding any matter pertaining to this report, including without limitation the implied warranties of merchantability, fitness for a particular purpose, and non-infringement.
The recipients of this report should rely on their own investigations.
This report is intended for distribution to institutional investors. Recipients who are not institutional investors should seek advice of their independent financial advisor prior to taking any investment decision based on
this report or for any necessary explanation of its contents.
Most and it’s associates may have managed or co-managed public offering of securities, may have received compensation for investment banking or merchant banking or brokerage services, may have received any
compensation for products or services other than investment banking or merchant banking or brokerage services from the subject company in the past 12 months.
Most and it’s associates have not received any compensation or other benefits from the subject company or third party in connection with the research report.
Subject Company may have been a client of Most or its associates during twelve months preceding the date of distribution of the research report
MOSt and/or its affiliates and/or employees may have interests/positions, financial or otherwise of over 1 % at the end of the month immediately preceding the date of publication of the research in the securities
mentioned in this report. To enhance transparency, MOSt has incorporated a Disclosure of Interest Statement in this document. This should, however, not be treated as endorsement of the views expressed in the
report.
Motilal Oswal Securities Limited is under the process of seeking registration under SEBI (Research Analyst) Regulations, 2014.
There are no material disciplinary action that been taken by any regulatory authority impacting equity research analysis activities
Analyst Certification
The views expressed in this research report accurately reflect the personal views of the analyst(s) about the subject securities or issues, and no part of the compensation of the research analyst(s) was, is, or will be
directly or indirectly related to the specific recommendations and views expressed by research analyst(s) in this report. The research analysts, strategists, or research associates principally responsible for preparation
of MOSt research receive compensation based upon various factors, including quality of research, investor client feedback, stock picking, competitive factors and firm revenues
Disclosure of Interest Statement
§
Analyst ownership of the stock
§
Served as an officer, director or employee
TATA CONSULTANCY SVCS
No
No
Regional Disclosures (outside India)
For U.S.
This report is not directed or intended for distribution to or use by any person or entity resident in a state, country or any jurisdiction, where such distribution, publication, availability or use would be contrary to law,
regulation or which would subject MOSt & its group companies to registration or licensing requirements within such jurisdictions.
Motilal Oswal Securities Limited (MOSL) is not a registered broker - dealer under the U.S. Securities Exchange Act of 1934, as amended (the"1934 act") and under applicable state laws in the United States. In
addition MOSL is not a registered investment adviser under the U.S. Investment Advisers Act of 1940, as amended (the "Advisers Act" and together with the 1934 Act, the "Acts), and under applicable state laws in the
United States. Accordingly, in the absence of specific exemption under the Acts, any brokerage and investment services provided by MOSL, including the products and services described herein are not available to or
intended for U.S. persons.
This report is intended for distribution only to "Major Institutional Investors" as defined by Rule 15a-6(b)(4) of the Exchange Act and interpretations thereof by SEC (henceforth referred to as "major institutional
investors"). This document must not be acted on or relied on by persons who are not major institutional investors. Any investment or investment activity to which this document relates is only available to major
institutional investors and will be engaged in only with major institutional investors. In reliance on the exemption from registration provided by Rule 15a-6 of the U.S. Securities Exchange Act of 1934, as amended (the
"Exchange Act") and interpretations thereof by the U.S. Securities and Exchange Commission ("SEC") in order to conduct business with Institutional Investors based in the U.S., MOSL has entered into a chaperoning
agreement with a U.S. registered broker-dealer, Motilal Oswal Securities International Private Limited. ("MOSIPL"). Any business interaction pursuant to this report will have to be executed within the provisions of this
chaperoning agreement.
The Research Analysts contributing to the report may not be registered /qualified as research analyst with FINRA. Such research analyst may not be associated persons of the U.S. registered broker-dealer, MOSIPL,
and therefore, may not be subject to NASD rule 2711 and NYSE Rule 472 restrictions on communication with a subject company, public appearances and trading securities held by a research analyst account.
Motilal Oswal Capital Markets Singapore Pte Limited is acting as an exempt financial advisor under section 23(1)(f) of the Financial Advisers Act(FAA) read with regulation 17(1)(d) of the Financial Advisors
Regulations and is a subsidiary of Motilal Oswal Securities Limited in India. This research is distributed in Singapore by Motilal Oswal Capital Markets Singapore Pte Limited and it is only directed in Singapore to
accredited investors, as defined in the Financial Advisers Regulations and the Securities and Futures Act (Chapter 289), as amended from time to time.
In respect of any matter arising from or in connection with the research you could contact the following representatives of Motilal Oswal Capital Markets Singapore Pte Limited:
Anosh Koppikar
Kadambari Balachandran
Email : anosh.Koppikar@motilaloswal.com
Email : kadambari.balachandran@motilaloswal.com
Contact : (+65)68189232
Contact : (+65) 68189233 / 65249115
Office Address : 21 (Suite 31),16 Collyer Quay,Singapore 04931
For Singapore
Motilal Oswal Securities Ltd
15 January 2014
Motilal Oswal Tower, Level 9, Sayani Road, Prabhadevi, Mumbai 400 025
Phone: +91 22 3982 5500 E-mail: reports@motilaloswal.com
16