WEEK IN A NUTSHELL
WIN-dow to the week that was
Week in a Nutshell (WIN)
Week
ended
th
16 Jan
2015
Key WIN-dicators
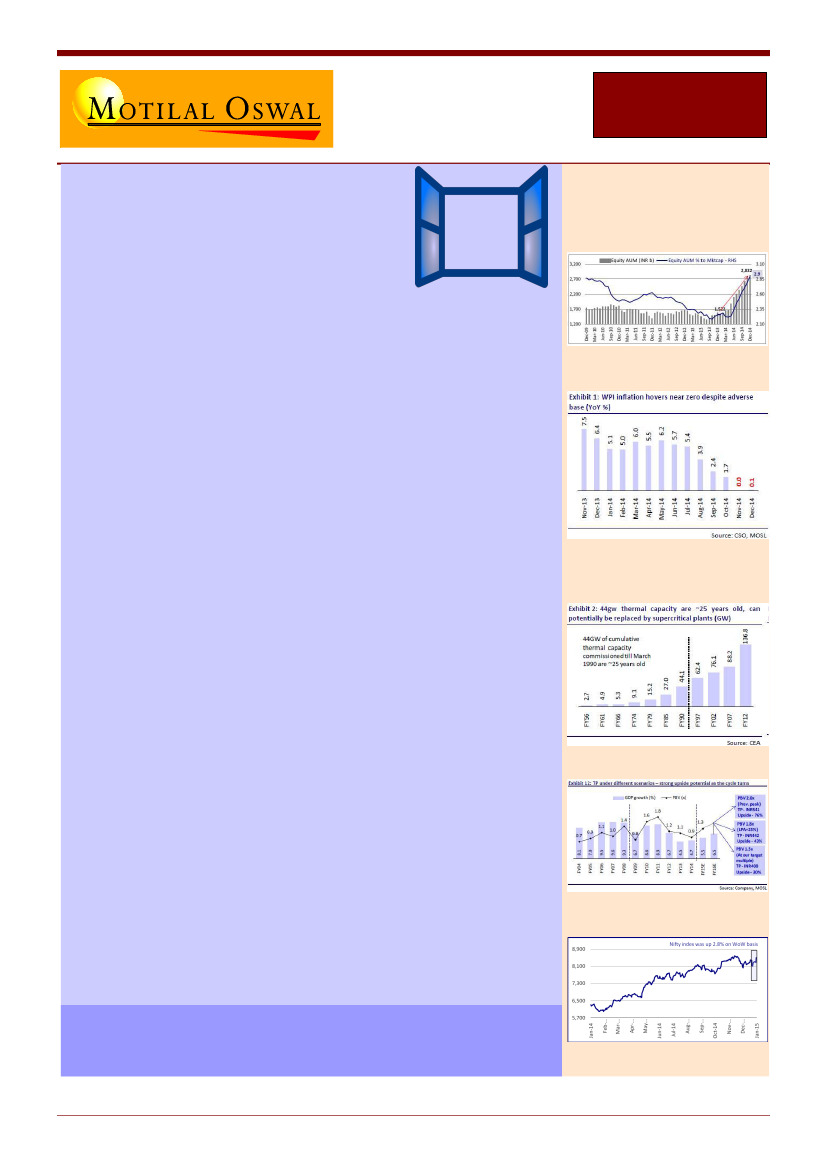
Trend in Domestic MF equity AUM
and % of Indian market cap
WPI inflation announced at the beginning of the week prompted RBI to
cut REPO rate by 25 bps between policy reviews, The markets rejoiced the
unexpected move and ended up 2.8% for the week, this was the highest
weekly gain by Nifty since October. Realty was the biggest gainer of the
week posting returns of 5.7%. But surprisingly FMCG sector (up 4.1%)
outperformed the banks index (up 3.2%), this outperformance was on
back of HUVR which gained another 27% for the week on back of slew of
analyst upgrades. Oil and Gas (down 0.9%) and Metals (down 4.1%) were
the only two sectoral indices to close in the red for the week on back of
sliding commodity prices.
After a stellar set of numbers posted by INFO, TCS was not able to stand up
to market expectations. TCS’s 3Q numbers came in as a disappointment for
the market on back of its lower than expected CC revenue growth of 40
bps.
Private banks (AXSB and YES) continued to post decent set of number
backed by stable asset quality and growth. Markets also drew comfort from
the trade deficit number announced during the week. Year till Jan FY15
Trade deficit stood at 5.2% of GDP Vs 7.4% for FY14.
Bajaj Auto reported their highest-ever EBITDA despite weakening domestic
market share. The companies focus on profitability and global markets
gives us confidence in Bajaj Auto. Trading at a reasonable 16x FY16, we
remain positive on the stock.
Markets got a bit shaken up post the large appreciation the CHF saw post
the move by SCB, but strong FII inflows made sure that Nifty outperformed
most of the global equity indices for the week.
Some of the highlights of this edition:
ECOSCOPE: RATE CUT CYCLE BEGINS
3QFY15 results – TCS, IIB, Bajaj Auto
Detailed reports – SBI, BHEL, L&T
WPI Inflation near
adverse base (YoY %)
zero
despite
44GW Thermal capacity are ~25 years
old, can potentially be replaced by
supercritical plants (GW)
SBI target price under 3 scenarios
Nifty (2.8%) WoW
WWW – WIN Weekend Wisdom
The stock market will always do whatever makes the greatest number
of people look foolish.
Read
WIN – Week In a Nutshell
more:
http://www.benzinga.com/life/entrepreneurship/11/05/1064754/words-
Jan 16
th
2015
of-wisdom-famous-trading-investing-and-money-sayings-part-

WEEK IN A NUTSHELL
WEEK IN A NUTSHELL
[W]INside this week’s edition
WIN-TERESTING DATA POINTS ...................................................................................................................................................3
WIN-NING CHARTS & CHATS ......................................................................................................................................................4
T
HE GLOBAL ECONOMY
- U
NEASY LIES THE RED
.........................................................................................................................................4
WIN- RESEARCH HIGHLIGHTS OF THE WEEK ...............................................................................................................................5
ECOSCOPE: R
ATE CUT CYCLE BEGINS
; B
ENIGN INFLATION
,
FISCAL RESTRAINT ENABLES SHIFT IN STANCE
; E
XPECT
150
BPS RATE CUTS IN
2015 ...........5
TCS 3QFY15: B
ELOW ESTIMATES AS VOLUME GROWTH IS FLAT
; C
OMMENTARY REMAINS POSITIVE
; C
UT ESTIMATES BY
3%; P
REFER
I
NFOSYS IN THE
SECTOR
.............................................................................................................................................................................................5
BAJAJ AUTO 3QFY15: H
IGHEST
-
EVER
EBITDA; E
ARNINGS UPGRADES LIKELY AHEAD
; T
RADES ATTRACTIVE AT
16
X
............................................5
BHEL: E
MERGING FROM THE ECLIPSE
; C
YCLICAL FACTORS SUPPORT RECOVERY
; E
XPANDING PRODUCT OFFERINGS
.................................................6
INDUSIND BANK 3QFY15: IN-LINE, HEALTHY GROWTH, SUPERIOR ASSET QUALITY, EARNINGS CAGR OF 25% .............................7
STATE BANK OF INDIA: FAVORABLE CYCLE AHEAD; PRIMED FOR RECOVERY; CORE PROFITABILITY + ASSET QUALITY + REFORMS
= STRONG RE-RATING ....................................................................................................................................................................8
C
APITAL
G
OODS
: T&D S
PEND
A
CCELERATES
L
ED
B
Y
H
IGH
-E
ND
T
ECH
A
REAS
; ‘M
AKE
I
N
I
NDIA
’ A
N
I
MPORTANT
R
ESOLVE
- I
NDIGENIZING
G
IS
P
RODUCTS
I
S
N
EXT
O
N
A
GENDA
..........................................................................................................................................................11
WIN RESEARCH NOTE HIGHLIGHTS IN BRIEF ............................................................................................................................13
T
ATA
M
OTORS
: JLR D
EC
-14
WHOLESALE GROWS
6.8% Y
O
Y (
IN
-
LINE
); LR
REGISTERS
7.5%
GROWTH
, J
AGUAR CLOCKS
3.1%
GROWTH
Y
O
Y ..........13
ECOSCOPE: CPI
RESTRAINED AT
5%; IIP
REBOUNDS TO
3.8%; E
XPECT
RBI
TO CUT RATES IN
F
EB
-15
POLICY
...................................................13
CEMENT: C
OST MODERATION TO DRIVE UP PROFITABILITY
; V
OLUME
-
LED PRICE RECOVERY STILL ELUSIVE
,
THOUGH
............................................13
STATE BANK OF INDIA: F
AVORABLE CYCLE AHEAD
;
PRIMED FOR RECOVERY
; C
ORE PROFITABILITY
+ A
SSET QUALITY
+ R
EFORMS
= S
TRONG RE
-
RATING
...........................................................................................................................................................................................14
L
ARSEN
& T
OUBRO
: D
RAWING THE LINE B
/
W LIKELY SURPRISES
/
DISAPPOINTMENTS
; T
HE
M
ONITORABLE
T
ROIKA
..............................................15
INFOSYS 3QFY15: A
FTER DEALING WITH MARGINS
,
REVENUE GROWTH GETTING ADDRESSED
.......................................................................16
TECH MAHINDRA: A
CQUIRES
S
OFGEN HOLDINGS
L
IMITED
(SOFGEN); A
CCESS TO
BFSI
CUSTOMER BASE KEY RATIONALE
; EPS-
NEUTRAL
...........16
METALS WEEKLY: I
NDIAN IRON ORE PRICES FELL FOR
2
ND WEEK ON EASING SUPPLY
...................................................................................17
YES BANK 3QFY15: A
CCELERATION IN KEY GROWTH PARAMETERS
;
REPORTS HIGHEST
R
O
A
OF
1.8%;
WELL CAPITALIZED FOR THE GROWTH CYCLE
.17
LIC HOUSING 3QFY15: B
ELOW ESTIMATE AS SPREADS DISAPPOINT
; B
USINESS GROWTH REMAINS STRONG
,
ASSET QUALITY IMPROVES
.................18
BAJAJ FINANCE 3QFY15: A
BOVE ESTIMATE
: S
TRONG
AUM
GROWTH AND
NIM
IMPROVES
200
BPS
Q
O
Q ...................................................18
NIIT TECHNOLOGIES 3QFY15: O
PERATIONALLY IN LINE
,
GROWTH LAGGED IN FOCUS REGIONS
...................................................................18
AUM: MAKES NEW HIGH IN DECEMBER; UP 4% QOQ ..................................................................................................................19
METALS / CEMENT: MMDRA
ORDINANCE TO CLEAR IMPASSE
; M
INES TO BE AUCTIONED
;
NO RETROSPECTIVE IMPLICATIONS
...........................19
ECOSCOPE: WPI
HOVERS AROUND ZERO
; D
ISINFLATIONARY TREND PERSISTS
,
EXPECT
RBI
TO CUT RATES IN
F
EB
-15 ..........................................20
INDIA POLITICS: A
WALK DOWN
'
ORDINANCE
'
LANE
; T
EN EFFECTED UNDER
NDA-2;
EXPECT MORE
...............................................................20
FINANCIALS: R
ATE CUT CYCLE INITIATED
; L
ENDING
/
DEPOSIT RATE CUTS BEGIN
; B
ULK BORROWERS AND CORPORATE LENDERS TO BENEFIT
............20
ECOSCOPE: E
XPORTS
,
IMPORTS
,
TOTAL TRADE
,
DEFICIT ALL FALL
; C
OMMODITIES MELTDOWN RESULTING IN LOWER EXPORTS AND IMPORTS
...........21
HEALTHCARE: I
NDIAN PHARMA MARKET
– M
ONTHLY PERFORMANCE TRACKER
; S
USTAINED GROWTH RECOVERY
,
EXPECT MOMENTUM TO PICK UP
.21
FEDERAL BANK 3QFY15: C
ORE PERFORMANCE DISAPPOINTS
;
TRADING GAINS DRIVE EARNINGS
;
CUT EST BY
2-3%..........................................21
D B CORP 3QFY15: N
EWSPRINT PRICE SUPPORTIVE
;
AD RE
-
BOUND AWAITED
............................................................................................22
WIN-SIGHT OF THE WEEK .........................................................................................................................................................23
T
HE FALL IN THE PRICE OF OIL AND GAS PROVIDES A ONCE
-
IN
-
A
-
GENERATION OPPORTUNITY TO FIX BAD ENERGY POLICIES
......................................23
NIFTY VALUATIONS AT A GLANCE ............................................................................................................................................25
WIN – Week In a Nutshell
2
Jan 16
th
2015

WEEK IN A NUTSHELL
WEEK IN A NUTSHELL
WIN-teresting data points
Global
Indices
Sensex
Nikkei
Hang Seng
Dow Jones
FTSE 100
Sectoral
Indices
Bank Nifty
CNX IT
BSE Oil
Bond yields-
India
1 Year
10 Year
18637
11400
9840
Last
Friday
8.30
7.85
19223
11660
9755
3.14
2.28
-1
WoW change
(%)
-4.99
-1.77
13.91
15.01
10.55
Spread Vs US 10
yrs
7.74
5.99
Currency
Rs Vs Dollar
Euro Vs Dollar
62.33
1.18
61.87
1.16
-0.73
-2.18
Last
week
27458
17198
23920
17737
6501
Current
week
28122
16864
24104
17321
6508
WoW change
(%)
2.42
-1.94
0.77
-2.35
0.10
P/E Valuations
16.26
25.39
11.61
13.22
15.24
Commodities
Oil(US$/Bbl)
Precious Metals
Gold ($/OZ)
Silver ($/OZ)
Metals
Copper(US$/MT)
Zinc(US$/MT)
Aluminum(US$/MT)
This week
7.89
7.71
6167
2146
1790
5681
2054
1782
-7.87
-4.54
-0.46
1223
17
1260
17
3.07
2.92
Last week
49.37
This
week
47.01
WoW change
(%)
-4.78
BSE 500 – Key Movers
Top Gainers
Company Name
Prism Cement
India Cement
Thomas Cook
Sun Tv
ENIL
Monsanto India
% Change
23%
22%
21%
18%
16%
15%
Top Losers
Company Name
Hindalco
Elder Pharma
Den Networks
Petronet LNG
Torrent Pharma
Berger Paints
% Change
-11%
-9%
-8%
-8%
-8%
-7%
WIN – Week In a Nutshell
3
Jan 16
th
2015

WEEK IN A NUTSHELL
WEEK IN A NUTSHELL
WIN-ning charts & chats
The global economy - Uneasy lies the red
IT IS easier to be sanguine about the fall in oil prices than it is a plunge in copper. Oil is being driven lower by
oversupply. The price of a barrel of Brent crude now sits below $50, and may well keep falling: the US Energy
Information Administration, an American government agency, expects global supply to exceed demand this year
and next. Falls in the price of copper, which has been dropping in recent days, are a signal of something more
sinister. The red metal is an input in everything from cars to mobile phones, and price fluctuations are widely
interpreted as an indicator of rising or falling demand. Unease about the strength of the global economy is showing
up elsewhere, too. Europe is stagnant: the euro dipped below its 1999 launch rate against the dollar for the first
time in nine years on January 14th. Data released on the same day showed that retail sales fell in America in
December, propelling the S&P500 down and the Vix, a gauge of uncertainty, up. Yields on 30-year Treasuries posted
a record low, too, a classic sign of investors seeking shelter. Investors have until now been fairly discriminating in
their reaction to the oil-price collapse, selling energy companies but buying the story that the rest of the economy
will benefit. Fear may now be getting the upper hand.
WIN – Week In a Nutshell
4
Jan 16
th
2015

WEEK IN A NUTSHELL
WEEK IN A NUTSHELL
Win- RESEARCH HIGHLIGHTS OF THE WEEK
ECOSCOPE: Rate cut cycle begins; Benign inflation, fiscal restraint enables shift in stance; Expect 150bps
rate cuts in 2015
Click here to access detailed report
RBI cut its key policy rates by 25bp keeping with its stated policy in Dec-14 to initiate rate cuts even in-between
scheduled policy events if the disinflationary trend persists.
Also keeping with the Dec-14 policy statement, the current measure is indicated as a shift in stance implying
more rate cuts provided i) disinflation persists and ii) fiscal restraint is maintained and iii) government policies in
infrastructure eases supply bottlenecks.
RBI also admitted that the inflation trend has been lower than its projected path and inflationary expectations
have moderated to single digit.
We hold that room for further cuts exists already with CPI inflation for Mar-15 likely to overachieve the Mar-15
revised estimate and Jan-16 target of 6%.
We also expect further headroom for rate cuts to be created by persistence of disinflationary trend and
government maintaining its fiscal goals despite difficulties.
Only external sector considerations, such as a sharp fall in emerging market currencies may result in a pause but
unlikely to cause any reversal in the easing cycle itself. Hence we expect RBI to cut rates by a cumulative 150bp
in 2015.
TCS 3QFY15: Below estimates as volume growth is flat; Commentary remains positive; Cut estimates by
3%; Prefer Infosys in the sector
Click here to access detailed report
Disappointing services growth: TCS’ 3QFY15 constant currency (CC) revenue growth was 2.5% QoQ (v/s est. of
3.1%); ex the sale of equipment (2.3% of business) services, CC revenue growth was 1.6% QoQ, below our
estimate. Volume growth of 0.4% QoQ is a 23-quarter low. EBIT margin was in line at 27% (+20bp QoQ). PAT
grew 2.9% QoQ to INR54.4b, vs estimate of INR56.1b. Tax rate was 24% vs est of 23%.
Contrasting trends across TCS and INFO: The trend of volume-pricing split across TCS and INFO contrasted in
3QFY15 – INFO’s CC realization declined 1.6% QoQ and TCS’ rose by 2.3%. TCS’ volume growth was 0.4%,
against INFO’s 4.2% QoQ.
Positive read through for industry: TCS’ comments of larger structured programs around Digital, likely recovery
in Retail and positive growth outlook in the US and Europe are positive. However, cost structure transformation
initiatives in BFSI on the back of multiple fines could lead to elongated deal cycles.
Valuation and view: We have lowered the FY16E/17E revenue and EPS estimates by ~3% mainly due to cross
currency MTM. We note a catch-up in INFO’s performance to TCS’ for second consecutive quarter and continue
to expect a gradual convergence in the valuation gap. TCS’ growth will continue to lead peers in the near term,
but we expect continued tapering of outperformance delta. Our target price of INR2,650 discounts FY17E EPS by
18x, in line with the long term average. Higher multiple will be a function of sustained high growth delta to
peers, though there are few indicators of the same. Maintain Neutral.
BAJAJ AUTO 3QFY15: Highest-ever EBITDA; Earnings upgrades likely ahead; Trades attractive at 16x
Click here to access detailed report
WIN – Week In a Nutshell
5
Jan 16
th
2015

WEEK IN A NUTSHELL
WEEK IN A NUTSHELL
Bajaj Auto’s (BJAUT) 3QFY15 performance was above estimate, led by lower other expenses (forex gain), and
otherwise resulting in a highest-ever EBITDA for BJAUT. We believe bottoming out of the domestic motorcycle
business, good momentum in exports with favorable forex and very reasonable valuations make BJAUT an
attractive stock to play for potential earnings upgrade (led by positive surprises on volumes and eventual launch
of RE60) and re-rating. Maintain Buy.
Strong realizations, led by favorable forex, drive revenue: Net sales grew by 10.3% YoY (-5.1% QoQ) to INR56.6b
(est. INR55.9b), led by 11.3% YoY growth (+1.7% QoQ) in realizations, while volumes de-grew by 0.9% YoY (-
6.7% QoQ).
Adj. EBITDA margin grew 280bp QoQ to 21.7% (v/s est. 19.6%): EBIDTA at ~INR12.3b is the highest-ever, a
growth of 8% YoY (+9% QoQ). EBITDA margin at 21.7% (v/s est. ~19.6%; -40bp YoY,+280bp QoQ) was driven by
a) higher realizations and b) forex gain of ~INR790m. On a comparable basis (ex-MTM forex impact and CSR
spend), EBITDA margin is flat YoY and +30bp QoQ. Lower other income (timing difference due to higher
investments in FMPs) restricts Adj PAT to ~INR8.6b (v/s est. ~INR8.56b).
Management commentary: It has already launched the electric start Platina and plans to launch new Pulsars
(150/180/220/200/400cc) in 4QFY15/1QFY16. With these, it expects to see a recovery in the domestic
motorcycle market share by ~6pp to 24%. Based on current visibility, it expects exports momentum to continue
in 4Q, although there could be some impact of weak crude oil prices on demand from Nigeria, Columbia,
Venezuela etc. Almost 2/3rd of FY16 exports are hedged.
Valuation and view: The stock trades at 15.9x/13.7x FY16E/FY17E EPS respectively. Maintain Buy with a target
price of INR2,832 (16x FY17E EPS).
BHEL: Emerging from the eclipse; Cyclical factors support recovery; Expanding product offerings
Click here to access detailed report
Power segment BTB shows uptick; EPC pricing trends stabilize
For BHEL, power segment BTB declined from peak levels of 5.2x in 3QFY09 to 2.3x in mid-FY14, and has since
improved to 3.1x in 2QFY15. Our macro analysis suggests that normative ordering will stand at ~20-24gw pa
(FY19 power demand at 1.5BUs). The journey from 6-7gw pa in FY14-15 to 10-12gw pa in FY16-17 and then ~20-
24gw pa provides interesting possibilities.
Recent pricing trends in EPC contracts suggest stabilization, albeit at lower levels. From a market structure that
was threatened by: i) intense overseas competition ii) and possibility of five to six players in domestic market,
the BTG manufacturing segment has consolidated, with just around three to four serious players commissioning
manufacturing facilities.
Strong operating leverage, cyclical factors aid recovery
BHEL is strongly exposed to cyclical factors: i) contribution margins at ~42% versus expected EBITDA margin of
12.4% (adjusted) in FY14, leading to a meaningful operating leverage, ii) core NWC stable at 200 days; cyclical
factors of retention money (at 181 days in FY14 versus 55-60 days in FY07-09) and customer advances
(deteriorated from 63% of revenue in FY09 to 38% in FY14), that impacted reported NWC are expected to
normalize as we expect BTB to increase from 3.1x currently to 3.8x in FY16E.
WIN – Week In a Nutshell
6
Jan 16
th
2015

WEEK IN A NUTSHELL
WEEK IN A NUTSHELL
We expect operating cash flow to improve from an average of ~INR40b pa in FY13-14 to INR82b pa in FY15E-
17E. Thus, net cash is likely to increase from INR92b in FY14 to INR286b in FY17E (~45% of current market cap).
In FY14, operating cash flow improved to INR54.2b versus INR24.4b in FY13.
BTB inched up to 3.1x in 2QFY15: a key trend driving cyclical factors
We maintain a
Buy
with a revised target price of INR325/sh (PER of 18x FY17E). Our target multiple of 18x is
based on average one-year forward PER during FY06-11, a period when the power sector ordering was robust.
The key variables to watch out are the impact of the Pay Commission recommendation (effective Jan 2017) and
could be an important swing factor. Another important variable is the coal mine auctions.
INDUSIND BANK 3QFY15: IN-LINE, HEALTHY GROWTH, SUPERIOR ASSET QUALITY, EARNINGS CAGR OF
25%
Click here to access detailed report
Healthy loan growth (+7% QoQ and +22% YoY), stable NIMs (3.67%) QoQ, pick-up in CV loans (+4% QoQ v/s
largely flattish/declining QoQ in last two years), strong SA deposits accretion (+7% QoQ and +32% YoY) and
stable asset quality (GNPAs 1.05%, PCR 70%) QoQ were the key highlights.
Share of higher yielding consumer finance loans in total loans came down further to 42.3% from 43.3% a
quarter ago (peak of 51.8% in 2QFY13). Despite a shift in loan mix, IIB is able to report healthy margins of 3.7%
(+4bp QoQ) aided by a decline in cost of funds (-20bp QoQ).
Other highlights: a) from 25%+ YoY growth in fees over the last five years, fees growth moderated to 22%, b)
added 42/125 branches in 3Q/FYTD, c) net stress loans remain one of the best at <1% (87bp, flat QoQ), d)
capital consumption remains high (50bp in 3Q) - risk weighted assets growth of 37% v/s assets growth of 22%
led by higher corporate loans and off balance sheet growth.
WIN – Week In a Nutshell
7
Jan 16
th
2015

WEEK IN A NUTSHELL
WEEK IN A NUTSHELL
Valuation and view
Strong core profitability, improving share of retail liabilities, healthy return ratios (ROA of 1.9% and ROE of 18-
19%) and capitalization (T1 11.5%) are key positives.
Overall superior margins, focused fee income strategy and control over C/I ratio will keep earnings momentum
healthy (26%+ CAGR). Capitalization remains healthy with Tier I at 11.5%. Maintain Buy with a target price of
INR960 (Residual growth model - 3.5x FY17E BV and 18x EPS).
STATE BANK OF INDIA: FAVORABLE CYCLE AHEAD; PRIMED FOR RECOVERY; CORE PROFITABILITY +
ASSET QUALITY + REFORMS = STRONG RE-RATING
Click here to access detailed report
Entering a favorable credit cycle
With improving economic growth, SBIN is likely to be the biggest beneficiary of the recovery cycle. Restructured
loans of 3.6% are lower than peers’ 7-10%, reducing the overhang on asset quality.
Over the last six quarters, gross fresh stress additions are showing a declining trend and NSL has remained in
the range of 6-7%. However, credit cost remains elevated at 1.3% (1HFY15) – unlike other state-owned banks,
SBIN has always been aggressive in recognizing stress loans upfront.
The provisions-to-operating-profit ratio shot up to 50% in FY14 versus average level of 22% over FY07-10.
During the last up-cycle, it declined sharply from 48% in FY04 to 20% in FY08. On a conservative basis, we expect
provisions-to-operating-profit to decline to ~40% by FY17.
Bigger physically, better technologically
During the downturn, SBIN continued to invest in capacity building. It has added ~6k branches and ~37k ATMs
over FY08-14. Despite being a late entrant on the technology front, it has a strong market share of 39% in
number of debit cards and 32% in debit card transactions (POS+ATM). With renewed focus on fees, market
share in payments and transaction banking is likely to go up further.
WIN – Week In a Nutshell
8
Jan 16
th
2015

WEEK IN A NUTSHELL
WEEK IN A NUTSHELL
SBIN has weathered aggressive competition from private sector banks. It has remained one of the best retail
funding liability franchises in India. CASA ratio has remained healthy at 40%+ and the proportion of bulk
deposits has declined to sub-5% now.
Capitalization is one of the key concerns for state-owned banks. SBIN is, however, well-placed, with CET1 of
~10%. It can raise additional capital by selling stake in non-banking subsidiaries. It could also tap additional tier-
1 or tier-2 markets for raising capital. Even if SBIN does not raise capital, CET1 would remain comfortable at
8.7% till FY17.
Earnings recovery could be sharp; expect RoE of ~15% by FY17
SBIN’s performance over the last decade indicates high correlation between the economic cycle and financial
ratios.
During the previous growth cycle (FY03-08; average GDP growth of 8.2%), SBIN’s core PBT (% of average assets)
improved by ~90bp to 1.3%, aided by strong improvement in credit cost (NPA-provisions-to-average-assets
down ~65bp) and operating leverage (down ~25bp).
Over FY08-14, when GDP growth averaged 6.6%, higher credit cost (NPA-provisions-to-average-assets up
~50bp) resulted in core PBT declining by ~55bp to 75bp in FY14. EPS CAGR was flat versus balance sheet CAGR
of 13%.
RoA is at a cyclical low (~65bp) and gradual recovery in earnings (led by lower credit cost and opex) will drive it
to the last cycle average of ~1% by FY17. From a low of 10% in FY14, we expect RoE to improve by ~150bp each
year to ~15% by FY17.
WIN – Week In a Nutshell
9
Jan 16
th
2015

WEEK IN A NUTSHELL
WEEK IN A NUTSHELL
P/BV near LPA, but below peak of 2x; re-rating ahead
Despite 53%+ increase in balance sheet size since FY11, market capitalization remains near 2010-11 levels.
Valuations are near LPA, but at 35% discount to the peak multiple of 2x in the last upcycle.
Considering a more favorable cycle (interest rates likely to go down unlike FY04-08, when they were rising),
higher share of core profitability in overall profitability, and reforms in the sector, multiples could surpass the
last cycle peak.
We roll over our target price to FY17E. Reiterate Buy, with a target price of INR400 (1.5x FY17E consolidated BV
+ INR13 for Insurance).
WIN – Week In a Nutshell
10
Jan 16
th
2015

WEEK IN A NUTSHELL
WEEK IN A NUTSHELL
Capital Goods: T&D Spend Accelerates Led By High-End Tech Areas; ‘Make In India’ An Important
Resolve - Indigenizing Gis Products Is Next On Agenda
Click here to access detailed report
High-end technology segment and Substation ordering drive T&D spend
During 9MFY15, PWGR’s ordering activity has shown meaningful improvement from the lows in FY14, with
ordering activity at INR127b (up 49% YoY). Key takeaways are: i) bulk of the project awards (at 44%) are from
high technology segments like HVDC, STATCOM, GIS etc where the competition was largely restricted to MNC
players and ii) conventional T&D segment (conductors, insulator, substation, transformer, transmission line) has
witnessed ordering of INR72b, flat YoY.
During FY16 too, we expect project awards to be again dominated by such projects, including: i) Raigarh –
Poglur (~INR250b, +/-600kv, 6gw) HVDC project, and at ~2,500kms is one of the longest transmission networks
globally, ii) ~12-14 STATCOM ordering is expected by Dec 2015 (cost ~USD1.2b).
Make in India: a serious initiative; equipment manufacturers - the key beneficiary
WIN – Week In a Nutshell
11
Jan 16
th
2015

WEEK IN A NUTSHELL
WEEK IN A NUTSHELL
‘Make in India’ is a serious initiative of the government to improve the contribution of manufacturing in India
through ‘import substitution’ and ‘increased exports’. PWGR has stated that it is fully committed to this
initiative of the government and has made it mandatory for T&D players to manufacture certain components in
India for orders tendered out in key high-end technology products such as SVC/STATCOM, GIS, 765kv
transformers and reactors, HTLS conductors, OPGW and HVDC.
Over the last four years, 765kv AIS products have been largely indigenized, and the success is commendable,
given the first such attempt by PWGR to improve the share of domestic manufacturing. TBEA commissioned the
765kva transformer/reactor facility in end-CY13 and Toshiba T&D India has commenced construction for the
765kva range products (to be completed by mid-CY15).
Most players are also targeting the export market, and thus India is becoming a manufacturing hub for such
equipments. We believe that indigenizing GIS products is next on the agenda, with domestic manufacturing
clauses being introduced. Both Alstom T&D India and ABB India have commissioned factories in India, for
manufacturing up to 400kva GIS products.
2QFY15 revenue growth in positive territory, margins improve
Mid-cap power product companies have reported 22% YoY revenue increase (ttm, as at end-2QFY15); margins
have also improved from lows of ~1-1.1% ttm in 1HFY14 to 2.7% ttm in 2QFY15.
Margins had peaked at 17-18% in FY08/09 and thus the decline has been substantial, largely led by intense
pricing pressure and negative operating leverage. Segmental analysis for large cap companies indicate that ttm
revenue growth stood at 8% and ttm EBIT margin stabilizing at 6.6% (versus peak levels of 15% in FY08/09).
With product prices bottoming out and competitive environment becoming more disciplined, margins should
improve, in our view.
ABB, CRG, Alstom T&D best positioned
We believe that there are multiple levers at play, including increased share of high technology products and also
the need to correct under-investments in intra-state transmission/distribution segment.
MNC players, mainly Alstom T&D (Not Rated) and ABB India (Neutral) are best positioned to capture the upsides
from high-end products, given the continuous focus on indigenization. CRG (Buy) has been expanding its
presence in the chain, including 765kva Circuit Breakers, Substation Automation, GIS etc and also has a market
share of 18% in distribution segment in India.
WIN – Week In a Nutshell
12
Jan 16
th
2015

WEEK IN A NUTSHELL
WEEK IN A NUTSHELL
WIN Research Note highlights in Brief
Tata Motors: JLR Dec-14 wholesale grows 6.8% YoY (in-line); LR registers 7.5% growth, Jaguar clocks
3.1% growth YoY
Click here to access detailed report
JLR Dec-14 wholesales have grown by 6.8% YoY (+4% MoM) to 42,962 units (est. 42,604 units), driven primarily
by
Land Rover.
Land Rover
grew by 7.5% YoY to 36,146 units (est. 36,321 units), while
Jaguar
grew by 3.1% YoY to 6,816 units
(est. 6,282 units).
In terms of the regional retail sales performance released on Monday, UK volumes went up by 26% YoY, US
volumes by 3.6% YoY and Asia Pacific volumes were up by 11% YoY, while China de-grew by 1.2% YoY.
The stock trades at 8.9x/6.9x/5.9x FY15E/16E/17E consolidated EPS of INR58/75/88. Maintain
Buy
with a target
price of INR581 (FY16E SOTP-based) for ordinary shares and INR405 for DVR (~30% discount to the target price
for ordinary shares).
ECOSCOPE: CPI restrained at 5%; IIP rebounds to 3.8%; Expect RBI to cut rates in Feb-15 policy
Click here to access detailed report
CPI inflation remained lower than expectation at 5%, overcoming odds of an adverse base - the concerns of
which now appear overplayed.
Disinflationary impulse seen at WPI has now permeated to CPI too, with MoM inflation turning negative, on top
of remaining near zero since Sept-14.
Concerns of vegetable inflation stoking up too proved unfounded, with prices actually dropping, while the
adverse base leads to a marginal uptick in overall food inflation. All other components and core retail inflation
continued to decline. Rural inflation was much lower than urban.
CPI inflation in 4QFY15 is now unlikely to exceed 6%, which is the Jan-16 target of RBI and stay much below its
Jan-15 target of 8%.
IIP rebounded to 3.8% during Nov-14 after a decline of -4.2% in Oct-14. While this was ahead of expectations,
volatility in the series makes its interpretation difficult.
All sectors within IIP recorded positive growth, barring consumer non-durables.
YTD FY15 IIP recorded a moderate recovery of 2.2% v/s near no growth (0.1%) of YTD FY14.
With retail inflation set to over-achieve RBI’s target by at least 200bp and the yet prevailing fragile industrial
recovery, we expect RBI to initiate rate cuts in the coming Feb-15 policy review.
CEMENT: Cost moderation to drive up profitability; Volume-led price recovery still elusive, though
Click here to access detailed report
The sharp decline in prices of key input commodities – diesel and imported coal – is yet to reflect in cost savings
for cement players.
13
Jan 16
th
2015
WIN – Week In a Nutshell

WEEK IN A NUTSHELL
WEEK IN A NUTSHELL
If commodity prices remain at current levels, our FY16 cost estimates for our cement universe would be cut by
INR150-160/ton, and our EPS estimates would be upgraded by up to 48% for FY16 and up to 26% for FY17.
While freight cost would decline in similar proportion for all the players, companies with higher exposure to
imported coal – UltraTech, India Cements, Ramco Cement and Dalmia Bharat – would be the most sensitive
beneficiaries.
Demand recovery, slowing capacity addition, increasing consolidation and cost moderation augur well for
profitability of the sector.
STATE BANK OF INDIA: Favorable cycle ahead; primed for recovery; Core profitability + Asset quality +
Reforms = Strong re-rating
Click here to access detailed report
SBIN has emerged stronger from the downturn. It (a) has protected CASA ratio at 40%+, with SA market share
largely stable, (b) remains one of the best capitalized state-owned banks, with CET1 of ~10%, (c) has expanded
branch network by ~60% since 2008, and (d) has established strong presence across technological platforms like
RTGS, NEFT, mobile/internet banking, and payment solutions.
We expect RoE to improve from a cyclical low of 10.5% in FY14 to ~15% by FY17, led by healthy core PPP CAGR
of ~19% and ~20bp credit cost decline. Core PPP (as a percentage of assets) is likely to improve 30bp+.
Declining trend in quarterly fresh stress additions is encouraging (8.2% of loans (annualized) in 1QFY14 to 4.1%
in 2QFY15). As economic growth picks up and interest rates moderate, there could be upside to earnings
estimates, led by lower credit cost. A 10bp decline in credit cost would lead to RoA benefit of ~5bp.
SBIN’s 10-year average P/BV multiple is 1.3x. During the last up-cycle, the multiple got re-rated from ~0.7x in
2004 to 2x in 2008. The stock trades at 1.1x/8x FY17E consolidated BV/EPS. Our target price is INR400 (1.5x
FY17E consolidated BV + INR13 for Insurance).
WIN – Week In a Nutshell
14
Jan 16
th
2015

WEEK IN A NUTSHELL
WEEK IN A NUTSHELL
Larsen & Toubro: Drawing the line b/w likely surprises / disappointments; The Monitorable Troika
Click here to access detailed report
Initial momentum in domestic large project orders has not sustained, overseas intake remain muted
L&T’s 3QFY15 order announcements are meaningfully lower at just INR136b, vs INR223b in 1QFY15 / INR249b in
2QFY15. Key takeaways are:
In 3QFY15, the only large sized project win (INR15b+) was Western DFCC electrification (INR26b),
vs INR130b
of such project wins in 2QFY15. Thus, the initial momentum, post elections, has not sustained.
Domestic announcements stands at ~INR107b, contributing to ~80% of the total.
This compares with average
INR129b / qtr over last four quarters, and thus base orders have largely remained stable.
Overseas project announcements are meaningfully lower
at just ~INR29b, and are a continuation of the
constrained trend (actual awards in 2QFY15 at INR40b vs INR118b/qtr in previous four quarters). Importantly,
most of the wins are from traditional markets of Oman / UAE, new geographies of Saudi / Qatar, etc
(contributed to bulk of intake in FY14) have not done much.
Maintain Buy, Well positioned to benefit from economic recovery
L&T is exposed to several levers across business/geographic segments and has emerged as the E&C partner of
choice in India, which provides a robust foundation to capitalize on the next leg of investment cycle.
WIN – Week In a Nutshell
15
Jan 16
th
2015

WEEK IN A NUTSHELL
WEEK IN A NUTSHELL
INFOSYS 3QFY15: After dealing with margins, revenue growth getting addressed
Click here to access detailed report
Volume growth surprise, offset by realization decline: INFO’s 3QFY15 volume growth of 4.2% QoQ (v/s estimate
of 2.6% QoQ) in a seasonally weak quarter was a key positive. While we expect this to be an industry-leading
volume growth for 3QFY15, CC revenue growth was in line at 2.6% QoQ, as blended realization declined 160bp.
Reported USD revenue growth was 0.8% QoQ, v/s estimate of 1.2%, marginally lower on cross currency impact
of 180bp (v/s estimate of 160bp).
Marginal profit beat: EBITDA margin was 28.7% (+40bp QoQ), marginally above estimate of 28.3%, due to lower
SGA (11.9% v/s estimate of 12.3%) and currency (INR62.2/USD v/s estimate of 61.7). PAT was INR32.5b, +5%
QoQ, above estimate of INR31.5b, led by higher OPM and INR830m forex gain.
Revenue growth gets addressed: Midpoint of 4Q guidance suggests growth similar to 3Q. This would mean 2.6-
3.9% QoQ revenue growth band over 2Q-4QFY15E, up from -0.4% to +1.5% over 3QFY14-1QFY15. Large deal
TCV of USD230m was soft, as four to five deals marginally below USD50m were excluded.
Changes in estimates from currency MTM: Based on prevailing currencies, 4Q should see further 100bp+ impact
from relative strengthening of USD, driving 1% cut in our USD revenue estimate for FY16E/17E and 1-2% cut in
FY16E/17E EPS. Our estimates in constant currency are unchanged post in-line results and guidance.
Valuation and view: We believe INFO’s focus on ‘renew and new’ is the right approach and will equip the
company with capabilities for sustained profitable growth. We expect a gradual convergence in the valuation
gap versus TCS. Our target price of INR2,500 discounts FY17E EPS by 18x. Maintain Buy. We expect improved
capital allocation as one of the triggers to valuation gap convergence.
TECH MAHINDRA: Acquires Sofgen holdings Limited (SOFGEN); Access to BFSI customer base key
rationale; EPS-neutral
Click here to access detailed report
Acquires SOFGEN - Implementer of banking and wealth management software
TECHM signed an agreement to acquire100% stake in Sofgen holdings Ltd, a niche consulting and services
company specializing in Private Wealth, commercial and retail banking solutions. The consideration is USD30m,
one-third of which is in the form of earn-outs to be paid after two years.
Acquisition adds ~USD45m to FY16 revenues, single digit margin
Sofgen’s expected revenue this year is USD45m and has EBITDA margin in high single digits. The company has
grown its top line in mid single digits in the past couple of years. Sofgen revenues comprise of Temenos
WIN – Week In a Nutshell
16
Jan 16
th
2015

WEEK IN A NUTSHELL
WEEK IN A NUTSHELL
implementations (60%), Avaloq implementations (30%) and a tax compliance reporting platform (10%). Majority
of these implementations are in Middle East, Africa and Europe.
Rationale: Access to tier-I Banking and wealth management customers
The key rationale of the acquisition lies in the customer access facilitated to TECHM. Sofgen’s services have
been limited to platform migration and implementation of the solution at the customer site. The acquisition
enhances TECHM’s capability to offer more end to end services in the BFSI vertical which encompasses both
run-the-business and change the business propositions like Digital service transformations, IMS.
Our take: Long sought access to BFSI customers, but not yet in the US market
While the acquisition has negligible impact on TECHM’s financials, its lends access to some large BFSI accounts,
something that the company has been seeking for long. However, we see the transaction as only a small step
towards the larger goal of scaling BFSI segment – given that it still does not open up the lucrative scale of US
and large Europen banking clients for TECHM directly. It remains to be seen how much scale TECHM can derive
from providing additional services to banking and wealth management customers in other regions.
Valuation and view
The acquisition has 1% impact on top-line and negligible impact on TECHM’s earnings. We expect TECHM to
grow its USD revenue at a CAGR of 20.7% over FY15-17 and EPS at a CAGR of 21.9% during this period. At 15.5x
FY16E EPS, the stock is above its 5-year average, justifiably given the improvement in revenue growth and
margins, following merger with Satyam and increasing irrelevance of BT. Our Target Price of INR3,100 discounts
FY17E EPS by 15x, following expectation of sustained above-industry growth over the medium term. Maintain
Buy.
METALS WEEKLY: Indian iron ore prices fell for 2nd week on easing supply
Click here to access detailed report
India long product (TMT Mumbai) price were marginally lower, 0.3% WoW. Sponge iron prices rose 0.5% WoW
while domestic scarp prices were down 0.4% WoW. Pellet prices, after two consecutive weeks of decline, were
unchanged this week.
India import HRC prices were down 6% WoW, on aggressive offers by Chinese/CIS mills. INR appreciation of 2%
also impacted prices.
A few domestic iron ore miners further reduced lumps/fines prices by INR300-100/t WoW. This follows INR300-
400/t price cut last week.
Iron ore China cfr prices were unchanged WoW however risk is to the downside with the fall in China domestic
steel prices. Coking coal prices were down 2% WoW while thermal coal prices fell 4% WoW.
LME aluminum was down 1% WoW. US spot premiums were however up 1% WoW.
LME copper/zinc was down 2% WoW. Copper inventories rose 5% WoW.
China’s crude steel output, as reported by CISA members, during the last eleven days of December dropped
3.6% averaging 1.722 tpd. The decline was amid tepid outlook for the winter, uncertainties around export tax
rebate and weak domestic steel prices. China domestic rebar prices (in USD term) are at their multi-year low of
USD385/t.
YES BANK 3QFY15: Acceleration in key growth parameters; reports highest RoA of 1.8%; well capitalized
for the growth cycle
Click here to access detailed report
Strong customer assets growth (+9% QoQ and +23% YoY), 30bp YoY improvement in NIM (flat QoQ at 3.2%) and
strong fee income growth (+38% YoY) led to a healthy revenue growth of 37% YoY. Controlled C/I ratio (~40%)
and stable asset quality aided YES to report 30% YoY (in-line) growth in PAT. NII grew 36.6% YoY.
Loan book growth remains strong (+7% QoQ and 32% YoY). Post four quarters of decline, opportunities in bond
markets led to INR20b QoQ increase in credit substitute (+19% QoQ and -12% YoY) portfolio.
Strong sequential growth in SA deposits (+5% QoQ, +43% YoY), led to 10bp QoQ improvement in CASA ratio to
22.6%. Share of retail deposits has increased to 45.4% from 42.8% QoQ, and 42.1% YoY.
17
Jan 16
th
2015
WIN – Week In a Nutshell

WEEK IN A NUTSHELL
WEEK IN A NUTSHELL
Other highlights: (1) benefit of decline in cost of funds (-20bp QoQ) compensated by build-up of G-Sec
investments (negative carry of 25-50bp) to take care of LCR requirements under Basel III, (2) GNPAs witnessed
marginal uptick to 42bp (+6bp QoQ); NSL (36bp) remains one of the lowest in the industry, (3) CET 1 remains
comfortable at ~11.5% although capital consumption over the last few quarters increased sharply and (4) the
bank added 19/40 branches in 3Q/FYTD.
Valuation and view: With economic indicators turning positive, YES is better positioned with (1) strong
capitalization (CET 1 of ~11.5%), (2) higher branch presence (600 v/s 214 in FY11) and (3) best-in-class asset
quality. With the higher share of bulk liabilities and corporate investment portfolio, YES is likely to be a key
beneficiary of falling interest rate cycle. We expect return ratios to be strong, with RoA of 1.7%+ and RoE of
~20%+. Buy with a target price of INR935 (2.4x FY17E BV).
LIC HOUSING 3QFY15: Below estimate as spreads disappoint; Business growth remains strong, asset
quality improves
Click here to access detailed report
LIC Housing Finance’s (LICHF) 3QFY15 net profit grew 5% YoY at INR3.44b (6% below est. of INR3.66b). While
growth and asset quality remained healthy, lower-than-estimated spreads of 1.22% (est. 1.32%) led to below
estimate PAT growth.
Loan growth of 18% YoY (+4.5% QoQ) was largely in line; individual loan growth remained healthy at 18.5% YoY
and 4.4% QoQ to INR993b. While corporate loan disbursements picked up at INR4.5b, higher repayments led to
flat YoY growth and 7.5% sequential growth. Corporate loans share in overall loans stood at 2.53% v/s 2.46% a
quarter ago and 3% a year ago.
Net interest income grew 20% at INR5.5b (6% below est.). While spreads improved 8bp QoQ to 1.22%, it was
10bp below our estimate.
Asset quality remained healthy; GNPAs/NNPAs improved 24bp/20bp YoY and 10/11bp QoQ to 0.57%/0.31%.
Overall disbursements grew 24.5% YoY to INR76.3b. Individual disbursements growth improved to +23% YoY to
INR71.8b.
Valuation and view: Despite high interest rates and property prices, volume growth in the individual loan
segment remains healthy. Margin improvement and health of corporate loan portfolio continue to remain key
monitorables. We expect LICHF to report 17% PAT CAGR over FY14-17E. RoA and RoE are expected to be ~1.4%
and ~18%. Maintain Buy.
BAJAJ FINANCE 3QFY15: Above estimate: Strong AUM growth and NIM improves 200bps QoQ
Click here to access detailed report
Bajaj Finance PAT grew 33% to INR2.6b. Strong growth in high yielding consumer finance business (+15% QoQ
and +63% YoY) led to 200bp QoQ margin improvement to 12% (100bp beat vs expectation). Better-than-
expected festival demand, cross sell to existing customers and market share gains led to strong AUM growth
(5% above estimates) of +14% QoQ and +33% YoY.
Asset quality remained healthy, with GNPA/NNPA at 1.5/0.49% (stable QoQ). PCR also remained stable QoQ at
68%.
Other highlights: 1) consumer business continues to have a good run; BAF now ranks among the largest new
client acquirers in India, with 1.5m customer acquisitions in 3Q (3.8m in 9MFY15), 2) market share in consumer
durable lending increased to 18%, 3) lifestyle financing has become a separate business line, 4) builds e-
commerce strategy, will partner with leading e-commerce players and 5) mortgage business is in hyper
competitive mode, hence will consolidate; cautions on LAP.
Valuation and view: BAF continues to reap the benefits of healthy consumer demand and is among the few
companies doing well in this space. Company continues to increase its market share in consumer business,
though a higher share of incremental growth could be driven by the low yielding mortgage business, which
could exert pressure on margins. However, strong AUM growth and lower credit cost will mitigate the impact.
Maintain Buy with a target price of INR4,080 (3x FY17E BV of INR1,360).
NIIT TECHNOLOGIES 3QFY15: Operationally in line, growth lagged in focus regions
Click here to access detailed report
WIN – Week In a Nutshell
18
Jan 16
th
2015

WEEK IN A NUTSHELL
WEEK IN A NUTSHELL
Operationally in line:
NITEC’s 3QFY15 constant currency revenue growth (1% QoQ) and EBITDA margin (14.5%)
are in line with our estimates. But the in-line margin was after the revenue mix shift towards offshore by 2pp,
and hedge gains in revenue of INR99m versus our estimate of INR78m. PAT was at INR482m, +20% QoQ and -
9% YoY (below our est. of INR511m). PAT margin was in line (8.4%), but in absolute terms, lower PAT versus
estimate is explained by lower reported revenue.
Growth lagged in focus markets:
Growth was driven by RoW, while Americas grew marginally (weakness in
Insurance) and Europe declined (weakness in Travel and cross currencies). Government business more than
doubled on implementation of SAP for sales tax automation for Maharashtra, but the target is to keep the
segment at ~5% of total revenue (v/s 7% at present).
Deal signing proportion in EMEA soft:
LTM deal wins are USD480m versus LTM revenue (ex-hardware and forex
gains) of USD374m, implying a strong likelihood of growth recovery in FY16. However, only 21% of LTM
bookings are from EMEA, versus 35% of revenue, which also drives NITEC’s soft outlook for the region.
Valuation and view:
Our estimates are largely unchanged post results, with the exception of cross currency
adjustments. Lackluster revenue growth and profitability have kept valuation multiples well below peers.
Multiple levers to margins such as OPM in GIS and NITL businesses, utilization, decline in hardware revenue and
hedge gains in revenue have all played their part in the past couple of quarters, yet margin uptick has been
tepid. We maintain Neutral, with a target price of INR430, which discounts FY17E EPS by 10x.
AUM:
MAKES
NEW
HIGH
IN
DECEMBER;
UP
4%
QOQ
Click here to access detailed report
In December 2014, total average AUM of the mutual funds industry grew 4.4% QoQ to a life-time high of
INR11.1t. Equity AUM was at INR2.8t (up 1.6% MoM), accounting for 2.9% of India’s market capitalization.
Flows: Net inflows of INR490b; after two years of outflows
Mutual funds received net inflows of INR490b towards equity in CY14; against outflows recorded in past two
years.
Sector-wise weight: Financials, Cap. Goods, Consumer increase weight on MoM
Mutual funds showed positive interest in sectors like Financials, Capital Goods and Consumer, which saw an
increase in weight on MoM basis. Oil & Gas, Technology, Metals and Utilities saw a decrease in weight on MoM
basis. Private Banks remain the top sector holding at 15.2%, followed by Auto at 11.4% and Technology at
10.7%. Compared with the BSE-200, mutual funds are significantly overweight on Capital Goods and
underweight on Consumer.
Sectoral allocation of funds: Consumer, Utilities, Technology under-owned
Top sectors where ownership of mutual funds vis-à-vis BSE-200 is at least 1% lower: Consumer (20 funds under-
own), Utilities (17 funds under-own) and Technology (16 funds under-own).
Top sectors where ownership of mutual funds vis-à-vis BSE-200 is at least 1% higher: Capital Goods (16 funds
over-own), Autos (12 funds over-own), Cement (12 funds over-own) and Private Banks (9 funds over-own).
Nifty-50 snapshot: MFs have been net buyers in 30 stocks
The highest net buying on MoM basis has been in HUL (+60%), NTPC (+42%), BHEL (+25%) and Cairn India
(+25%).
METALS / CEMENT: MMDRA ordinance to clear impasse; Mines to be auctioned; no retrospective
implications
Click here to access detailed report
The President of India has cleared amendments to the Mines and Minerals (Development and Regulation) Act
(MMDRA) through the ordinance route.
The ordinance provides for compulsory auctioning of mineral resources, with no retrospective implications for
existing miners.
While captive mine holders will have right of first refusal when these mines come for auction, the royalty-linked
payments will increase for all mines.
We await clarity on the specific terms and conditions for selection and the bidding methodology.
WIN – Week In a Nutshell
19
Jan 16
th
2015

WEEK IN A NUTSHELL
WEEK IN A NUTSHELL
ECOSCOPE: WPI hovers around zero; Disinflationary trend persists, expect RBI to cut rates in Feb-15
Click here to access detailed report
Dec-14 WPI inflation remained near zero at 0.1%.
Both the YoY and MoM inflation mimicked the crisis period pattern and comprehensively ameliorates the
concerns of inflation rising, once the favorable base effect wanes.
There was a broad-based decline in prices of all major components, including primary, fuel group and
manufacturing as vetted by the index level data.
All pressure points of inflation in the past -- food, vegetables, protein, fuel group etc have disappeared.
Core group inflation plummeted to a five-year low of 1.5%. Moreover, inflation eased MoM for 15 of the 17
categories of manufacturing inflation.
We are likely to see negative wholesale inflation from Mar-15 onwards if the current global commodity trend
persists.
INDIA POLITICS: A walk down 'ordinance' lane; Ten effected under NDA-2; expect more
Click here to access detailed report
The government has indicated serious intent to push reforms by issuing six ordinances within a 20-day span
following the impasse in the Rajya Sabha during the winter session. The most recent one included the ordinance
paving way for auctioning of major minerals (iron ore, bauxite, limestone and manganese ore). This takes the
total number of ordinances issued by NDA-2 to 10.
The government has clearly indicated that it will not allow Parliament to be an impediment for the reforms
process.
Empirical evidence suggests that ordinances are not new to India – 644 ordinances have been issued over 1952-
2014 (average of 10 ordinances per year). Further, judicial pronouncements have proved that actions under
any ordinance stay valid.
In our note, we analyze four different scenarios (Best, Bad, Worse, Worst) under which these ordinances can
become Acts.
We also understand the various nuances with respect to joint session of Parliament, which can be used by the
government as the last resort. However, it is noteworthy that Money Bills and Constitutional Amendment Bills
(GST Bill is pending in Lok Sabha) cannot be placed through the medium of joint session.
Historically, the joint session route has been opted only thrice – in 1961, 1978 and 2002. If a joint session were
to be held, the NDA would be able to have any bill passed, given the higher number of members in Lok Sabha.
FINANCIALS: Rate cut cycle initiated; Lending / deposit rate cuts begin; Bulk borrowers and corporate
lenders to benefit
Click here to access detailed report
Event:
The Reserve Bank of India (RBI) has cut the benchmark repo rate after almost 20 months. A rate cut was
widely anticipated post the continued decline in CPI and WPI over the last six months, on the back of a sharp
correction in global commodity prices (especially crude oil) and decline in vegetable and fruit prices. RBI’s
household consumer price survey has also suggested a decline in inflationary expectation to single digit, the first
time since Sept-09.
Our house view:
Our economist believes that room for further cuts already exists with CPI inflation for Mar-15
likely to over-achieve the revised estimate and Jan-16 target of 6%. Further, headroom for rate cuts to be
created by persistence of disinflationary trend and government maintaining its fiscal goals despite challenges.
Only external sector considerations, such as a sharp fall in emerging market currencies, may result in a pause
but is unlikely to cause any reversal in the easing cycle itself. Hence, he believes RBI is likely to cut rates by a
cumulative 150bp in CY15.
Implications for Financials: banks to cut lending rates soon – bulk borrowers/ corporate lenders likely to be key
beneficiaries
In the near term, banks with higher AFS portfolio (refer
to our note dated 5 January 2015)
and bulk funded
ones (most mid-sized PSU banks, YES, IIB) and NBFCs (especially with strong pricing power like SHTF, MMFS, BAF
etc) are likely to be the key beneficiaries. Our top picks are SBIN, PNB, UNBK, AXSB, YES and SHTF.
WIN – Week In a Nutshell
20
Jan 16
th
2015

WEEK IN A NUTSHELL
WEEK IN A NUTSHELL
ECOSCOPE: Exports, imports, total trade, deficit all fall; Commodities meltdown resulting in lower
exports and imports
Click here to access detailed report
During Dec-14 exports showed a degrowth of 4% to its lowest monthly value of USD25b in FY15. Imports too
declined by 5% to the lowest monthly value of FY15 so far at USD35b. Overall trade declined while trade deficit
at USD9b too was lowest in 10 months.
The impact of falling commodity prices was apparent in both exports and imports with oil bill reducing by 30%.
Gold imports normalized to USD1.3b from the spike of USD5.6b during Nov-14.
YTDFY15 was somewhat better with trade deficit at 5.2% of GDP vs. 5.7% of GDP during YTDFY14. Overall trade
registered moderate growth of 3.8%.
See FY15 trade deficit largely unchanged from FY14 at 7.4%. However, unevenness in capital flow would create
a bias for depreciation of INR. We expect RBI to mediate through the process of depreciation to take it closer to
its par value as measured by REER indicators.
HEALTHCARE: Indian pharma market – Monthly performance tracker; Sustained growth recovery,
expect momentum to pick up
Click here to access detailed report
IPM Dec 2014 growth was at 13.6%, 3QFY15 growth at 10.3%
IPM grew 13.6% YoY to INR74b for December, higher than the 11% YoY and 6% YoY growth registered in
November and October respectively.
3QFY15 growth was in double digit for the second consecutive quarter at 10.3% YoY (12.8% YoY in 2QFY15),
reflecting the continued recovery in India pharma market, aided by price hikes undertaken on NLEM drugs and a
favorable base effect (6.8% YoY in 3QFY14).
Overall on MAT (Moving Annual Total) basis, IPM growth was at 10.2% YoY (INR830b).
3QFY15: Company-wise performance
Ranbaxy posted the highest growth at 21.2% YoY in our coverage, attributed to the price hikes taken in NLEM
brands.
Sun Pharma (15.3% YoY) and Glenmark (14.8% YoY) also grew in double digits, supported by a high volume
growth (9% YoY) during the quarter.
Torrent Pharma (19.7% YoY) also grew in excess of 15%, with a price hike taken in key Elder brands – Shelcal
and Chymoral (10% price hike).
DPCO v/s non DPCO market (Dec 2014)
DPCO listed products grew at 8% YoY, while non DPCO products registered 14.8% YoY growth in December.
DPCO and non DPCO category showed unit growth at 0.7% and 3.2% respectively.
The DPCO 2013 portfolio for Pfizer grew at 13.9% YoY, GSK 1.7% and Ranbaxy 41.9% for December.
FEDERAL BANK 3QFY15: Core performance disappoints; trading gains drive earnings; cut est by 2-3%
Click here to access detailed report
Federal Bank’s (FB) PAT grew 15% YoY to INR2.4b (8% beat), mainly led by net trading gains of INR1.36b (50% of
PBT). NIM decline of 15bp QoQ (adjusted, stable QoQ) and moderate loan growth (+15% YoY and flat QoQ,
expectation of +4% QoQ) led to NII miss of 5% (+8% YoY and -3% QoQ).
Gross slippages increased QoQ to INR2.3b (2.25% annualized) from INR1.8b a quarter ago, led by a large
corporate account of INR1.2b (Iron & Steel). FB restructured loans of INR400m in 3Q. OSRL stood at ~INR24.3b
(5.1% of loans).
Other highlights: (1) reported NIM declined 15bp QoQ to 3.2%. However, adjusted for IT refund of INR270m in
2QFY15, NIM was stable QoQ, (2) fee income was flat YoY and down 10% QoQ to INR1.2b, (3) growth in SME
segment, key driver of growth over the last eight quarters (32% CAGR), moderated to 18% YoY in 3QFY15, (4)
retail deposits proportion was healthy at 95.5% (flat QoQ), (5) FB did not sell any assets to ARCs in 3QFY15 and
(6) healthy CET 1 of ~15%.
21
Jan 16
th
2015
WIN – Week In a Nutshell

WEEK IN A NUTSHELL
WEEK IN A NUTSHELL
Earnings revision: Lower-than-expected growth and margins led to 5% cut in NII estimates though healthy net
trading gains compensate for the same. Overall, we revise the earnings estimate marginally by 2-3% over FY15E-
17E.
Valuation and view: Structural improvement in liability profile (reduction in bulk deposits and strong traction in
CASA) and improvement in loan growth will provide cushion to NIM. With the improving growth outlook and
strong capacity built during the downturn, we expect operating leverage (in terms of productivity) to accrue
over FY15/17. This coupled with strong PCR of 85% limits downside risk to our earnings estimate. Maintain Buy
with a Residual Growth Model-based target price of INR175 (1.6x/11.5x FY17E BV/EPS).
D B CORP 3QFY15: Newsprint price supportive; ad re-bound awaited
Click here to access detailed report
PAT miss led by sluggish ad growth: PAT grew 11% YoY to INR1.05b. EBITDA and PAT were 6-8% below our
estimates, led by sluggish ad growth.
Advertising rebound yet to come through: Print ad revenue grew 5% YoY to INR3.93b (our estimate: INR4.05b).
Soft consumer demand and high base of FY14 (election impact) has kept DBCL’s print ad growth in the 5-7%
band during 9MFY15.
Circulation growth remains robust, cushioning earnings impact: Circulation revenue grew 17% YoY to INR0.97b,
led by higher cover prices. Average circulation improved ~4% to 5.07m copies. DBCL has maintained 14%+
circulation revenue growth for last 13 quarters now.
EBITDA margin expansion supported by decline in RM and SGA expenses: EBITDA grew 19% YoY to INR1.85b
(our estimate: INR1.96b). Margin expanded 340bp YoY to 33.3% on lower RM costs and other expenses. RM
cost declined 2% YoY to INR1.69b on YoY deflation in newsprint prices (5% YoY decline to INR35.3/kg). Emerging
editions achieved positive EBITDA margin of ~7% versus EBITDA loss in preceding quarters, aided by festive
season and likely benefit from elections in Maharashtra/ Jharkhand.
Valuation and view: DBCL is well-positioned to benefit from (1) rebound in economic growth, (2) increased
advertising/branding investments from consumer companies benefiting from lower RM prices, and (3) declining
newsprint prices including freight costs for international newsprint. We are cutting FY16/17E EPS by 1-2% as we
tweak our ad revenue numbers lower. The stock trades at 17.3x FY16E and 14.6x FY17E EPS. We maintain Buy
with a revised price target of INR490 (18x FY17E EPS, in line with DBCL’s average multiple since listing).
WIN – Week In a Nutshell
22
Jan 16
th
2015

WEEK IN A NUTSHELL
WEEK IN A NUTSHELL
WIN-sight of the Week
The fall in the price of oil and gas provides a once-in-a-generation opportunity to fix bad energy policies
MOST of the time, economic policymaking is about tinkering at the edges. Politicians argue furiously about modest
changes to taxes or spending. Once in a while, however, momentous shifts are possible. From Deng Xiaoping’s
market opening in 1978 to Poland’s adoption of “shock therapy” in 1990, bold politicians have seized propitious
circumstances to push through reforms that transformed their countries. Such a once-in-a-generation opportunity
exists today.
The plunging price of oil, coupled with advances in clean energy and conservation, offers politicians around the
world the chance to rationalise energy policy. They can get rid of billions of dollars of distorting subsidies, especially
for dirty fuels, whilst shifting taxes towards carbon use. A cheaper, greener and more reliable energy future could
be within reach.
The most obvious reason for optimism is the plunge in energy costs. Not only has the price of oil halved in the past
six months, but natural gas is the cheapest it has been in a decade, bar a few panicked months after Lehman
Brothers collapsed, when the world economy appeared to be imploding. There are growing signs that low prices are
here to stay: the rising chatter of megamergers in the oil industry (see article) is a sure sign that oilmen are bracing
for a shake-out. Less noticed, the price of cleaner forms of energy is also falling, as our special report this week
explains. And new technology is allowing better management of the consumption of energy, especially electricity.
That should help cut waste and thus lower costs still further. For decades the big question about energy was
whether the world could produce enough of it, in any form and at any cost. Now, suddenly, the challenge should be
one of managing abundance.
Clean up a dirty business
That abundance provides the potential for reform. Far too many economies are littered with the detritus of daft
energy policies, based on fears about supply. Even though fracking has boosted America’s oil output by two-thirds
in just four years, the country still bans the export of oil and restricts exports of natural gas, a legacy of the oil
shocks of the 1970s—and a boondoggle for American refiners and petrochemical firms. Congress also keeps
handing out money to Iowa’s already coddled corn farmers to produce ethanol and has not reviewed generous
subsidies for nuclear power despite the Fukushima disaster and ruinous cost over-runs at new Western plants.
Instead, it has spent four long years bickering about whether to allow the proposed Keystone XL pipeline to
Canada’s tar sands. In Europe the giveaways are a little different—billions have gone to wind and solar projects—
but the same madness often prevails: Germany’s rushed exit from nuclear power ended up helping boost American
coal and Russian gas.
The most straightforward piece of reform, pretty much everywhere, is simply to remove all the subsidies for
producing or consuming fossil fuels. Last year governments around the world threw $550 billion down that
rathole—on everything from holding down the price of petrol in poor countries to encouraging companies to search
for oil. By one count, such handouts led to extra consumption that was responsible for 36% of global carbon
emissions in 1980-2010.
Falling prices provide an opportunity to rethink this nonsense. Cash-strapped developing countries such as India and
Indonesia have bravely begun to cut fuel subsidies, freeing up money to spend on hospitals and schools (see article).
But the big oil exporters in the poor world, which tend to be the most egregious subsidisers of domestic fuel prices,
have not followed their lead. Venezuela is close to default, yet petrol still costs a few cents a litre in Caracas. And
rich countries still underwrite the production of oil and gas. Why should American taxpayers pay for Exxon to find
hydrocarbons? All these subsidies should be binned.
What a better policy would look like
That should be just the beginning. Politicians, for the most part, have refused to raise taxes on fossil fuels in recent
years, on the grounds that making driving or heating homes more expensive would not only annoy voters but also
hurt the economy. With petrol and natural gas getting cheaper by the day, that excuse has gone. Higher taxes
WIN – Week In a Nutshell
23
Jan 16
th
2015

WEEK IN A NUTSHELL
WEEK IN A NUTSHELL
would encourage conservation, dampen future price swings and provide a more sensible way for governments to
raise money.
An obvious starting point is to target petrol. America’s federal government levies a tax of just 18 cents a gallon (five
cents a litre)—a figure that it has not dared change since 1993. Even better would be a tax on carbon. Burning fossil
fuels harms the health of both the planet and its inhabitants. Taxing carbon would nudge energy firms and
consumers towards using cleaner fuels. As fuel prices fall, a carbon tax is becoming less politically daunting.
That points to the biggest blessing cheaper energy brings: the chance to inject some coherence into the world’s
energy policies. Governments have a legitimate role in making sure that energy is abundant, clean and secure. But
they need to learn the difference between picking goals and deciding how to reach them. Broad incentives are fine;
second-guessing scientists and investors is not. A carbon tax, in other words, is a much better way to reduce
emissions of greenhouse gases than subsidies for windmills and nuclear plants.
By the same token, in the name of security of supply, governments should be encouraging the growth of seamless
global energy markets. Scrapping unfair obstacles to energy investments is just as important as dispensing with
subsidies. The more cross-border pipelines and power cables the better. America should approve Keystone XL and
lift its export restrictions, while European politicians should make it much easier to exploit the oil and gas in the
shale beneath their feet.
This ambitious to-do list will drive regiments of energy lobbyists potty. But for the first time in years it is within the
realm of the politically possible. And it would plainly lead to a more efficient and greener energy future. So our
message to politicians is a simple one. Seize the day.
WIN – Week In a Nutshell
24
Jan 16
th
2015

WEEK IN A NUTSHELL
WEEK IN A NUTSHELL
Nifty Valuations at a glance
WIN – Week In a Nutshell
25
Jan 16
th
2015