19 January 2015
3QFY15 Results Update | Sector:
Metals
Hindustan Zinc
BSE SENSEX
28,262
Bloomberg
Equity Shares (m)
52-Week Range (INR)
1, 6, 12 Rel. Per (%)
Free float (%)
S&P CNX
8,551
HZ IN
4,225.3
184/115
-6/-13/-10
35.1
CMP: INR160
TP: INR215 (+34%)
Buy
In-line: higher other income offsets sales volume miss
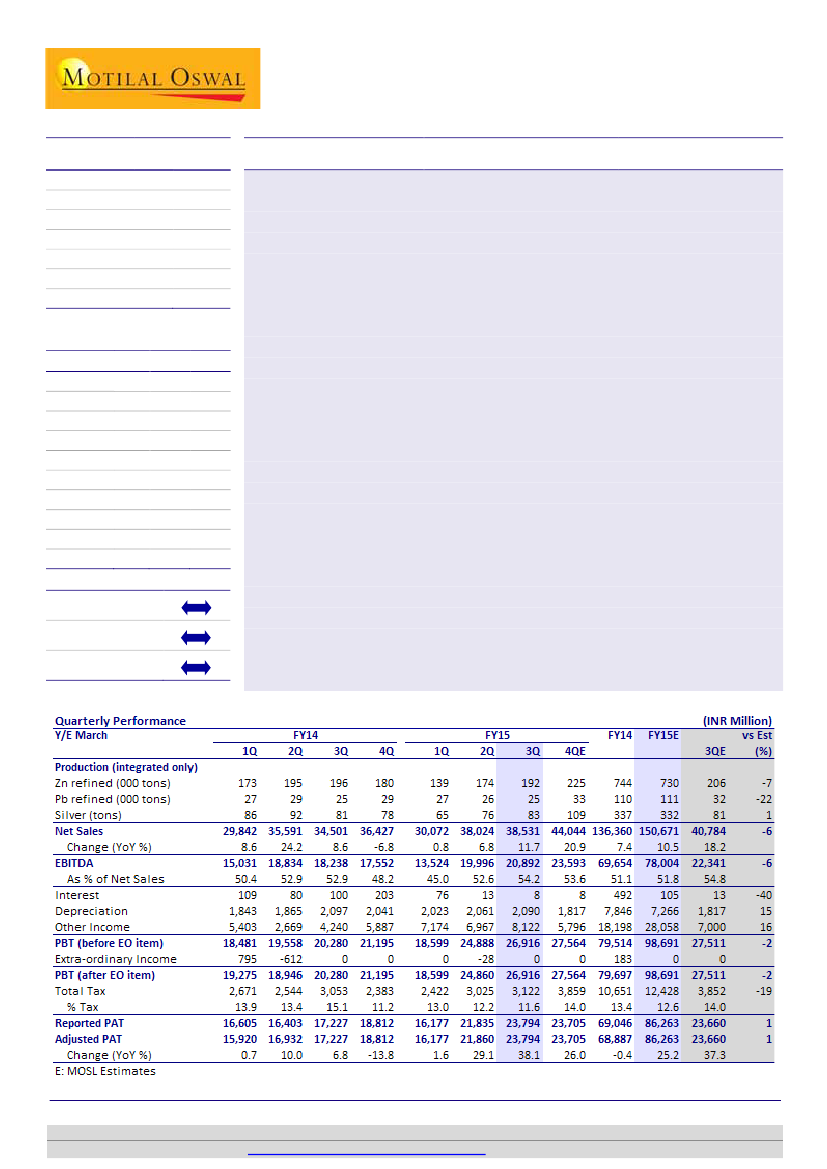
HZL’s (HZ) 3QFY15 PAT of INR23.8b (9% QoQ / 38% YoY) was marginally ahead of our
estimate as a higher-than-expected other income offset the impact of lower sales
volume. EBITDA of INR20.9b (4% QoQ/15% YoY) was a 6% miss on lower volumes and
zinc premium and was offset by slightly lower cost of production (CoP). Volume miss
was on account of higher cathode stocks, as mine production at 242kt was broadly in-
line with our estimate. Key result highlights:
n
Net sales grew 1% QoQ / 12% YoY to INR38.5b (6% miss to our estimate). Implied
zinc premium in 3Q was at 11.7%, below 12% in 2Q/14.7% in 3QFY14, as
increasing Chinese exports improved metal availability. Zinc metal production was
flat QoQ (+8% YoY) at 196kt despite the mine production rising 10% QoQ (14%
YoY) to 242kt. Lead production rose 20% QoQ (flat YoY) at 30kt.
n
Reported CoP (ex-royalty) declined 3% QoQ (-8% YoY) to INR50,534/t (lower than
our estimate) on better fixed cost absorption and lower diesel cost. Employee cost
was higher due to one-off wage renegotiation related charges and is expected to
reverse in the coming quarters.
n
Other income was at INR8.1b (92% QoQ / 17% YoY) on mark-to-market treasury
gains. Cash and cash equivalents closed at INR290b.
n
Royalty-linked charge, on recent amendments to MMDRA Act, is likely to increase,
but rules are yet to be framed. We await further clarity to factor the impact.
Valuation and view:
We lower FY15E-17E EBITDA forecast by 2-4% factoring the 3Q
result. Our 12-month target price stands reduced to INR215. Although metal sales
volumes surprised negatively in 3Q, mining ramp-up was in line with our estimate.
HZ’s mine production is estimated to post 3% CAGR over FY14-17E to 952kt
(management targets capacity of 1.2 mt). Maintain
Buy.
M.Cap. (INR b) / (USD b) 677.7/11.0
Avg Val(INRm)/Vol ‘000 256/1,666
Financials & Valuation (INR Billion)
Y/E MAR
Sales
EBITDA
NP
Adj.EPS(INR)
EPS Gr(%)
RoE (%)
RoCE (%)
P/E (x)
P/BV
EV/EBITDA(x)
2015E 2016E 2017E
150.7 157.3 161.0
78.0
86.3
20.4
25.2
20.9
23.0
7.8
1.5
4.5
81.1
79.5
18.8
-7.9
16.5
19.7
8.5
1.3
3.6
81.4
81.9
19.4
3.1
15.0
18.0
8.3
1.2
2.9
Estimate change
TP change
Rating change
Sanjay Jain
(SanjayJain@MotilalOswal.com); +91 22 3982 5412
Dhruv Muchhal
(Dhruv.Muchhal@MotilalOswal.com); +91 22 3027 8033
Investors are advised to refer through disclosures made at the end of the Research Report.
Motilal Oswal research is available on
www.motilaloswal.com/Institutional-Equities,
Bloomberg, Thomson Reuters, Factset and S&P Capital.

Hindustan Zinc
3QFY15 results highlights
Mine production up 14% QoQ / 10 % YoY to 242 kt
n
n
n
n
n
n
Net sales grew 1% QoQ (12% YoY) to INR38.0b driven by higher zinc and lead
revenues offset partly by weaker silver revenues QoQ.
Zinc metal sales grew 7% QoQ (-2% YoY) to 193.4 kt. Lead sales rose 1% QoQ
(21% YoY) to 30.2 kt. Zinc and lead realization were 1%/6% lower QoQ. Silver
volumes although 6% higher QoQ to 84.7 kt, realization at INR33.4/t was 15%
lower QoQ.
Mine production grew 14% QoQ (10% YoY) to 242kt.
Cost of production (ex-royalty), as reported, fell 8% QoQ (3% YoY) to
INR50,534/t. The decline was driven by higher metal production leading to
better fixed cost absorption and decline in diesel cost. Diesel cost is likely to
decline further due to the sharp correction in crude oil prices in the recent
weeks. Employee cost, adjusted for INR250m related one-off in 2Q, grew by 7%
due to contractors wage re-negotiation related one-off.
EBITDA at INR 20.9b grew 4% QoQ (15% YoY) driven by cost efficiencies.
PAT at INR23.8b grew 9% QoQ (38% YoY) primarily driven by surge in other
income. Other income at INR8.0b was 17% higher QoQ / 92% YoY.
Exhibit 1: Quarterly mine production (kt)
223
187
233
190
260
238
222
220
213
163
242
210
209
200
Source: Company, MOSL
Exhibit 2: Integrated metal production (kt)
240
210
180
150
120
Refined Zinc
Refined Lead
Silver (RHS)
120
95
70
45
20
Source: Company, MOSL
19 January 2015
2

Hindustan Zinc
Exhibit 3: Integrated metal production (INR/t)
200,000
160,000
120,000
80,000
40,000
0
Refined Zinc
Refined Lead
Silver (RHS)
60,000
50,000
40,000
30,000
20,000
Source: Company, MOSL
Exhibit 4: Cost of production ex-royalty (INR’ 000/t)
39
40
42
46
47
45
45
47
51
52
55
60
55
51
Source: Company, MOSL
Exhibit 5: HZL quarterly performance
Source: MOSL, Company
19 January 2015
3

Hindustan Zinc
Valuation and views
TP: INR215, upside 34%; maintain Buy
Implication from results
We factor in the impact of royalty rate increase in 2Q resulting in our FY15-17E
EBITDA cut by 2%-4%. Our volumes and realization estimates remain unchanged.
Our 12m TP stands revised lower to INR215 from INR220 earlier, on impact of
change in royalty charge.
Pursuant to the issue of ordinance amending the MMDRA Act, royalty-linked
payment for mining is likely to increase. However, due to lack of clarity we have not
factored in the impact.
Outlook and view
Hindustan Zinc would benefit from production ramp-up at Rampua-Agucha as it
shifts from open-cast to under-ground mining. We expect mine production at HZL to
increase by 3% CAGR over FY14-17E to 952 kt. The company plans to increase
mining capacity to 1.2mt, given its healthy reserves and successful exploration
programs over the years.
Strong operational performance will be supported by recovery in global zinc prices.
Zinc market globally is expected to turn into a deficit from 2014, after more than 6
years of over-supply, as older mines are coming to an end of their life. About 900 kt
of production is expected to be closed over 2015-16. With zinc demand expected to
remain healthy, slowing supply growth will aid prices, in our view.
HZL is trading attractively at 3.6x FY16E EV/EBITDA. We value HZL at 6.5x FY16E
EV/EBITDA with a 12 month target price of INR215.
Key catalysts over the next 12 months
n
n
Production ramp-up at Rampua-Agucha
Recovery in LME zinc as demand-supply gap widens
Key risks
n
n
n
Significantly higher royalty-linked charge on account of amendment to MMDRA
Act
Increasing exports by China driving zinc premiums lower.
Fall in LME zinc
Exhibit 6: Target price derivation
Y/E March
EBITDA
Multiple (x)
EV
Net Debt
Equity Value
Target Price (INR)
2014
69,654
6.5
452,752
-255,378
708,130
168
2015E
78,004
6.5
507,028
-324,214
831,242
197
2016E
2017E
81,063
81,369
6.5
6.5
526,912
528,896
-380,368
-439,677
907,281
968,572
215
229
Source: MOSL, Company
4
19 January 2015

Hindustan Zinc
Exhibit 7: HZL 1yr fwd PE
16
12
8.2
8
6.7
4
0
7.3
7.8
P/E (x)
5 Yrs Avg(x)
15 Yrs Avg(x)
10 Yrs Avg(x)
Exhibit 8: HZL 1yr fwd EV/EBITDA
9.0
EV/EBDITA(x)
Median(x)
Peak(x)
Min(x)
Avg(x)
7.7
6.0
3.7
4.2
3.0
3.6
0.3
0.0
Source: MOSL, Company
Exhibit 9: Metal sector valuation
Rating
Steel
Tata Steel
SAIL
JSW Steel
JSPL
NMDC
Non-Ferrous
Hindalco
SSLT
Hindustan Zinc
Nalco
Buy
Neutral
Buy
Neutral
Buy
Buy
Buy
Buy
Buy
Price
(INR)
383
77
979
151
135
157
193
157
47
MCAP
(USD M) FY14E
5,993
4,130
3,812
2,225
8,622
4,590
9,218
10,686
1,951
35.5
4.6
34.4
20.9
16.1
12.5
17.2
16.3
2.6
EPS
FY15E
25.6
6.3
103.8
13.0
17.2
13.7
20.6
20.3
5.6
FY16E
56.0
5.6
100.0
11.3
14.5
15.1
19.5
19.4
6.8
P/E (x)
FY15E FY16E
14.9
12.1
9.4
11.6
7.9
10.1
9.4
7.7
8.5
6.8
13.8
9.8
13.4
9.3
9.2
9.9
8.1
6.9
EV/EBITDA (x)
FY15E FY16E
7.1
9.2
6.4
8.9
4.2
7.8
6.1
4.3
2.9
6.0
8.2
6.4
8.7
5.2
P/B(x)
FY14 FY15E
1.5
0.7
1.0
0.6
1.8
1.2
0.7
0.9
0.7
1.6
6.6
1.2
1.1
5.5
0.8
0.7
3.3
1.5
1.3
1.8
0.9
0.8
Source: MOSL, Company
19 January 2015
5

Hindustan Zinc
Story in charts
Exhibit 10: Metal production to ramp-up
1,000
800
600
400
200
0
FY09 FY10 FY11 FY12 FY13 FY14 FY15E FY16E FY17E
60
Refined Zinc (kt)
Silver (tons)
59
64
96
Refined Lead (kt)
122
124
134
135
1,965
1,604
686
1,186
1,274 1,121
2,210
Exhibit 11: Driving EBITDA growth
EBITDA
2,115
1,970 1,934
867
1,007
Blended Zn/Ld realization
2,187 2,185 2,186
1,195 1,168 1,133
119
Source: Company, MOSL
Exhibit 12: CoP now close to peaks
CoP ex-royalty (INR/kt)
44.9
47.4
51.3
50.8
52.9
Exhibit 13: RoE to decline; Cash surplus to increase
30
25
20
15
10
5
25
Net Cash Surplus (RHS)
24
23
23
20
21
17
15
RoE
480
400
320
240
160
80
0
FY10 FY11 FY12 FY13 FY14 FY15E FY16E FY17E
31.1
28.3
35.1
38.5
FY09 FY10 FY11 FY12 FY13 FY14 FY15E FY16E FY17E
0
Source: Company, MOSL
Exhibit 14: Zinc demand and supply balance
(000 tons)
Mine Production
yoy change (%)
Metal production
yoy change (%)
Metal Consumption
yoy change (%)
Metal surplus (deficit)
LME(3M) average US$/ton
2002
2003
2004
9,735
2.3
10,396
4.9
10,651
8.2
-255
1,064
2005
10,146
4.2
10,221
-1.7
10,609
-0.4
-388
1,393
2006
10,431
2.8
10,629
4.0
11,000
3.7
-371
3,248
2007
11,128
6.7
11,345
6.7
11,276
2.5
69
3,249
2008
11,881
6.8
11,774
3.8
11,574
2.6
200
1,901
2009
11,601
-2.4
11,280
-4.2
10,914
-5.7
366
1,689
2010
12,354
6.5
12,896
14.3
12,649
15.9
247
2,185
2011
12,644
2.3
13,074
1.4
12,699
0.4
375
2,200
2012
13,130
3.8
12,630
-3.4
12,386
-2.5
244
1,946
2013 2014E
2015E
6,465 9,520
47.3
6,669 9,913
48.6
7,118 9,841
38.3
-449
72
797
844
13,201 13,330 13,800
0.5
1.0
3.6
12,891 13,250 13,680
2.1
2.9
3.3
12,985 13,650 14,050
4.9
5.1
2.9
-94 -400
-370
1,909
Source: MOSL, ILZSG
19 January 2015
6

Hindustan Zinc
Corporate profile
Company description
Hindustan Zinc (Bloomberg: HZ) is a fully integrated
zinc producer, with one of the best mining assets in
the world. It has steadily increased its reserves and
production through regular investment in
exploration activities and addition of smelting
capacity. HZ's captive mines of zinc and lead ore
are located in the state of Rajasthan, with total
R&R of 365.1mt as at March 2014, containing
~35.2mt zinc-lead metal & 28,804tonne silver. Its
captive mines and thermal power plants give the
company significant cost advantage, making it one
of the lowest cost producers of zinc in the world.
SSLT has 64.9% stake in HZ, while 29.5% is owned
by the Government of India.
Exhibit 15: Sensex rebased
200
175
150
125
100
Jan-14
Apr-14
Jul-14
Oct-14
Jan-15
Hind.Zinc
Sensex - Rebased
Exhibit 16: Shareholding pattern (%)
Dec-14
Promoter
DII
FII
Others
64.9
31.0
2.3
1.8
Sep-14
64.9
31.0
2.2
1.9
Dec-13
64.9
31.4
2.0
1.7
Exhibit 17: Top holders
Holder Name
The President of India
%
Holding
29.5
Note: FII Includes depository receipts
Exhibit 18: Top management
Name
Agnivesh Agarwal
M S Mehta
Akhilesh Joshi
R K Malhotra
Amitabh Gupta
R Pandwal
CEO
CEO & WTD
Director
CFO
CS
Designation
Chairman
Exhibit 19: Directors
Name
Agnivesh Agarwal
M S Mehta
Akhilesh Joshi
R K Malhotra
Navin Agarwal
Name
A.R.Narayanaswamy*
Rajib Sekhar Sahoo*
Shaukat Ara Tirmizi*
Durga Shanker Mishra*
Sujata Prasad*
*Independent
Exhibit 20: Auditors
Name
Deloitte Haskins & Sells LLP
Type
Statutory
Exhibit 21: MOSL forecast v/s consensus
EPS (INR)
FY15
FY16
FY17
MOSL forecast
20.4
18.8
19.4
Consensus
forecast
18.2
19.6
20.7
Variation (%)
11.9
-3.9
-6.5
19 January 2015
7

Hindustan Zinc
Financials and valuations
Income Statement
Y/E March
Net Sales
Change (%)
Total Expenses
EBITDA
% of Net Sales
Depn. & Amortization
EBIT
Net Interest
Other Income
PBT before EO
EO Income
PBT after EO
Current tax
Deffered tax
Tax
Rate (%)
Reported PAT
Adjusted PAT
Change (%)
2010
80,170
41.1
33,469
46,701
58.3
3,343
43,358
439
7,222
50,141
50,141
8,309
1,418
9,727
19.4
40,414
40,414
48.2
2011
99,121
23.6
44,165
54,956
55.4
4,747
50,209
194
9,792
59,807
-212
59,596
8,255
2,336
10,591
18
49,005
49,179
21.7
2012
114,053
15.1
53,359
60,695
53.2
6,107
54,588
140
15,428
69,877
-431
69,445
12,547
1,638
14,185
20
55,260
55,604
13.1
2013
126,998
11.4
62,182
64,816
51.0
6,470
58,346
291
20,322
78,377
-175
78,201
7,551
1,656
9,206
12
68,995
69,149
24.4
2014
136,360
7.4
66,706
69,654
51.1
7,846
61,808
492
18,198
79,514
183
79,697
9,129
1,522
10,651
13
69,046
68,887
-0.4
2015E
150,671
10.5
72,667
78,004
51.8
7,266
70,738
105
28,058
98,691
98,691
10,652
1,775
12,428
12.6
86,263
86,263
25.2
2016E
157,303
4.4
76,240
81,063
51.5
7,703
73,361
32
25,491
98,819
98,819
16,571
2,762
19,333
19.6
79,487
79,487
-7.9
(INR Million)
2017E
161,030
2.4
79,662
81,369
50.5
8,118
73,251
32
28,629
101,848
101,848
17,078
2,846
19,924
19.6
81,925
81,925
3.1
Balance Sheet
Y/E March
Share Capital
Reserves
Net Worth
Minority Interest
Total Loans
Deferred Tax Liability
Capital Employed
Gross Block
Less: Accum. Deprn.
Net Fixed Assets
Capital WIP
Investments
Curr. Assets
Inventory
Account Receivables
Cash and Bank Balance
Others
Curr. Liability & Prov.
Account Payables
Provisions & Others
Net Current Assets
Appl. of Funds
E: MOSL Estimates
2010
4,225
177,014
181,240
605
7,112
188,957
82,407
20,766
61,641
11,130
129,444
4,517
1,518
118,767
4,642
13,258
4,777
8,481
116,186
188,957
2011
8,451
216,881
225,332
4
9,447
234,783
98,023
25,481
72,542
8,752
169,235
7,624
2,089
149,675
9,848
15,747
4,748
10,998
153,488
234,783
2012
8,451
260,362
268,813
4
11,088
279,905
116,579
31,451
85,128
4,450
204,652
7,979
3,325
179,502
13,847
14,326
4,103
10,223
190,327
279,905
2013
8,451
314,307
322,757
4
12,799
335,560
122,648
37,811
84,837
10,819
258,998
11,111
4,029
214,820
29,039
19,094
4,842
14,252
239,904
335,560
2014
8,451
365,726
374,176
2015E
8,451
441,872
450,322
2016E
8,451
504,056
512,507
(INR Million)
2017E
8,451
568,678
577,129
16,581
390,757
135,841
44,369
91,473
15,409
309,885
11,982
3,995
255,378
38,529
26,010
5,103
20,906
283,875
390,757
18,356
468,679
151,841
51,635
100,206
15,409
379,238
12,371
4,125
324,214
38,529
26,175
5,269
20,906
353,063
468,679
21,118
533,625
167,841
59,338
108,503
15,409
436,119
12,915
4,306
380,368
38,529
26,407
5,500
20,906
409,712
533,625
23,965
601,093
183,841
67,455
116,386
15,409
495,835
13,221
4,408
439,677
38,529
26,537
5,631
20,906
469,298
601,093
19 January 2015
8

Hindustan Zinc
Financials and valuations
Ratios
Y/E March
Basic (INR)
EPS
Cash EPS
BV/Share
DPS
Payout (%)
Valuation (x)
P/E
Cash P/E
P/BV
EV/Sales
EV/EBITDA
Dividend Yield (%)
Return Ratios (%)
EBITDA Margins (%)
Net Profit Margins (%)
RoE
Working Capital Ratios
Fixed Asset Turnover (x)
Asset Turnover (x)
Debtor (Days)
Inventory (Days)
Working Capital Turnover (Days)
Payable (Days)
Leverage Ratio (x)
Current Ratio
Interest Cover Ratio
2010
9.6
10.4
42.9
0.6
7.3
2011
11.6
12.7
53.3
1.0
10.0
2012
13.2
14.5
63.6
2.4
21.5
12.2
11.0
2.5
4.4
8.2
1.5
58.3
50.4
24.9
1.0
0.4
6.9
20.6
-11.7
52.1
9.8
98.7
55.4
49.6
24.2
1.0
0.4
7.7
28.1
14.0
39.2
10.7
258.8
53.2
48.8
22.5
1.0
0.4
10.6
25.5
34.6
28.1
14.3
391.3
2013
16.4
17.9
76.4
3.1
22.2
9.8
9.0
2.1
3.6
7.1
1.9
51.0
54.4
23.4
1.0
0.4
11.6
31.9
72.1
28.4
13.6
200.5
2014
16.3
18.2
88.6
3.5
25.1
9.8
8.8
1.8
3.1
6.0
2.2
51.1
50.5
19.8
1.0
0.3
10.7
32.1
20.9
27.9
11.9
125.6
2015E
20.4
22.1
106.6
1.9
11.0
7.8
7.2
1.5
2.3
4.5
1.2
51.8
57.3
20.9
1.0
0.3
10.0
30.0
19.1
26.5
14.5
674
2016E
18.8
20.6
121.3
3.5
21.8
8.5
7.8
1.3
1.9
3.6
2.2
51.5
50.5
16.5
0.9
0.3
10.0
30.0
18.7
26.3
16.5
2,322
2017E
19.4
21.3
136.6
3.5
21.1
8.3
7.5
1.2
1.5
2.9
2.2
50.5
50.9
15.0
0.9
0.3
10.0
30.0
18.4
25.8
18.7
2,318
Cash Flow Statement
Y/E March
Pre-tax profit
Depreciation
(Inc)/Dec in Wkg. Cap.
Tax paid
Other operating activities
CF from Op. Activity
(Inc)/Dec in FA + CWIP
(Pur)/Sale of Investments
Others
CF from Inv. Activity
Debt Raised/(Repaid)
Dividend (incl. tax)
Other Finan. Activities
CF from Fin. Activity
(Inc)/Dec in Cash
Add: opening Balance
Closing Balance
E: MOSL Estimates
2010
50,141
3,343
3,219
-8,309
229
48,623
-23,897
2011
59,596
4,747
-6,394
-8,255
-776
48,918
-13,239
2012
69,445
6,107
-7,012
-12,547
-643
55,350
-14,253
2013
78,201
6,470
-14,259
-7,551
219
63,081
-12,438
2014
79,697
7,846
-3,413
-9,129
648
75,649
-17,784
2015E
98,691
7,266
-352
-10,652
94,953
-16,000
2016E
98,819
7,703
-494
-16,571
89,457
-16,000
(INR Million)
2017E
101,848
8,118
-278
-17,078
92,611
-16,000
-23,897
518
-2,956
-2,439
22,287
96,480
118,767
-13,239
-601
-4,911
741
-4,771
30,908
118,767
149,675
-14,253
0
-11,865
594
-11,271
29,827
149,675
179,502
-12,438
-17,784
-4
-17,303
-17,307
40,558
214,820
255,378
-16,000
-16,000
-16,000
-15,325
-15,325
35,318
179,502
214,820
-9,393
-9,393
69,560
255,378
324,938
-17,303
-17,303
56,155
324,214
380,368
-17,303
-17,303
59,308
380,368
439,677
19 January 2015
9

Disclosures
This document has been prepared by Motilal Oswal Securities Limited (hereinafter referred to as Most) to provide information about the company(ies) and/sector(s), if any, covered in the report and may be
distributed by it and/or its affiliated company(ies). This report is for personal information of the selected recipient/s and does not construe to be any investment, legal or taxation advice to you. This research report does
not constitute an offer, invitation or inducement to invest in securities or other investments and Motilal Oswal Securities Limited (hereinafter referred as MOSt) is not soliciting any action based upon it. This report is not
for public distribution and has been furnished to you solely for your general information and should not be reproduced or redistributed to any other person in any form. This report does not constitute a personal
recommendation or take into account the particular investment objectives, financial situations, or needs of individual clients. Before acting on any advice or recommendation in this material, investors should consider
whether it is suitable for their particular circumstances and, if necessary, seek professional advice. The price and value of the investments referred to in this material and the income from them may go down as well as
up, and investors may realize losses on any investments. Past performance is not a guide for future performance, future returns are not guaranteed and a loss of original capital may occur.
MOSt and its affiliates are a full-service, integrated investment banking, investment management, brokerage and financing group. We and our affiliates have investment banking and other business relationships with a
some companies covered by our Research Department. Our research professionals may provide input into our investment banking and other business selection processes. Investors should assume that MOSt and/or
its affiliates are seeking or will seek investment banking or other business from the company or companies that are the subject of this material and that the research professionals who were involved in preparing this
material may educate investors on investments in such business. The research professionals responsible for the preparation of this document may interact with trading desk personnel, sales personnel and other
parties for the purpose of gathering, applying and interpreting information. Our research professionals are paid on the profitability of MOSt which may include earnings from investment banking and other business.
MOSt generally prohibits its analysts, persons reporting to analysts, and members of their households from maintaining a financial interest in the securities or derivatives of any companies that the analysts cover.
Additionally, MOSt generally prohibits its analysts and persons reporting to analysts from serving as an officer, director, or advisory board member of any companies that the analysts cover. Our salespeople, traders,
and other professionals or affiliates may provide oral or written market commentary or trading strategies to our clients that reflect opinions that are contrary to the opinions expressed herein, and our proprietary
trading and investing businesses may make investment decisions that are inconsistent with the recommendations expressed herein. In reviewing these materials, you should be aware that any or all of the foregoing
among other things, may give rise to real or potential conflicts of interest. MOSt and its affiliated company(ies), their directors and employees and their relatives may; (a) from time to time, have a long or short position
in, act as principal in, and buy or sell the securities or derivatives thereof of companies mentioned herein. (b) be engaged in any other transaction involving such securities and earn brokerage or other compensation
or act as a market maker in the financial instruments of the company(ies) discussed herein or act as an advisor or lender/borrower to such company(ies) or may have any other potential conflict of interests with
respect to any recommendation and other related information and opinions.; however the same shall have no bearing whatsoever on the specific recommendations made by the analyst(s), as the recommendations
made by the analyst(s) are completely independent of the views of the affiliates of MOSt even though there might exist an inherent conflict of interest in some of the stocks mentioned in the research report
Reports based on technical and derivative analysis center on studying charts company's price movement, outstanding positions and trading volume, as opposed to focusing on a company's fundamentals and, as
such, may not match with a report on a company's fundamental analysis. In addition MOST has different business segments / Divisions with independent research separated by Chinese walls catering to different set
of customers having various objectives, risk profiles, investment horizon, etc, and therefore may at times have different contrary views on stocks sectors and markets.
Unauthorized disclosure, use, dissemination or copying (either whole or partial) of this information, is prohibited. The person accessing this information specifically agrees to exempt MOSt or any of its affiliates or
employees from, any and all responsibility/liability arising from such misuse and agrees not to hold MOSt or any of its affiliates or employees responsible for any such misuse and further agrees to hold MOSt or any of
its affiliates or employees free and harmless from all losses, costs, damages, expenses that may be suffered by the person accessing this information due to any errors and delays. The information contained herein is
based on publicly available data or other sources believed to be reliable. Any statements contained in this report attributed to a third party represent MOSt’s interpretation of the data, information and/or opinions
provided by that third party either publicly or through a subscription service, and such use and interpretation have not been reviewed by the third party. This Report is not intended to be a complete statement or
summary of the securities, markets or developments referred to in the document. While we would endeavor to update the information herein on reasonable basis, MOSt and/or its affiliates are under no obligation to
update the information. Also there may be regulatory, compliance, or other reasons that may prevent MOSt and/or its affiliates from doing so. MOSt or any of its affiliates or employees shall not be in any way
responsible and liable for any loss or damage that may arise to any person from any inadvertent error in the information contained in this report. MOSt or any of its affiliates or employees do not provide, at any time,
any express or implied warranty of any kind, regarding any matter pertaining to this report, including without limitation the implied warranties of merchantability, fitness for a particular purpose, and non-infringement.
The recipients of this report should rely on their own investigations.
This report is intended for distribution to institutional investors. Recipients who are not institutional investors should seek advice of their independent financial advisor prior to taking any investment decision based on
this report or for any necessary explanation of its contents.
Most and it’s associates may have managed or co-managed public offering of securities, may have received compensation for investment banking or merchant banking or brokerage services, may have received any
compensation for products or services other than investment banking or merchant banking or brokerage services from the subject company in the past 12 months.
Most and it’s associates have not received any compensation or other benefits from the subject company or third party in connection with the research report.
Subject Company may have been a client of Most or its associates during twelve months preceding the date of distribution of the research report
MOSt and/or its affiliates and/or employees may have interests/positions, financial or otherwise of over 1 % at the end of the month immediately preceding the date of publication of the research in the securities
mentioned in this report. To enhance transparency, MOSt has incorporated a Disclosure of Interest Statement in this document. This should, however, not be treated as endorsement of the views expressed in the
report.
Motilal Oswal Securities Limited is under the process of seeking registration under SEBI (Research Analyst) Regulations, 2014.
There are no material disciplinary action that been taken by any regulatory authority impacting equity research analysis activities
Analyst Certification
The views expressed in this research report accurately reflect the personal views of the analyst(s) about the subject securities or issues, and no part of the compensation of the research analyst(s) was, is, or will be
directly or indirectly related to the specific recommendations and views expressed by research analyst(s) in this report. The research analysts, strategists, or research associates principally responsible for preparation
of MOSt research receive compensation based upon various factors, including quality of research, investor client feedback, stock picking, competitive factors and firm revenues
Disclosure of Interest Statement
§
Analyst ownership of the stock
§
Served as an officer, director or employee
HINDUSTAN ZINC
No
No
Hindustan Zinc
Regional Disclosures (outside India)
For U.S.
This report is not directed or intended for distribution to or use by any person or entity resident in a state, country or any jurisdiction, where such distribution, publication, availability or use would be contrary to law,
regulation or which would subject MOSt & its group companies to registration or licensing requirements within such jurisdictions.
Motilal Oswal Securities Limited (MOSL) is not a registered broker - dealer under the U.S. Securities Exchange Act of 1934, as amended (the"1934 act") and under applicable state laws in the United States. In
addition MOSL is not a registered investment adviser under the U.S. Investment Advisers Act of 1940, as amended (the "Advisers Act" and together with the 1934 Act, the "Acts), and under applicable state laws in the
United States. Accordingly, in the absence of specific exemption under the Acts, any brokerage and investment services provided by MOSL, including the products and services described herein are not available to or
intended for U.S. persons.
This report is intended for distribution only to "Major Institutional Investors" as defined by Rule 15a-6(b)(4) of the Exchange Act and interpretations thereof by SEC (henceforth referred to as "major institutional
investors"). This document must not be acted on or relied on by persons who are not major institutional investors. Any investment or investment activity to which this document relates is only available to major
institutional investors and will be engaged in only with major institutional investors. In reliance on the exemption from registration provided by Rule 15a-6 of the U.S. Securities Exchange Act of 1934, as amended (the
"Exchange Act") and interpretations thereof by the U.S. Securities and Exchange Commission ("SEC") in order to conduct business with Institutional Investors based in the U.S., MOSL has entered into a chaperoning
agreement with a U.S. registered broker-dealer, Motilal Oswal Securities International Private Limited. ("MOSIPL"). Any business interaction pursuant to this report will have to be executed within the provisions of this
chaperoning agreement.
The Research Analysts contributing to the report may not be registered /qualified as research analyst with FINRA. Such research analyst may not be associated persons of the U.S. registered broker-dealer, MOSIPL,
and therefore, may not be subject to NASD rule 2711 and NYSE Rule 472 restrictions on communication with a subject company, public appearances and trading securities held by a research analyst account.
Motilal Oswal Capital Markets Singapore Pte Limited is acting as an exempt financial advisor under section 23(1)(f) of the Financial Advisers Act(FAA) read with regulation 17(1)(d) of the Financial Advisors
Regulations and is a subsidiary of Motilal Oswal Securities Limited in India. This research is distributed in Singapore by Motilal Oswal Capital Markets Singapore Pte Limited and it is only directed in Singapore to
accredited investors, as defined in the Financial Advisers Regulations and the Securities and Futures Act (Chapter 289), as amended from time to time.
In respect of any matter arising from or in connection with the research you could contact the following representatives of Motilal Oswal Capital Markets Singapore Pte Limited:
Anosh Koppikar
Kadambari Balachandran
Email : anosh.Koppikar@motilaloswal.com
Email : kadambari.balachandran@motilaloswal.com
Contact : (+65)68189232
Contact : (+65) 68189233 / 65249115
Office Address : 21 (Suite 31),16 Collyer Quay,Singapore 04931
For Singapore
19 January 2015
Motilal Oswal Securities Ltd
Motilal Oswal Tower, Level 9, Sayani Road, Prabhadevi, Mumbai 400 025
Phone: +91 22 3982 5500 E-mail: reports@motilaloswal.com
10