19 January 2015
3QFY15 Results Update | Sector:
Financials
Indiabulls Housing Finance
BSE SENSEX
28,262
Bloomberg
Equity Shares (m)
S&P CNX
8,551
IHFL IN
355.1
CMP: INR572
n
TP: INR738 (29%)
Buy
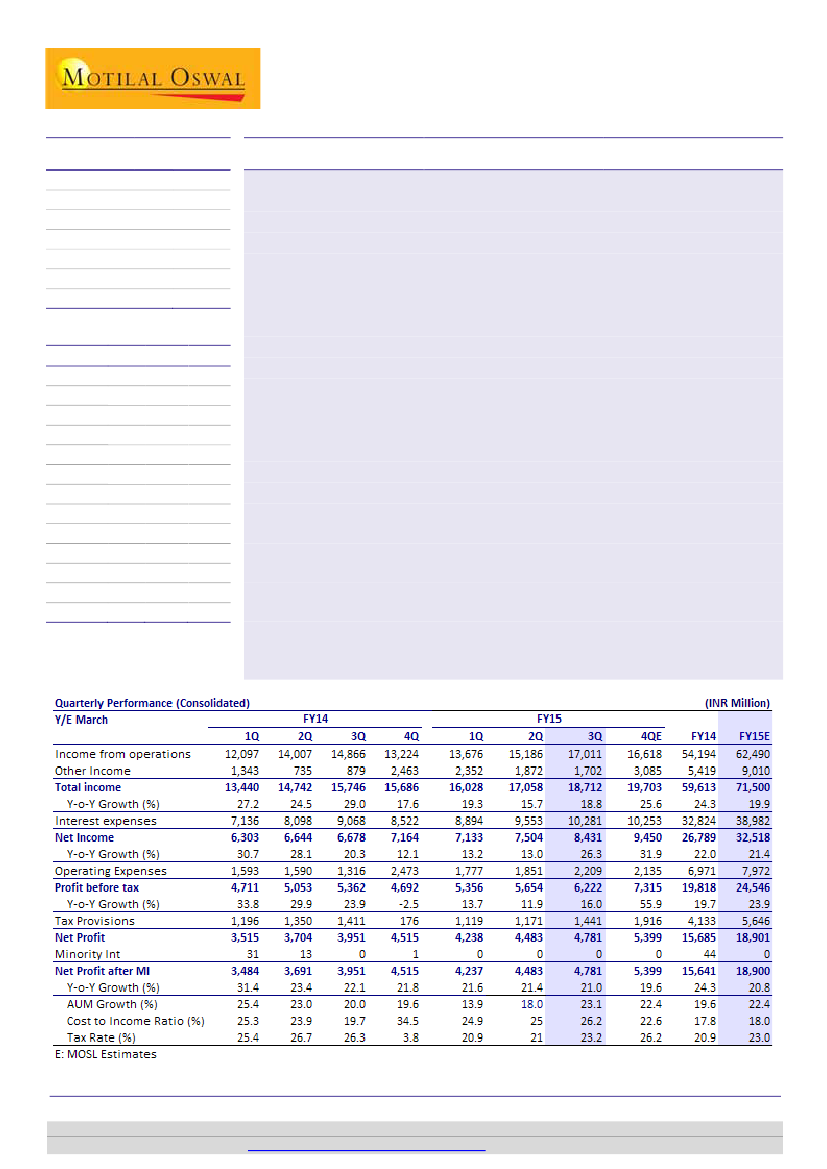
Business momentum healthy; spreads and asset quality stable
Indiabulls Housing Finance (IHFL) reported PAT growth of 21% YoY (+6.7% QoQ) to
M.Cap. (INR b) / (USD b) 203.1/3.3
INR4.8b (in line with est.). Healthy AUM growth of +23% YoY, strong disbursement
52-Week Range (INR)
580/188
growth of +71% YoY (+11% QoQ) and stable book spreads of 340bp were the key
1, 6, 12 Rel. Per (%)
23/43/122
highlights of the quarter.
Avg Val (INR m)/Vol ‘000 358/956
n
Healthy pick-up in disbursements at INR53.5b, grew +71% YoY and 11% QoQ, led
Free float (%)
72.2
to +23% AUM growth at INR480.8b. The overall AUM mix skewed slightly in favor
of mortgages (76% share v/s 73% in 3QFY14), with the share of corporate being
Financials & Valuation (INR Billion)
stable at 21%.
Y/E March 2015E 2016E 2017E
Net Fin inc
23.5
28.5
35.3
n
GNPAs percentage remained steady at 0.86% and NNPAs at 0.34% respectively.
Provisions of INR740m during the quarter were towards accelerated writeoffs and
PPP
27.8
33.5
41.3
did not include any specific account.
EPS (INR)
54.2
64.2
79.0
EPS Gr. (%)
15.8
18.4
23.2
n
Other highlights:
a) book spreads of 340bp and incremental spreads of 310bp
BV/Sh.
were stable QoQ, b) IHFL’s cumulative disbursements till date reached INR1t, c)
189
215
246
( )on
RoA
INR650m debited from net worth for outstanding ZCB, d) securitized assets worth
3.6
3.7
3.7
(%)
RoE (%)
30.7
32.4
34.3
INR7b during the quarter, e) bond issuance contributed 43% of incremental
Payout (%)
71.4
60.8
60.8
borrowings, f) opex includes INR150m towards CSR expenses.
Valuations
n
Valuation and view:
IHFL has transformed from a diversified lender to a focused
P/E (x)
10.6
8.9
7.2
mortgage player. Mortgage focus has yielded returns, with RoE/RoA improving
P/BV (x)
3.0
2.7
2.3
from 3%/0.8% in FY09 to 30%/3.7% in 9MFY15. Focus on mortgage and market
P/BV (x)
3.0
2.7
2.3
share gains will drive AUM growth of ~23% for the next three years. Lowest
Div. Yld (%)
5.8
5.8
7.2
levered HFC (6.1x) to support growth without dilution. Asset quality trend to
remain stable. Improved borrowing profile, better credit rating and liquidity buffer
will aid the company maintain healthy spreads. IHFL offers superior return ratios
with +6% dividend yield. Maintain
Buy
with a target price of INR738 (3x FY17E BV).
Sunesh Khanna
(Sunesh.Khanna@MotilalOswal.com); +91 22 3982 5521
Alpesh Mehta
(Alpesh.Mehta@MotilalOswal.com); +91 22 3982 5415
Investors are advised to refer through disclosures made at the end of the Research Report.
Motilal Oswal research is available on
www.motilaloswal.com/Institutional-Equities,
Bloomberg, Thomson Reuters, Factset and S&P Capital.

Indiabulls Housing Finance
Exhibit 1: Quarterly performance v/s expectations and deviations for the same
Particulars
Total income
Net Income
Operating Expenses
Profit before Tax
Tax Provisions
Net Profit
Int Exp/ operating inc (%)
Other Income / Total Income (%)
Cost to Income Ratio (%)
Tax Rate (%)
3QFY15A
18,712
8,431
2,209
6,222
1,441
4,781
60.4
9.1
26.2
23.2
3QFY15E
18,245
8,023
2,000
6,023
1,445
4,577
64.1
12.6
24.9
24.0
Var. (%)
3
5
10
3
0
4
Comments
In-line with estimate
Better than expected spreads
Opex includes INR150m for CSR activities
Tax rate at 23.2% v/s est. of 24%
In-line with estimate
Source: Company, MOSL
Disbursement growth picks up to +71% YoY; AUM growth at 23% YoY
n
n
Healthy pick-up in disbursements at INR53.5b, grew +71% YoY and 11% QoQ, led
to +23% AUM growth at INR480.8b.
The overall AUM mix skewed slightly in favor of mortgages (76% share v/s 73%
in 3QFY14), with share of corporate being steady at 21%. Share of commercial
vehicle segment continued to fall (as the company is winding off the CV lending)
to 3% of AUM as compared to 6% in 3QFY14.
Blended spreads stable at 340bp; borrowing mix remain stable
n
n
n
Spreads of 340bp were stable QoQ and down 20bp YoY; Borrowings increased
23% YoY (+6% QoQ) to INR437b and mix shifted slightly in favor of NCDs (32%
v/s 29% in 3QFY14).
Bond issuances have been healthy and contributed 43% of the incremental
borrowings in the last 12 months, moreover management has indicated that
60% of the incremental borrowings will happen via bonds. Dependency on bank
borrowing declined to 60% v/s near term peak of 66% in 3QFY14. Net gearing
ratio increased to 6.1% (5.14% in 3QFY14).
IHFL continues to maintain healthy levels of liquidity with cash, cash equivalents
and investments in liquid debt instruments adding up to INR71b and
management wants to maintain such high level of cash and cash equivalent in
order to tide any liquidity crisis.
Asset quality remain healthy
n
n
GNPA% remained steady at 0.86% and NNPA at 0.34% respectively. IHFL made
provisions of INR 740m were largely for accelerated write –offs. Management
indicated that outlook on asset quality remain healthy and it continues to be a
key focus area.
Further it stated that GNPA/NNPA percentage shall decline over a period of time
and shall be around 70bp and 30bp respectively.
Other highlights:
a) IHFL cumulative disbursement till date reached INR1t b)
INR560m debited from net worth for outstanding ZCB. c) Securitized assets
worth INR7b during the quarter d) Bond issuance contributed 43% of
incremental borrowings. e) Opex includes INR 150m towards CSR expenses.
n
19 January 2015
2

Indiabulls Housing Finance
Valuation and view
n
n
n
n
n
Indiabulls Housing Finance Ltd (IHFL) has transformed from a diversified lender
to a focused mortgage player. Mortgage focus has yielded returns, with
RoE/RoA improving from 3%/0.8% in FY09 to +30%/3.8% in 9MFY15.
IHFL has devised a unique strategy – 76% of the book forms mortgage/LAP
(which keeps asset quality under check) and 26% of book forms commercial
credit and commercial vehicles (supports blended spreads of +350bp), thereby
enabling sound asset quality with superior returns.
Disbursement growth has picked up, we believe focus on mortgage and market
share gains will drive AUM growth of ~23% for next three years. Lowest levered
HFC (6.1x) to support growth without dilution.
Asset quality trend to remain stable. Improved borrowing profile, better credit
rating and liquidity buffer will help the company maintain healthy spreads.
Consistent outperformance on key parameters relative to sector. Average three-
year RoE at +25% is the best among the peer group. The company offers
superior return ratios with +6% dividend yield. Maintain
Buy
with a target price
of INR738 (3x FY17E BV).
Conference call highlights
n
n
n
n
n
n
n
n
n
n
n
Government’s focus on house for all by 2020 and enabling policy towards will
expand the business pie and shall drive volume growth.
Management looking at a sustainable business model of financing incremental
growth via 30-35% sell down, 35% bonds and 30% deposits. At origination yield
on PSL loan is 10.4% and able to securitize at 7.75-8%.
Guidance: Loan growth of 20-25%; Spread guidance of 325-350bp for the
current book and 300-310bp on incremental lending.
Total outstanding provisions at INR6.05b: Sub standard provisions of INR2.47b,
Specific provisions of INR0.5b, Standard provisions of INR3.07b.
Off balance sheet AUM stands at INR54b and IHFL did the assignment of INR7b
during quarter (fourth quarter sell down will be higher) and INR17b in 9MFY15.
Bond issuances have been healthy and contributed 43% of the incremental
borrowings in the last 12 months, moreover management has indicated that
60% of the incremental borrowings will happen via bonds.
For the quarter, cost of borrowings is ~9.88% (v/s 9.95% in 2QFY15): Borrowings
from banks at 5bp above base rate.
Charge of zero coupon bond on net worth is INR569m for the quarter.
Capital adequacy stands at 18%.
Fee income for the quarter stood at INR950m.
IHFL has been able to recover INR0.25b out of INR1b given to Deccan Cronica,
management expects to recover the remaining amount as that have collateral of
over INR2b.
19 January 2015
3

Indiabulls Housing Finance
Story in charts
Exhibit 2: Disb. Growth picks up at +71% YoY
Disbursement (INR b)
Exhibit 3: AUM growth of 23% boosted by healthy disb. Gr.
46.9
AUM (INR b)
AUM Gr. (%)
39.0 41.4
30.4 29.8
25.1 25.4 23.0
20.0 19.6
18.0
23.1
13.9
Source: Company, MOSL
*AUM numbers are reclassified, hence not comparable
Exhibit 4: AUM mix squeezed further in favor of mortgage
Others
CV
Corporate
Mortgages
Exhibit 5: Borrowing mix remains stable
NCD (%)
CP (%)
Bank Loans (%)
1
8
20
71
0
8
21
0
8
21
0
8
21
0
8
20
0
7
21
1
7
21
6
21
6
21
5
21
0
4
21
0
3
21
0
3
21
23
9
68
24
10
66
28
10
62
27
8
65
29
8
63
30
8
62
31
8
61
28
6
66
29
8
63
30
8
62
32
8
60
32
8
60
32
8
60
71
71
71
72
72
72
73
73
74
75
76
76
Source: Company, MOSL
Exhibit 6: Asset quality remains healthy
GNPA (%)
NNPA (%)
Exhibit 7: Net gearing (x) remains at comfortable level
5.6 5.7
5.1 5.1 5.3 5.3
6.1
0.9 0.8 0.8 0.9 0.9
0.8 0.8 0.8 0.8 0.8 0.8 0.8 0.9
0.3
0.3 0.3 0.3 0.3 0.3 0.3
0.4 0.5
0.4 0.4 0.3 0.3
4.7
4.3 4.5
3.9 4.1
3.7
Source: Company, MOSL
19 January 2015
4

Indiabulls Housing Finance
Corporate profile
Company description
Indiabulls Housing Finance (IHFL) is the fourth
largest housing finance company in India with AUM
of INR480b. It was established as a wholly-owned
subsidiary of Indiabulls Financial Services (IBFSL). In
early 2013, keeping with IHFL’s long-term
commitment to the housing finance business, the
company was reversed-merged into its housing
finance subsidiary IHFL. IHFL offers home loans to
target client base of middle and upper-middle
income individuals and small and medium-sized
enterprises, or SMEs. It has presence across 200+
locations across India.
Exhibit 8: Sensex rebased
650
550
450
350
250
150
Jan-14
Apr-14
Jul-14
Oct-14
Jan-15
Indiabulls Hous.
Sensex - Rebased
Exhibit 9: Shareholding pattern (%)
Dec-14
Promoter
DII
FII
Others
27.8
3.2
45.8
23.2
Sep-14
27.9
3.1
41.0
28.1
Dec-13
41.5
3.4
39.4
15.7
Exhibit 10: Top holders
Holder Name
Copthall Mauritius Investment Ltd
Saurabh Kumar Mittal
Cinnamon Capital Ltd
Rajiv Rattan
HSBC Global Investment Funds A/c HSBC GIF Mauritius
%
Holding
5.7
4.4
4.3
4.1
3.6
Note: FII Includes depository receipts
Exhibit 11: Top management
Name
Sameer Gehlaut
Gagan Banga
Ashwini Kumar
Mukesh Garg
Pinank Shah
Ramnath Shenoy
Designation
Chairman
Vice Chairman and MD
Deputy Managing Director
Chief Financial Officer
Head Treasury
Executive Vice President, IR
Exhibit 12: Directors
Name
Sameer Gehlaut
Gagan Banga
Dr. K.C. Chakrabarty
Surinder Singh Nijjar
Bisheshwar Prasad Singh
Mrs. Manjari Kacker
*Independent
Name
Brig. Labh Singh Sitara
Samsher Singh Ahlawat
Prem Prakash Mirdha
Ashwini Kumar Hooda
Ajit Kumar Mittal
Exhibit 13: Auditors
Name
Deloitte Haskins & Sells LLP
N D Kapur & Co
Type
Statutory
Internal
Exhibit 14: MOSL forecast v/s consensus
EPS (INR)
FY15
FY16
FY17
MOSL forecast
54.2
64.2
79.0
Consensus
forecast
54.1
63.0
74.4
Variation (%)
0.2
1.8
6.2
19 January 2015
5

Indiabulls Housing Finance
Financials: Valuation metrics
62.02
Rating
ICICIBC*
Buy
HDFCB
Buy
AXSB
Buy
KMB*
Neutral
YES
Buy
IIB
Buy
VYSB
Neutral
FB
Buy
JKBK
Buy
SIB
Buy
Private Aggregate
SBIN (cons)*
Buy
PNB
Buy
BOI
Neutral
BOB
Neutral
UNBK
Buy
INBK
Buy
CRPBK
Neutral
ANDB
Buy
IDBI
Neutral
DBNK
Neutral
Public Aggregate
HDFC*
Buy
LICHF
Buy
DEWH
Buy
IHFL
Buy
IDFC
Neutral
RECL
Buy
POWF
Buy
SHTF
Buy
MMFS
Neutral
BAF
Buy
NBFC Aggregate
CMP
(INR)
361
1,005
529
1,389
825
830
973
147
151
31
313
208
299
1,084
238
212
351
93
75
60
1,181
494
494
572
170
329
293
1,143
287
3,893
Mcap
(USDb)
33.6
38.9
20.0
17.3
5.5
7.0
3.0
2.0
1.2
0.7
129.1
37.7
6.1
3.1
7.5
2.4
1.6
0.9
0.9
1.9
0.5
62.7
29.7
4.0
1.0
3.3
4.4
5.2
6.2
4.2
2.6
3.1
63.8
EPS (INR)
FY16
22.8
52.5
36.7
49.2
60.4
43.2
43.8
12.9
19.5
5.2
29.9
28.8
61.2
142.1
36.1
30.2
82.4
18.6
14.4
13.6
38
32
60
63
13
67
57
79
17
219
FY17
27.0
63.8
42.4
60.4
76.2
53.2
55.5
15.1
23.5
5.7
37.2
38.1
76.8
168.4
47.3
33.1
109.5
24.0
19.7
16.8
46
39
76
77
14
78
69
93
21
267
P/E (x)
FY16
13.2
19.1
14.4
28.2
13.7
19.2
22.2
11.4
7.8
5.9
17.7
10.1
7.2
4.9
7.6
6.6
7.0
4.3
5.0
5.2
4.4
9.4
20.6
15.2
8.2
9.0
13.2
4.9
5.1
14.4
16.7
17.8
13.9
FY17
10.8
15.7
12.5
23.0
10.8
15.6
17.5
9.7
6.4
5.4
14.8
8.1
5.5
3.9
6.4
5.0
6.4
3.2
3.9
3.8
3.6
7.5
15.5
12.6
6.5
7.5
11.8
4.2
4.2
12.2
13.4
14.6
11.7
BV (INR)
FY16
133
254
220
371
330
228
434
100
144
31
232
235
478
972
321
291
703
169
157
137
166
197
356
214
110
301
292
498
113
1,137
FY17
152
303
256
427
391
272
478
112
162
35
263
268
545
1,101
360
317
789
186
173
150
192
229
412
244
120
361
344
578
129
1,360
P/BV (x)
FY16
2.3
3.9
2.4
3.7
2.5
3.6
2.2
1.5
1.0
1.0
2.9
1.3
0.9
0.6
1.1
0.7
0.7
0.5
0.6
0.5
0.4
1.1
4.8
2.5
1.4
2.7
1.3
1.1
1.0
2.3
2.5
3.4
2.6
FY17
1.9
3.3
2.1
3.3
2.1
3.0
2.0
1.3
0.9
0.9
2.5
1.1
0.8
0.5
1.0
0.7
0.7
0.4
0.5
0.4
0.4
1.0
3.7
2.2
1.2
2.3
1.2
0.9
0.9
2.0
2.2
2.9
2.3
RoA (%)
FY16
1.8
2.0
1.8
1.9
1.7
2.0
1.1
1.2
1.1
1.1
0.8
0.8
0.6
0.8
0.6
0.6
0.5
0.5
0.6
0.5
2.5
1.4
1.3
4.2
2.3
3.5
3.1
2.3
2.6
2.9
FY17
1.8
2.0
1.7
1.9
1.7
2.0
1.1
1.2
1.2
1.0
0.9
0.9
0.6
0.8
0.6
0.6
0.6
0.6
0.7
0.5
2.5
1.4
1.3
4.2
2.3
3.4
3.1
2.5
2.8
2.9
RoE (%)
FY16
15.6
22.4
17.9
14.3
19.7
20.5
10.5
13.6
14.3
18.2
13.2
13.0
13.6
15.5
11.8
10.8
12.3
11.4
9.5
10.3
23.8
17.6
17.9
32.0
11.7
24.5
21.2
16.5
16.1
21.0
FY17
16.2
22.9
17.8
15.0
21.1
21.3
12.2
14.3
15.4
17.4
14.8
15.1
15.0
16.3
13.9
10.9
14.7
13.5
11.9
11.7
24.8
18.4
19.9
33.4
12.0
23.4
21.7
17.9
17.7
21.4
*Multiples adj. for value of key ventures/Investments; For ICICI Bank and HDFC Ltd BV is adjusted for investments in subsidiaries
19 January 2015
6

Indiabulls Housing Finance
Financials and valuations
Income Statement
Y/E March
Financing Income
Financing Charges
Net Financing income
Change (%)
Income from Investments
Fee based income
Net Income
Change (%)
Employee Cost
Other Operating Exp.
Operating profits
Change (%)
Total Provisions
% of operating profit
PBT
Tax
Tax Rate (%)
PAT
Change (%)
Minority Interest
PAT
Change (%)
Dividend (Including tax)
Balance Sheet
Y/E March
Capital
Equity Share Capital
Reserves & Surplus
Net Worth
Equity Net worth
Minority Interest
Borrowings
Change (%)
Deferred Tax Liability
Total Liabilities
Cash and bank balance
Investments
Change (%)
Loans
Change (%)
Net Current Assets
Net Fixed Assets
Total Assets
2010
14,131
5,981
8,150
13.9
219
1,907
10,370
6.1
1,364
985
8,021
15.6
3,447
43.0
4,573
1,498
32.8
3,075
189.1
62
3,013
203.0
1,938
2011
21,246
8,995
12,252
50.3
1,016
2,465
16,105
55.3
1,656
1,816
12,632
57.5
2,717
21.5
9,915
2,406
24.3
7,509
144.2
82
7,427
146.5
3,620
2012
32,235
19,201
13,035
6.4
1,980
3,604
19,264
19.6
1,924
1,770
15,570
23.3
2,349
15.1
13,220
3,156
23.9
10,065
34.0
83
9,981
34.4
4,709
2013
42,634
25,991
16,643
27.7
2,748
2,397
21,789
13.1
2,245
1,761
17,783
14.2
1,231
6.9
16,551
3,891
23.5
12,661
25.8
76
12,584
26.1
7,277
2014
51,865
32,824
19,041
14.4
5,419
2,329
26,789
23.0
2,637
1,503
22,649
27.4
2,831
12.5
19,818
4,133
20.9
15,685
23.9
44
15,642
24.3
11,298
2015E
62,490
38,982
23,508
23.5
6,232
2,678
32,518
21.4
3,112
1,655
27,751
22.5
3,205
11.5
24,546
5,646
23.0
18,901
20.5
50
18,851
20.5
13,454
2016E
73,934
45,432
28,502
21.2
7,167
3,080
38,949
19.8
3,579
1,822
33,548
20.9
3,361
10.0
30,187
6,943
23.0
23,244
23.0
50
23,194
23.0
14,111
(INR Million)
2017E
89,435
54,091
35,344
24.0
8,242
3,542
47,428
21.8
4,116
2,004
41,308
23.1
4,128
10.0
37,180
8,551
23.0
28,628
23.2
50
28,578
23.2
17,387
2010
620
620
42,481
43,101
43,101
1,109
78,495
14.9
-251
122,454
12,313
11,683
-2.3
105,246
49.3
-7,233
445
122,454
2011
622
622
44,779
45,401
45,401
1,211
193,187
146.1
-722
239,077
21,413
30,894
164.4
194,297
84.6
-7,971
444
239,077
2012
624
624
48,432
49,056
49,056
1,315
252,870
30.9
-1,098
302,143
41,956
17,968
-41.8
254,675
31.1
-12,901
445
302,143
2013
625
625
51,061
51,686
51,686
1,449
312,858
23.7
-1,641
364,351
48,882
23,079
28.4
307,824
20.9
-15,889
456
364,351
2014
668
668
56,402
57,070
57,070
19
354,900
13.4
-1,848
410,141
45,063
29,470
27.7
354,450
15.1
-19,067
432
410,348
2015E
710
710
64,865
65,575
65,575
19
432,611
21.9
-1,848
496,357
58,045
32,417
10.0
428,327
20.8
-22,880
448
496,357
(INR Million)
2016E
2017E
723
723
723
723
77,014
88,205
77,737
88,928
77,737
88,928
19
19
523,851
645,683
21.1
23.3
-1,848
-1,848
599,760
732,783
67,189
80,209
35,659
39,224
10.0
10.0
523,851
645,683
22.3
23.3
-27,456
-32,948
505
601
599,747
732,770
19 January 2015
7

Indiabulls Housing Finance
Financials and valuations
Ratios
Y/E March
Spreads Analysis (%)
Avg. Yield - on Fin. Portfolio
Avg Cost of funds
Interest Spread on on books
Profitability Ratios (%)
RoE
RoA
RoA (on AUM)
Int. Expended/Int.Earned
Fee income/Net Inc.
Cost/Income Ratio
Empl. Cost/Op. Exps.
Asset quality
GNPA (%)
NNPA (%)
Valuations
Book Value (INR)
BV Growth (%)
Price-BV (x)
Adjusted BV (INR)
Price-ABV (x)
EPS (INR)
EPS Growth (%)
Price-Earnings (x)
DPS (INR)
Dividend Payout (%)
Dividend Yield (%)
E: MOSL Estimates
2010
15.9
8.1
7.8
2011
14.6
6.6
8.0
2012
14.1
8.6
5.5
2013
13.5
10.1
3.4
2014
13.7
10.2
3.5
2015E
13.7
9.9
3.8
2016E
13.2
9.8
3.4
2017E
13.0
9.5
3.5
7.9
2.7
2.4
42.3
18.4
22.7
58.1
16.8
4.1
4.0
42.3
15.3
21.6
47.7
21.1
3.7
3.5
59.6
18.7
19.2
52.1
25.0
3.8
3.5
61.0
11.0
18.0
56.1
27.0
4.0
3.6
63.3
8.7
17.1
63.7
30.7
4.2
3.6
62.4
8.2
14.7
65.3
32.4
4.2
3.7
61.4
7.9
13.9
66.3
34.3
4.3
3.7
60.5
7.5
12.9
67.2
1.92
0.91
2010
139.1
6.8
139.1
9.7
148.0
5.0
64.3
1.03
0.38
2011
146.0
5.0
146.3
23.9
145.6
10.0
48.7
0.79
0.33
2012
157.3
7.8
3.6
157.4
3.6
32.0
34.0
17.9
13.0
47.2
2.3
0.79
0.33
2013
165.4
5.1
3.5
165.4
3.5
40.3
25.8
14.2
20.0
57.8
3.5
0.83
0.36
2014
168.7
2.0
3.4
168.7
3.4
46.8
16.3
12.2
29.0
72.2
5.1
0.90
0.50
2015E
188.5
11.8
3.0
188.5
3.0
54.2
15.8
10.6
33
71.4
5.8
0.80
0.40
2016E
215.0
14.0
2.7
215.0
2.7
64.2
18.4
8.9
33.4
60.8
5.8
0.80
0.40
2017E
246.0
14.4
2.3
246.0
2.3
79.0
23.2
7.2
41.1
60.8
7.2
19 January 2015
8

Indiabulls Housing Finance
NOTES
19 January 2015
9

This document has been prepared by Motilal Oswal Securities Limited (hereinafter referred to as Most) to provide information about the company(ies) and/sector(s), if any, covered in the report and may be
distributed by it and/or its affiliated company(ies). This report is for personal information of the selected recipient/s and does not construe to be any investment, legal or taxation advice to you. This research report does
not constitute an offer, invitation or inducement to invest in securities or other investments and Motilal Oswal Securities Limited (hereinafter referred as MOSt) is not soliciting any action based upon it. This report is not
for public distribution and has been furnished to you solely for your general information and should not be reproduced or redistributed to any other person in any form. This report does not constitute a personal
recommendation or take into account the particular investment objectives, financial situations, or needs of individual clients. Before acting on any advice or recommendation in this material, investors should consider
whether it is suitable for their particular circumstances and, if necessary, seek professional advice. The price and value of the investments referred to in this material and the income from them may go down as well as
up, and investors may realize losses on any investments. Past performance is not a guide for future performance, future returns are not guaranteed and a loss of original capital may occur.
MOSt and its affiliates are a full-service, integrated investment banking, investment management, brokerage and financing group. We and our affiliates have investment banking and other business relationships with a
some companies covered by our Research Department. Our research professionals may provide input into our investment banking and other business selection processes. Investors should assume that MOSt and/or
its affiliates are seeking or will seek investment banking or other business from the company or companies that are the subject of this material and that the research professionals who were involved in preparing this
material may educate investors on investments in such business. The research professionals responsible for the preparation of this document may interact with trading desk personnel, sales personnel and other
parties for the purpose of gathering, applying and interpreting information. Our research professionals are paid on the profitability of MOSt which may include earnings from investment banking and other business.
MOSt generally prohibits its analysts, persons reporting to analysts, and members of their households from maintaining a financial interest in the securities or derivatives of any companies that the analysts cover.
Additionally, MOSt generally prohibits its analysts and persons reporting to analysts from serving as an officer, director, or advisory board member of any companies that the analysts cover. Our salespeople, traders,
and other professionals or affiliates may provide oral or written market commentary or trading strategies to our clients that reflect opinions that are contrary to the opinions expressed herein, and our proprietary
trading and investing businesses may make investment decisions that are inconsistent with the recommendations expressed herein. In reviewing these materials, you should be aware that any or all of the foregoing
among other things, may give rise to real or potential conflicts of interest. MOSt and its affiliated company(ies), their directors and employees and their relatives may; (a) from time to time, have a long or short position
in, act as principal in, and buy or sell the securities or derivatives thereof of companies mentioned herein. (b) be engaged in any other transaction involving such securities and earn brokerage or other compensation
or act as a market maker in the financial instruments of the company(ies) discussed herein or act as an advisor or lender/borrower to such company(ies) or may have any other potential conflict of interests with
respect to any recommendation and other related information and opinions.; however the same shall have no bearing whatsoever on the specific recommendations made by the analyst(s), as the recommendations
made by the analyst(s) are completely independent of the views of the affiliates of MOSt even though there might exist an inherent conflict of interest in some of the stocks mentioned in the research report
Reports based on technical and derivative analysis center on studying charts company's price movement, outstanding positions and trading volume, as opposed to focusing on a company's fundamentals and, as
such, may not match with a report on a company's fundamental analysis. In addition MOST has different business segments / Divisions with independent research separated by Chinese walls catering to different set
of customers having various objectives, risk profiles, investment horizon, etc, and therefore may at times have different contrary views on stocks sectors and markets.
Unauthorized disclosure, use, dissemination or copying (either whole or partial) of this information, is prohibited. The person accessing this information specifically agrees to exempt MOSt or any of its affiliates or
employees from, any and all responsibility/liability arising from such misuse and agrees not to hold MOSt or any of its affiliates or employees responsible for any such misuse and further agrees to hold MOSt or any of
its affiliates or employees free and harmless from all losses, costs, damages, expenses that may be suffered by the person accessing this information due to any errors and delays. The information contained herein is
based on publicly available data or other sources believed to be reliable. Any statements contained in this report attributed to a third party represent MOSt’s interpretation of the data, information and/or opinions
provided by that third party either publicly or through a subscription service, and such use and interpretation have not been reviewed by the third party. This Report is not intended to be a complete statement or
summary of the securities, markets or developments referred to in the document. While we would endeavor to update the information herein on reasonable basis, MOSt and/or its affiliates are under no obligation to
update the information. Also there may be regulatory, compliance, or other reasons that may prevent MOSt and/or its affiliates from doing so. MOSt or any of its affiliates or employees shall not be in any way
responsible and liable for any loss or damage that may arise to any person from any inadvertent error in the information contained in this report. MOSt or any of its affiliates or employees do not provide, at any time,
any express or implied warranty of any kind, regarding any matter pertaining to this report, including without limitation the implied warranties of merchantability, fitness for a particular purpose, and non-infringement.
The recipients of this report should rely on their own investigations.
This report is intended for distribution to institutional investors. Recipients who are not institutional investors should seek advice of their independent financial advisor prior to taking any investment decision based on
this report or for any necessary explanation of its contents.
Most and it’s associates may have managed or co-managed public offering of securities, may have received compensation for investment banking or merchant banking or brokerage services, may have received any
compensation for products or services other than investment banking or merchant banking or brokerage services from the subject company in the past 12 months.
Most and it’s associates have not received any compensation or other benefits from the subject company or third party in connection with the research report.
Subject Company may have been a client of Most or its associates during twelve months preceding the date of distribution of the research report
MOSt and/or its affiliates and/or employees may have interests/positions, financial or otherwise of over 1 % at the end of the month immediately preceding the date of publication of the research in the securities
mentioned in this report. To enhance transparency, MOSt has incorporated a Disclosure of Interest Statement in this document. This should, however, not be treated as endorsement of the views expressed in the
report.
Motilal Oswal Securities Limited is under the process of seeking registration under SEBI (Research Analyst) Regulations, 2014.
There are no material disciplinary action that been taken by any regulatory authority impacting equity research analysis activities
Analyst Certification
The views expressed in this research report accurately reflect the personal views of the analyst(s) about the subject securities or issues, and no part of the compensation of the research analyst(s) was, is, or will be
directly or indirectly related to the specific recommendations and views expressed by research analyst(s) in this report. The research analysts, strategists, or research associates principally responsible for preparation
of MOSt research receive compensation based upon various factors, including quality of research, investor client feedback, stock picking, competitive factors and firm revenues
Disclosure of Interest Statement
§
Analyst ownership of the stock
§
Served as an officer, director or employee
INDIABULLS HOUSING FINANCE
No
No
Disclosures
Indiabulls Housing Finance
Regional Disclosures (outside India)
For U.S.
This report is not directed or intended for distribution to or use by any person or entity resident in a state, country or any jurisdiction, where such distribution, publication, availability or use would be contrary to law,
regulation or which would subject MOSt & its group companies to registration or licensing requirements within such jurisdictions.
Motilal Oswal Securities Limited (MOSL) is not a registered broker - dealer under the U.S. Securities Exchange Act of 1934, as amended (the"1934 act") and under applicable state laws in the United States. In
addition MOSL is not a registered investment adviser under the U.S. Investment Advisers Act of 1940, as amended (the "Advisers Act" and together with the 1934 Act, the "Acts), and under applicable state laws in the
United States. Accordingly, in the absence of specific exemption under the Acts, any brokerage and investment services provided by MOSL, including the products and services described herein are not available to or
intended for U.S. persons.
This report is intended for distribution only to "Major Institutional Investors" as defined by Rule 15a-6(b)(4) of the Exchange Act and interpretations thereof by SEC (henceforth referred to as "major institutional
investors"). This document must not be acted on or relied on by persons who are not major institutional investors. Any investment or investment activity to which this document relates is only available to major
institutional investors and will be engaged in only with major institutional investors. In reliance on the exemption from registration provided by Rule 15a-6 of the U.S. Securities Exchange Act of 1934, as amended (the
"Exchange Act") and interpretations thereof by the U.S. Securities and Exchange Commission ("SEC") in order to conduct business with Institutional Investors based in the U.S., MOSL has entered into a chaperoning
agreement with a U.S. registered broker-dealer, Motilal Oswal Securities International Private Limited. ("MOSIPL"). Any business interaction pursuant to this report will have to be executed within the provisions of this
chaperoning agreement.
The Research Analysts contributing to the report may not be registered /qualified as research analyst with FINRA. Such research analyst may not be associated persons of the U.S. registered broker-dealer, MOSIPL,
and therefore, may not be subject to NASD rule 2711 and NYSE Rule 472 restrictions on communication with a subject company, public appearances and trading securities held by a research analyst account.
Motilal Oswal Capital Markets Singapore Pte Limited is acting as an exempt financial advisor under section 23(1)(f) of the Financial Advisers Act(FAA) read with regulation 17(1)(d) of the Financial Advisors
Regulations and is a subsidiary of Motilal Oswal Securities Limited in India. This research is distributed in Singapore by Motilal Oswal Capital Markets Singapore Pte Limited and it is only directed in Singapore to
accredited investors, as defined in the Financial Advisers Regulations and the Securities and Futures Act (Chapter 289), as amended from time to time.
In respect of any matter arising from or in connection with the research you could contact the following representatives of Motilal Oswal Capital Markets Singapore Pte Limited:
Anosh Koppikar
Kadambari Balachandran
Email : anosh.Koppikar@motilaloswal.com
Email : kadambari.balachandran@motilaloswal.com
Contact : (+65)68189232
Contact : (+65) 68189233 / 65249115
Office Address : 21 (Suite 31),16 Collyer Quay,Singapore 04931
For Singapore
19 January 2015
Motilal Oswal Securities Ltd
Motilal Oswal Tower, Level 9, Sayani Road, Prabhadevi, Mumbai 400 025
Phone: +91 22 3982 5500 E-mail: reports@motilaloswal.com
10