19 January 2015
2QFY15 Results Update | Sector:
Consumer
Symphony
BSE SENSEX
28,262
Bloomberg
Equity Shares (m)
M.Cap. (INR b) / (USD b)
52-Week Range (INR)
1, 6, 12 Rel. Per (%)
Avg Val (INR M)/Vol ‘000
Free float (%)
S&P CNX
8,551
SYML IN
35.0
78.1/1.3
2,255/401
10/92/425
38/36
25.0
CMP: INR2,231
TP: INR2,100 (-6%)
Neutral
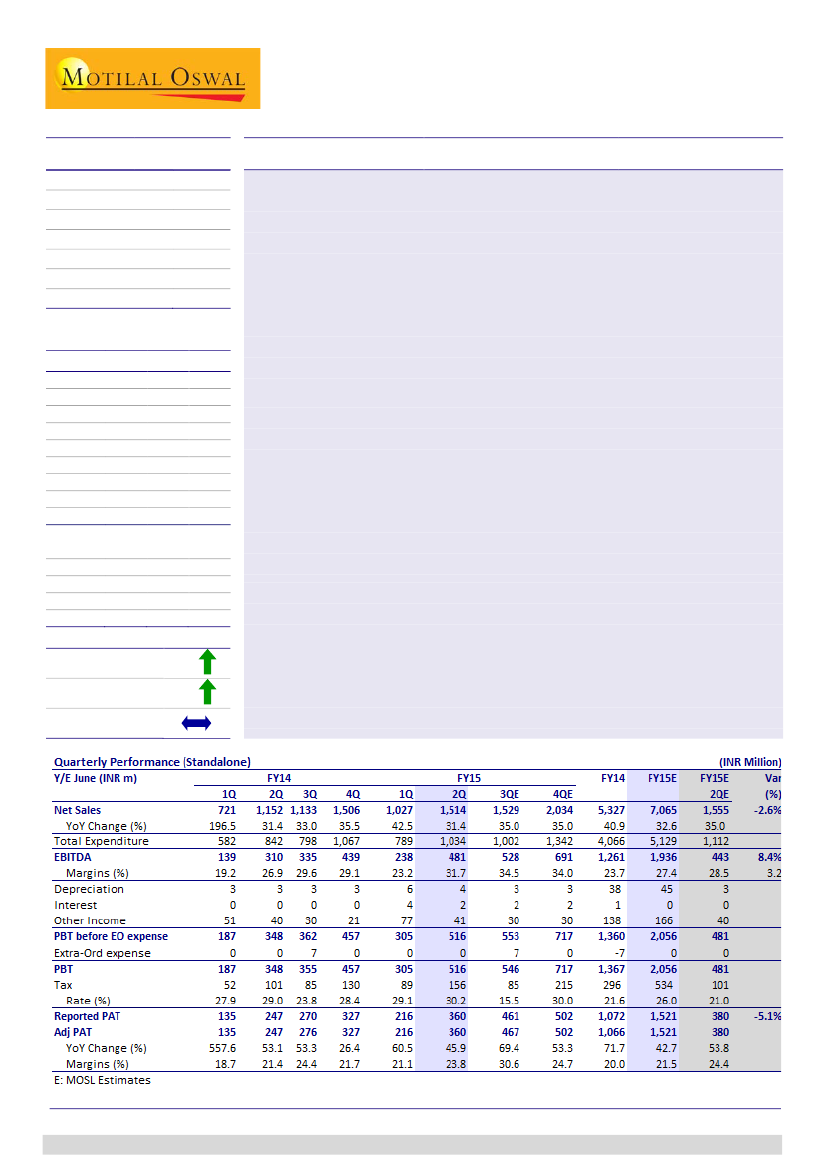
Revenue and PAT post marginal miss, EBITDA margin expansion robust
Symphony (SYML) posted a revenue of INR1.51b (est. INR1.55b) in 2QFY15, compared
to INR1.15b in 2QFY14, marking a YoY growth of 31.4%. During the quarter, company
witnessed 27.4% volume growth with total volumes aggregating to 2.4 lakh coolers,
while realizations grew 1.5% YoY from INR6,183/unit to INR6,277/unit. Domestic
revenue grew by 33.5% YoY to INR1.40b, while exports grew 10% YoY to INR113m.
EBITDA grew by 54.8% this quarter to INR481m, EBITDA margin stood at 31.7% in
2QFY15, compared to 26.9% in 2QFY14 (an expansion of 480bp YoY), largely on
account of better sales mix, softening of commodity prices and higher economies of
scale. Hence, PAT for 2QFY15 stood at INR360m (est. INR380m), compared to
INR247m in 2QFY14, marking a YoY growth of 46%.
Replicating asset light business model in Impco business:
Management is exploring
the possibility of outsourced manufacturing for Impco, with an aim to make the
business asset light, similar to its India operations. Further, management plans to
monetize Impco assets like plant and machinery and real estate, resulting in proceeds
of ~INR0.4b. We believe re-modeling of Impco into an asset light model will ensure
focus on R&D, marketing and product development activities thus resulting in superior
performance of the business. Also, Impco too could turn into a high RoCE and scalable
business, similar to domestic operations.
Valuation and view:
We raise FY15E, FY16E and FY17E earnings estimates by 5%, 11%
and 22% to reflect higher margins led by new product innovations. Given its leadership
with 50% market share, asset light business model (~72% RoCE), huge growth
opportunity in air coolers due to 8% penetration and expected shift from unorganized
(80% of market) to organized, we believe SYML deserves premium multiple of 25x
FY17E EPS, against its five-year average multiple of 15x one-year forward. We value
the stock at 25x FY17E EPS and arrive at a target price of INR2,100. Maintain
Neutral.
Financials & Valuation (INR Billion)
Y/E JUN
Sales
EBITDA
NP
EPS (INR)
EPS Gr. (%)
BV/Sh (INR)
RoE (%)
RoCE (%)
Payout (%)
Valuations
P/E (x)
P/BV (x)
EV/EBITDA
Div. Yld (%)
EV/Sales (x)
2015E 2016E 2017E
7.1
1.9
1.5
43.5
43.1
100.1
48.6
65.7
51.1
51.3
22.3
40.0
0.9
11.0
9.2
2.8
2.2
61.9
42.4
129.3
54.0
73.0
52.9
36.0
17.3
27.6
1.3
8.3
12.0
3.8
2.9
84.3
36.2
169.1
56.5
76.4
52.7
26.5
13.2
19.8
1.7
6.3
Estimate change
TP change
Rating change
22%
50%
Niket Shah
(Niket.Shah@MotilalOswal.com); +91 22 3982 5426
Atul Mehra
(Atul.Mehra@MotilalOswal.com); +91 22 3982 5417
Investors are advised to refer through disclosures made at the end of the Research Report.

Symphony
Revenue growth marginally below expectations
Symphony Limited revenue of INR1,514m (est. INR1555m) in 2QFY15 as
compared to INR1,152m in 2QFY14, marking a YoY growth of 31.4%.
Volume growth stood at 27.4% with total volumes aggregating 2.4 lakh coolers,
realizations grew 1.5% YoY from INR 6,183/unit to INR6,277/unit.
Domestic revenues grew 33.5% YoY to INR1,401m, while exports grew 10% YoY
to INR113m. Exports were impacted by political turmoil in Egypt, Syria and Iraq.
During the quarter, SYML launched two new models in the window air cooler
segment, as well as launched packaged air coolers in the industrial segment
which deliver cooling in the range of 4k to 10k cfm (cubic feet per minute).
Package air coolers are ready to use, easy and faster to install air coolers as
against regular coolers. Initial response has been positive. SYML has also
received trial orders from banks branches which can be scaled up going forward.
Exhibit 2: Domestic and export mix
YoY Growth
Exports
Domestic
14% 16% 17% 17% 15% 3% 15% 15% 7% 9% 19% 13% 7% 7%
Exhibit 1: Revenue growth trend
Total revenue (INR m)
197%
1,506
1,514
877
1,027
1,152
1,133
852 1,112
780 871
56%
562
48%
36% 42% 31%
28%
721
24%
9%
5%
-16%
-22%
31% 33%
288
243
86% 84% 83% 83% 85% 97% 85% 85% 93% 91% 81% 87% 93% 93%
Source: Company, MOSL
Exhibit 3: Domestic revenue trend
Domestic (INR m)
950
724
669
1,049
917
1,310
1,401
956
Exhibit 4: Export revenue trend
Export (INR m)
135 146
89
40
37 27
51
162
128
103
113
71
216
196
473
248
645 725
207
850
Source: Company, MOSL
Exhibit 5: Volumes trend
Volume (units)
213,016
187,389
169,350
187,718
155,679
140,599
118,921
51,145
238,668
Exhibit 6: Realizations trend
Realization (INR)
5,522
6,062
6,566
6,035 6,183 5,986
6,927
6,183 6,277
163,987
4,750
Source: Company, MOSL
19 January 2015
Source: Company, MOSL
2

Symphony
EBITDA margin expansion robust; PAT growth marginally below estimates
During the quarter, company posted gross margins of 56% as against 55%
helped by softening of commodity prices and higher contribution of new
products (which have higher margins). This is despite excise duty hike of 2%.
EBITDA grew by 54.8% this quarter to INR481m, EBITDA margins stood at 31.7%
in 2QFY15 as compared to 26.9% in 2QFY14 an expansion of 480bps YoY largely
on account of higher economies of scale (with other expenses declining 330bp).
Consequently, PAT for 2QFY15 stood at INR360m (est.INR380m) as compared to
INR247m in 2QFY14 marking a YoY growth of 46%.
Exhibit 8: EBITDA and EBITDA margins trend
61%
56%
54%
EBITDA (INR m)
EBITDA margin (%)
29% 27% 27% 30%
28%
24.5% 25%
23%
29%
19%
10.9%
32%
23%
Exhibit 7: Gross margin trend
Gross margin
52%
52%
54%
58%
49%
56% 60%
51%
53%
55%
56%
1%
31 138 199 246 2 202 247 301 139 310 335 439 238 481
Source: Company, MOSL
Exhibit 9: PAT trend
PAT (INR m)
PAT growth (YoY)
558%
259
112
44
-57%
-46%
197
150
346%
27%
161
-54% 44%
21
180
20% 32%
135
247
270
216
26%
60%
46%
327
360
53% 50%
Source: Company, MOSL
Gross margins sustainable; EBITDA margins to expand going forward
Management guided that gross margins are sustainable at current levels of 56%.
Going forward, EBITDA margins could expand further as with a completely
outsourced business model, most of the costs are largely fixed, thus higher scale
of revenues to result in higher EBITDA margins.
For example, employee cost as reported is purely white-collar employee cost;
since production is outsourced, labor cost forms part of cost of goods sold.
19 January 2015
3

Symphony
Replicating asset light business model in Impco business
Management is exploring the possibility of outsourced manufacturing for Impco,
with an aim to make the business asset light, similar to its India operations.
Company is in the process of identifying OEMs in Mexico and re-modeling of
business will happen in phases; post which company will solely focus on R&D,
marketing and product development activities.
Further; management plans to monetize Impco’s assets like plant and machinery
and real estate, resulting in proceeds of ~INR0.4b.
The funds will be utilized to retire debt on Impco books and enable it to fund its
own working capital.
We believe re-modeling of Impco into an asset light model will ensure focus on
R&D, marketing and product development activities thus resulting in superior
performance of the business.
Additionally, Impco too could turn into a high RoCE and scalable business,
similar to domestic operations.
Payout at 50%; to consider inorganic opportunities for market access
Management highlighted that as per its dividend policy, it will payout at least
50% of annual profits.
Further, management is looking for inorganic opportunities in overseas markets
to gain market access. Some portion of cash on books will be utilized for
inorganic opportunities, while rest will stay in company as a safety buffer.
Total cash on books stood at INR2.05b as on 2QFY15.
Other conference call highlights
Total air cooler market is estimated to be ~6m units of which organized sector is
20%. SYML has 50% market share in organized market in value terms.
SYML has been able to maintain its market share due to singular focus on air
coolers, innovation in products and expansion in distribution network.
Current installed capacity at Surat is 200,000 units and operating at 65%
utilization level. Surat SEZ enjoys 100% tax exemption for first five years,
followed by 50% tax exemption for the following five years.
As Surat SEZ enters its 5
th
year of operations in FY16, 100% tax exemption from
this unit will continue for one more year.
Post expiration of 100% tax benefits in Surat SEZ, SYML plans to move the
export business to Kutch SEZ where it has a capacity of 100,000 units, which can
be scaled up to 200,000 units without any material capex.
Ad spend during 1HFY15 is negligible as 80-90% of the A&P spend is conducted
during the summer season which falls in 2H.
Organized retail contributes 11% to revenues.
SYML is launching specific products for the e-commerce market in order to cater
to this channel in a better manner, and at the same time ensuring minimal
impact of aggressive practices followed by e-commerce companies on
traditional retailing channel.
Export market at 7m units is a large opportunity, and management believes it
offers substantial growth opportunity from a longer term perspective.
19 January 2015
4

Symphony
Valuation and View
We value SYML at 25x FY17E EPS, higher than its historic 5 year average multiple of
15.3x, which we believe is justified considering:
Huge untapped opportunity:
High and rising temperature levels are leading to
greater demand for cooling solutions. While 54% (143m households) of Indian
households live in hot and dry climatic conditions and 4% live in moderate
climatic conditions, only about 8% own Air Coolers thereby providing huge
opportunity for growth. Considering lower cost of ownership vs Air Conditioners
(70% lower capital costs / 90% lower running costs), Air Coolers are the mass
market option for Indian consumers.
Market to shift from unorganized to organized:
Consumer up-trading is shifting
demand towards organized players in a number of consumer categories led by
key reasons like: (1) rising income and aspiration levels, (2) greater
quality/brand awareness, and (3) reducing taxation differences. Large part of
the cooler industry is unorganized at 80% (4m units) which makes the market
potential for organized players (1m units) even larger.
SYML enjoys market leadership with 50% market share:
SYML is the pioneer in
the industry and commands a 50% market share followed by Kenstar (35%),
Bajaj Electricals (15%), and Usha. It commands 10-12% pricing premium over
competitors, due to consistent product innovation and strong brand equity.
Strong return ratios:
SYML reports strong return on capital with core standalone
RoCE standing at 237% for 2QFY15. High margins (~30%) coupled with 100%
outsourcing and 100% advance from distributors on domestic sales helps SYML
to earn high returns on its capital employed. SYML has chosen to focus on its
key strengths - innovation, marketing and brand building. We expect SYML to
continue reporting strong RoCE on the back of its strong business model.
We believe the following factors can pose risks to our estimates:
Seasonality in demand poses inventory risk:
The demand for SYML’s products is
seasonal – 1Q is the worst quarter and 4Q is the best. 4Q is the best quarter due
to summer in India and 1Q is the worst due to monsoon. If in a particular year,
the summer is mild, SYML’s sales may be impacted, exposing it to inventory risk.
Product concentration risk:
Air Coolers constitute 100% of SYML’s sales. Any
new invention in the cooling equipment industry poses a risk to the business.
Exhibit 10: Price to earnings (One year forward)
48
40
32
24
16
8
0
15.3
P/E (x)
5 Yrs Avg(x)
42.7
Exhibit 11: Price to book (One year forward)
20.0
15.0
10.0
5.0
0.0
5.5
P/B (x)
5 Yrs Avg(x)
18.7
Source: MOSL
Source: MOSL
19 January 2015
5

Symphony
Quarterly metrics
Exhibit 12:
1QFY13
Revenue contribution
Domestic
Exports
Volume trend
Volume (units)
YoY growth
Realisation trend
Realization (INR)
YoY growth
4,750
NA
5,522
NA
6,062
NA
6,566
NA
6,035
27%
6,183
12%
5,986
-1%
6,927
6%
6,183
2%
6,277
2%
51,145
NA
155,679
NA
140,599
NA
169,350
NA
118,921
133%
187,389
20%
187,718
34%
213,016
26%
163,987
38%
238,668
27%
85%
15%
97%
3%
85%
15%
85%
15%
93%
7%
91%
9%
81%
19%
87%
13%
93%
7%
93%
7%
2QFY13
3QFY13
4QFY13
1QFY14
2QFY14
3QFY14
4QFY14
1QFY15
2QFY15
Source: Company, MOSL
19 January 2015
6

Symphony
Story in charts
Exhibit 13: Market Penetration
66%
Bajaj, 15%
Exhibit 14: Market Share
Others, 5%
8%
4%
Kenstar,
30%
Air Conditioners
Air Coolers
Fans
Symphony,
50%
Source: Company, MOSL
Exhibit 15: Market Distribution (%)
Organized,
20%
Exhibit 16: Advertising spend as a % of sales
4.4%
3.2%
4.3%
3.7%
4.8%
4.2%
Unorganized,
80%
Source: Company, MOSL
FY09
FY10
FY11
FY12
FY13
FY14
Source: Company, MOSL
Exhibit 17: Dealer network
Exhibit 18: RoCE (%)
65.7
54.6
42.4
43.7
73.0
FY07
FY08
FY09
FY10
FY11
FY12
FY13
FY14
FY12
FY13
FY14
FY15E
FY16E
Source: Company, MOSL
19 January 2015
7

Symphony
Key Assumptions
Exhibit 19: Key assumptions
FY08
Quantity sold
Domestic coolers
Exports coolers
Geysers / Others
Total units sold
Volume growth
Domestic coolers
Exports coolers
Blended volume growth
Realisation (INR per unit)
Domestic coolers
Exports coolers
Blended realisation
Realisation growth %
Domestic coolers
Exports coolers
Blended realisation growth
0%
0%
5%
-10%
1%
-6%
-11%
-6%
5%
123%
25%
8%
10%
10%
9%
1%
6%
10%
10%
9%
10%
10%
9%
8%
10%
9%
8%
10%
9%
5,030
3,800
4,733
5,300
3,437
4,797
4,984
3,069
4,504
5,246
6,844
5,641
5,659
7,535
6,187
6,156
7,599
6,566
6,771
8,359
7,188
7,448
9,195
7,867
8,044
10,115
8,540
8,688
11,126
9,272
44%
208%
69%
72%
36%
62%
17%
39%
22%
0%
-2%
-2%
22%
0%
14%
25%
25%
29%
25%
25%
21%
20%
20%
20%
20%
20%
20%
124,455
24,168
6,208
154,831
178,678
74,398
8,310
261,386
306,979
101,061
14,291
422,331
358,911
140,811
15,095
514,817
357,819
138,030
10,675
506,524
437,060
137,690
409
575,159
546,325
172,113
0
718,438
682,906
215,141
0
898,047
819,488
258,169
0
1,077,656
983,385
309,803
0
1,293,188
FY09
FY10
FY11
FY12
FY13
FY14
FY15E
FY16E
FY17E
Source: Company, MOSL
19 January 2015
8

Symphony
Corporate profile
Company description
SYML is the largest Air Cooler company in India, with
50% share (40% volume market share) in the domestic
organized market, followed by Kenstar (35%), Bajaj
Electricals (15%), and Usha, among others. It commands
10-12%
pricing
premium
over
competitors,
demonstrating its strong brand equity. SYML has a wide
range of Air Coolers like Diet (three models), Desert
(three models), Room (four models) and Personal (three
models). Its pan India network consists of 800+
distributors who in turn have 16,400+ retail dealers. Its
international network is spread across 60 countries
including USA, Mexico, Middle East, Europe, Africa, and
South East Asia.
Exhibit 20: Sensex rebased
Exhibit 21: Shareholding pattern (%)
Sep-14
Promoter
DII
FII
Others
75.0
2.7
3.8
18.5
Jun-14
75.0
2.2
3.5
19.3
Sep-13
75.0
2.5
3.4
19.1
Exhibit 22: Top holders
Holder Name
Rowenta Networks Pvt Ltd
Matthews India Fund
Axis Mutual Fund Trustee Ltd A/c Axis Mutual Fund A/c
%
Holding
3.8
3.2
1.1
Note: FII Includes depository receipts
Exhibit 23: Top management
Name
Achal Bakeri
Designation
Chairman & MD
Exhibit 24: Directors
Name
Achal Bakeri
Dipak Palkar
Himanshu Shah
Nrupesh Shah
Satyen Kothari
*Independent
Name
Jonaki Bakeri
Chandrakant Gandhi
Exhibit 25: Auditors
Name
Shah & Dalal
Dalwadi & Associates
Type
Statutory
Cost Auditor
Exhibit 26: MOSL forecast v/s consensus
EPS (INR)
FY15
FY16
FY17
MOSL forecast
43.5
61.9
84.3
Consensus
forecast
38.5
50.1
64.0
Variation (%)
13.0
23.5
31.8
19 January 2015
9

Symphony
Financials and valuations
Consolidated - Income Statement
Y/E June
Net Sales
Change (%)
Total Expenditure
EBITDA
Margin (%)
Depreciation
EBIT
Int. and Finance Charges
Other Income - Rec.
PBT bef. EO Exp.
EO Expense/(Income)
PBT after EO Exp.
Current Tax
Deferred Tax
Tax Rate (%)
Reported PAT
PAT Adj for EO items
Change (%)
Margin (%)
Net Profit
No of fully diluted shares (Mn - FV: Rs10)
Adj EPS
FY10
1,902
53.2
1,368
535
28.1
13
522
6
38
554
0
554
187
-3
33.2
370
370
-14.6
19.5
370
35.0
10.6
FY11
2,906
52.7
2,214
692
23.8
53
639
4
122
756
0
756
213
31
32.3
512
512
38.4
17.6
512
35.0
14.6
FY12
3,135
7.9
2,409
726
23.2
49
677
8
63
733
0
733
196
6
27.5
531
531
3.8
16.9
531
35.0
15.2
FY13
3,780
20.6
2,992
788
20.9
39
749
3
167
913
0
912
296
15
34.1
602
602
13.3
15.9
602
35.0
17.2
FY14
5,327
40.9
4,066
1,261
23.7
38
1,223
1
138
1,360
7
1,353
295
1
21.9
1,057
1,063
76.6
20.0
1,063
35.0
30.4
FY15E
7,065
32.6
5,129
1,936
27.4
45
1,890
0
166
2,056
0
2,056
534
0
26.0
1,521
1,521
43.1
21.5
1,521
35.0
43.5
FY16E
9,203
30.3
6,428
2,776
30.2
48
2,728
0
199
2,927
0
2,927
761
0
26.0
2,166
2,166
42.4
23.5
2,166
35.0
61.9
FY17E
11,990
30.3
8,194
3,796
31.7
49
3,747
0
238
3,985
0
3,985
1,036
0
26.0
2,949
2,949
36.2
24.6
2,949
35.0
84.3
Consolidated - Balance Sheet
Y/E June
Equity Share Capital
Reserves
Net Worth
Minority Interest
Deferred Liabilities
Total Loans
Capital Employed
Gross Block
Less: Accum. Deprn.
Net Fixed Assets
Capital WIP
Total Investments
Curr. Assets, Loans&Adv.
Inventory
Account Receivables
Cash and Bank Balance
Loans and Advances
Curr. Liability & Prov.
Account Payables
Provisions
Net Current Assets
Appl. of Funds
FY10
70
794
864
0
7
1
872
196
66
130
0
535
432
65
121
28
218
224
149
75
208
872
FY11
70
1,455
1,525
0
45
2
1,572
1,553
849
704
0
117
1,311
698
386
47
180
560
478
82
750
1,572
FY12
70
1,821
1,891
0
55
74
2,021
1,650
949
701
1
620
1,455
429
422
226
377
757
523
234
698
2,021
FY13
70
2,152
2,222
0
75
0
2,298
1,736
1,041
696
36
988
1,443
430
377
447
189
866
537
329
578
2,297
FY14
70
2,688
2,758
0
5
0
2,763
1,753
1,057
696
82
1,986
1,168
385
416
57
311
1,170
639
530
-1
2,763
FY15E
70
3,432
3,501
0
5
0
3,507
1,886
1,103
783
0
1,986
2,066
486
551
656
374
1,328
806
522
738
3,507
FY16E
70
4,451
4,521
0
5
0
4,527
1,936
1,151
785
0
1,986
3,320
598
718
1,555
448
1,565
993
571
1,756
4,527
FY17E
70
5,846
5,915
0
5
0
5,921
1,986
1,200
786
0
1,986
5,035
759
936
2,802
538
1,887
1,261
626
3,149
5,921
19 January 2015
10

Symphony
Financials and valuations
Ratios
Y/E June
Basic (INR)
EPS
Cash EPS
BV/Share
DPS
Payout (%)
Valuation (x)
P/E
Cash P/E
P/BV
EV/Sales
EV/EBITDA
Dividend Yield (%)
Return Ratios (%)
RoE
RoCE
Working Capital Ratios
Asset Turnover (x)
Inventory (Days)
Debtor (Days)
Leverage Ratio (x)
Current Ratio
FY10
10.6
10.9
24.7
0.5
5.5
211.0
203.8
90.3
41.0
146.0
0.0
53.7
80.9
FY11
14.6
16.2
43.6
2.0
15.9
152.5
138.1
51.2
26.9
112.8
0.1
42.8
63.6
FY12
15.2
16.6
54.0
5.5
42.1
147.0
134.7
41.3
24.9
107.4
0.2
31.1
42.4
FY13
17.2
18.3
63.5
6.5
44.2
129.8
121.8
35.1
20.5
98.5
0.3
29.3
43.7
FY14
30.4
31.5
78.8
13.0
50.3
73.4
70.9
28.3
14.6
61.9
0.6
42.7
54.6
FY15E
43.5
44.8
100.1
19.0
51.1
51.3
49.8
22.3
11.0
40.0
0.9
48.6
65.7
FY16E
61.9
63.3
129.3
28.0
52.9
36.0
35.3
17.3
8.3
27.6
1.3
54.0
73.0
FY17E
84.3
85.7
169.1
38.0
52.7
26.5
26.0
13.2
6.3
19.8
1.7
56.5
76.4
2.2
12.4
23
1.8
87.6
48
1.6
50.0
49
1.6
41.5
36
1.9
26.4
28
2.0
25.1
28
2.0
23.7
28
2.0
23.1
28
1.9
2.3
1.9
1.7
1.0
1.6
2.1
2.7
Consolidated - Cash Flow Statement
Y/E June
NP / (Loss) Before Tax and EO Items
Depreciation
Interest & Finance Charges
Direct Taxes Paid
(Inc)/Dec in WC
CF from Operations
Others
CF from Operating incl EO
(inc)/dec in FA
(Pur)/Sale of Investments
Others
CF from Investments
(Inc)/Dec in Debt
Interest Paid
Dividend Paid
Others
CF from Fin. Activity
Inc/Dec of Cash
Add: Beginning Balance
Closing Balance
FY10
554
13
-13
282
44
316
-8
308
-77
-191
-9
-277
-2
-8
-6
0
-16
14
14
28
FY11
756
53
-3
257
-540
9
-15
-6
-223
388
17
182
1
-4
-18
-136
-157
19
28
47
FY12
733
49
-20
187
284
858
-15
843
-38
-503
-357
-898
73
-8
-68
237
234
179
47
226
FY13
913
39
-61
241
60
709
-42
668
-67
-368
284
-151
-74
-3
-219
1
-296
221
226
447
FY14
1,353
38
-59
374
1
959
-55
904
-94
-998
128
-965
0
-1
-342
12
-330
-391
447
57
FY15E
2,056
45
-166
534
-140
1,262
0
1,262
-50
0
166
116
0
-1
-778
0
-779
599
57
656
FY16E
2,927
48
-199
761
-118
1,897
0
1,897
-50
0
199
149
0
0
-1,146
0
-1,146
900
656
1,555
FY17E
3,985
49
-238
1,036
-146
2,614
0
2,614
-50
0
238
188
0
0
-1,555
0
-1,555
1,247
1,555
2,802
19 January 2015
11

This document has been prepared by Motilal Oswal Securities Limited (hereinafter referred to as Most) to provide information about the company(ies) and/sector(s), if any, covered in the report and may be
Symphony
distributed by it and/or its affiliated company(ies). This report is for personal information of the selected recipient/s and does not construe to be any investment, legal or taxation advice to you. This research report does
not constitute an offer, invitation or inducement to invest in securities or other investments and Motilal Oswal Securities Limited (hereinafter referred as MOSt) is not soliciting any action based upon it. This report is not
for public distribution and has been furnished to you solely for your general information and should not be reproduced or redistributed to any other person in any form. This report does not constitute a personal
recommendation or take into account the particular investment objectives, financial situations, or needs of individual clients. Before acting on any advice or recommendation in this material, investors should consider
whether it is suitable for their particular circumstances and, if necessary, seek professional advice. The price and value of the investments referred to in this material and the income from them may go down as well as
up, and investors may realize losses on any investments. Past performance is not a guide for future performance, future returns are not guaranteed and a loss of original capital may occur.
MOSt and its affiliates are a full-service, integrated investment banking, investment management, brokerage and financing group. We and our affiliates have investment banking and other business relationships with a
some companies covered by our Research Department. Our research professionals may provide input into our investment banking and other business selection processes. Investors should assume that MOSt and/or
its affiliates are seeking or will seek investment banking or other business from the company or companies that are the subject of this material and that the research professionals who were involved in preparing this
material may educate investors on investments in such business. The research professionals responsible for the preparation of this document may interact with trading desk personnel, sales personnel and other
parties for the purpose of gathering, applying and interpreting information. Our research professionals are paid on the profitability of MOSt which may include earnings from investment banking and other business.
MOSt generally prohibits its analysts, persons reporting to analysts, and members of their households from maintaining a financial interest in the securities or derivatives of any companies that the analysts cover.
Additionally, MOSt generally prohibits its analysts and persons reporting to analysts from serving as an officer, director, or advisory board member of any companies that the analysts cover. Our salespeople, traders,
and other professionals or affiliates may provide oral or written market commentary or trading strategies to our clients that reflect opinions that are contrary to the opinions expressed herein, and our proprietary
trading and investing businesses may make investment decisions that are inconsistent with the recommendations expressed herein. In reviewing these materials, you should be aware that any or all of the foregoing
among other things, may give rise to real or potential conflicts of interest. MOSt and its affiliated company(ies), their directors and employees and their relatives may; (a) from time to time, have a long or short position
in, act as principal in, and buy or sell the securities or derivatives thereof of companies mentioned herein. (b) be engaged in any other transaction involving such securities and earn brokerage or other compensation
or act as a market maker in the financial instruments of the company(ies) discussed herein or act as an advisor or lender/borrower to such company(ies) or may have any other potential conflict of interests with
respect to any recommendation and other related information and opinions.; however the same shall have no bearing whatsoever on the specific recommendations made by the analyst(s), as the recommendations
made by the analyst(s) are completely independent of the views of the affiliates of MOSt even though there might exist an inherent conflict of interest in some of the stocks mentioned in the research report
Reports based on technical and derivative analysis center on studying charts company's price movement, outstanding positions and trading volume, as opposed to focusing on a company's fundamentals and, as
such, may not match with a report on a company's fundamental analysis. In addition MOST has different business segments / Divisions with independent research separated by Chinese walls catering to different set
of customers having various objectives, risk profiles, investment horizon, etc, and therefore may at times have different contrary views on stocks sectors and markets.
Unauthorized disclosure, use, dissemination or copying (either whole or partial) of this information, is prohibited. The person accessing this information specifically agrees to exempt MOSt or any of its affiliates or
employees from, any and all responsibility/liability arising from such misuse and agrees not to hold MOSt or any of its affiliates or employees responsible for any such misuse and further agrees to hold MOSt or any of
its affiliates or employees free and harmless from all losses, costs, damages, expenses that may be suffered by the person accessing this information due to any errors and delays. The information contained herein is
based on publicly available data or other sources believed to be reliable. Any statements contained in this report attributed to a third party represent MOSt’s interpretation of the data, information and/or opinions
provided by that third party either publicly or through a subscription service, and such use and interpretation have not been reviewed by the third party. This Report is not intended to be a complete statement or
summary of the securities, markets or developments referred to in the document. While we would endeavor to update the information herein on reasonable basis, MOSt and/or its affiliates are under no obligation to
update the information. Also there may be regulatory, compliance, or other reasons that may prevent MOSt and/or its affiliates from doing so. MOSt or any of its affiliates or employees shall not be in any way
responsible and liable for any loss or damage that may arise to any person from any inadvertent error in the information contained in this report. MOSt or any of its affiliates or employees do not provide, at any time,
any express or implied warranty of any kind, regarding any matter pertaining to this report, including without limitation the implied warranties of merchantability, fitness for a particular purpose, and non-infringement.
The recipients of this report should rely on their own investigations.
This report is intended for distribution to institutional investors. Recipients who are not institutional investors should seek advice of their independent financial advisor prior to taking any investment decision based on
this report or for any necessary explanation of its contents.
Most and it’s associates may have managed or co-managed public offering of securities, may have received compensation for investment banking or merchant banking or brokerage services, may have received any
compensation for products or services other than investment banking or merchant banking or brokerage services from the subject company in the past 12 months.
Most and it’s associates have not received any compensation or other benefits from the subject company or third party in connection with the research report.
Subject Company may have been a client of Most or its associates during twelve months preceding the date of distribution of the research report
MOSt and/or its affiliates and/or employees may have interests/positions, financial or otherwise of over 1 % at the end of the month immediately preceding the date of publication of the research in the securities
mentioned in this report. To enhance transparency, MOSt has incorporated a Disclosure of Interest Statement in this document. This should, however, not be treated as endorsement of the views expressed in the
report.
Motilal Oswal Securities Limited is under the process of seeking registration under SEBI (Research Analyst) Regulations, 2014.
There are no material disciplinary action that been taken by any regulatory authority impacting equity research analysis activities
Analyst Certification
The views expressed in this research report accurately reflect the personal views of the analyst(s) about the subject securities or issues, and no part of the compensation of the research analyst(s) was, is, or will be
directly or indirectly related to the specific recommendations and views expressed by research analyst(s) in this report. The research analysts, strategists, or research associates principally responsible for preparation
of MOSt research receive compensation based upon various factors, including quality of research, investor client feedback, stock picking, competitive factors and firm revenues
Disclosure of Interest Statement
Analyst ownership of the stock
Served as an officer, director or employee
SYMPHONY
No
No
Disclosures
Regional Disclosures (outside India)
For U.S.
This report is not directed or intended for distribution to or use by any person or entity resident in a state, country or any jurisdiction, where such distribution, publication, availability or use would be contrary to law,
regulation or which would subject MOSt & its group companies to registration or licensing requirements within such jurisdictions.
Motilal Oswal Securities Limited (MOSL) is not a registered broker - dealer under the U.S. Securities Exchange Act of 1934, as amended (the"1934 act") and under applicable state laws in the United States. In
addition MOSL is not a registered investment adviser under the U.S. Investment Advisers Act of 1940, as amended (the "Advisers Act" and together with the 1934 Act, the "Acts), and under applicable state laws in the
United States. Accordingly, in the absence of specific exemption under the Acts, any brokerage and investment services provided by MOSL, including the products and services described herein are not available to or
intended for U.S. persons.
This report is intended for distribution only to "Major Institutional Investors" as defined by Rule 15a-6(b)(4) of the Exchange Act and interpretations thereof by SEC (henceforth referred to as "major institutional
investors"). This document must not be acted on or relied on by persons who are not major institutional investors. Any investment or investment activity to which this document relates is only available to major
institutional investors and will be engaged in only with major institutional investors. In reliance on the exemption from registration provided by Rule 15a-6 of the U.S. Securities Exchange Act of 1934, as amended (the
"Exchange Act") and interpretations thereof by the U.S. Securities and Exchange Commission ("SEC") in order to conduct business with Institutional Investors based in the U.S., MOSL has entered into a chaperoning
agreement with a U.S. registered broker-dealer, Motilal Oswal Securities International Private Limited. ("MOSIPL"). Any business interaction pursuant to this report will have to be executed within the provisions of this
chaperoning agreement.
The Research Analysts contributing to the report may not be registered /qualified as research analyst with FINRA. Such research analyst may not be associated persons of the U.S. registered broker-dealer, MOSIPL,
and therefore, may not be subject to NASD rule 2711 and NYSE Rule 472 restrictions on communication with a subject company, public appearances and trading securities held by a research analyst account.
Motilal Oswal Capital Markets Singapore Pte Limited is acting as an exempt financial advisor under section 23(1)(f) of the Financial Advisers Act(FAA) read with regulation 17(1)(d) of the Financial Advisors
Regulations and is a subsidiary of Motilal Oswal Securities Limited in India. This research is distributed in Singapore by Motilal Oswal Capital Markets Singapore Pte Limited and it is only directed in Singapore to
accredited investors, as defined in the Financial Advisers Regulations and the Securities and Futures Act (Chapter 289), as amended from time to time.
In respect of any matter arising from or in connection with the research you could contact the following representatives of Motilal Oswal Capital Markets Singapore Pte Limited:
Anosh Koppikar
Kadambari Balachandran
Email : anosh.Koppikar@motilaloswal.com
Email : kadambari.balachandran@motilaloswal.com
Contact : (+65)68189232
Contact : (+65) 68189233 / 65249115
Office Address : 21 (Suite 31),16 Collyer Quay,Singapore 04931
For Singapore
Motilal Oswal Securities Ltd
19 January 2015
Motilal Oswal Tower, Level 9, Sayani Road, Prabhadevi, Mumbai 400 025
Phone: +91 22 3982 5500 E-mail: reports@motilaloswal.com
12