27 January 2015
Metals Weekly
Valuations: Indian companies
Company
Steel
Ta ta Steel
SAIL
JSW Steel
JSPL
NMDC
Non-Ferrous
Hi nda l co
SSLT
HZL
Na l co
Price EV/EBITDA (x) P/B (x)
(INR) FY15E FY16E FY14
403
78
1013
158
139
145
205
166
49
7.2
9.3
6.5
9.0
4.4
7.9
6.3
4.8
3.1
6.1
8.3
6.5
8.8
5.5
6.7
5.7
4.0
1.9
1.6
0.7
1.1
0.6
1.8
1.3
0.8
1.6
0.9
Metal Prices
CMP
23-Jan
Week
%
16-Jan
Quarter
%
1-Jan
YTD FY15
%
1-Apr
TMT- Mumba i (INR/ton)
HRC- Mumba i (INR/ton)
HRC (USD/ton) fob CIS
33,000
29,174
430
-1 33,400
-3 29,947
-4
450
-1 19,900
-1 21,500
-3
69
-4
107
-4
308
2
1
-1
2
2
-2
-1
1
12
1,799
111
4,115
2,057
127
655
5,660
348
211
-4 34,200
-13 33,395
-4
448
2 19,400
-2 21,900
-1
67
-6
110
-3
307
0 1,831
-3
116
-3 4,210
-3 2,167
-6
137
-7
692
-12 6,359
-13
401
34
177
5 26,774
9 36,519
0 1,853
-1 1.12
-6 35,200
-18 35,706
-16
510
-6 21,050
-16 25,300
-41
113
-8
112
-17
357
5 1,744
-3
116
-24 5,369
7 1,962
-6
137
-23
839
-16 6,632
-13
401
-9
261
-2 28,466
-7 42,594
-9 2,026
-1 1.12
Sponge i ron - Ra i pur (INR/ton)
19,800
Pi g i ron - Ra i pur (INR/ton)
21,367
Iron ore s pot (USD/ton) cfr Chi na
66
Coki ng coa l (USD/ton) fob Aus .
103
Shred. s cra p (USD/ton) Rotterda m
297
LME Spot (USD/ton)
Indi a n pri ces (INR ‘000/ton)
LME i nventori es (‘000 ton)
LME Spot (USD/ton)
Indi a n pri ces (INR ‘000/ton)
LME i nventori es (‘000 ton)
LME Spot (USD/ton)
Indi a n pri ces (INR ‘000/ton)
LME i nventori es (‘000 ton)
1,831
113
4,081
2,107
130
643
5,581
351
237
Note: Detailed table on pg 23
Source: MOSL
Valuations: Global companies
Price
Mining
AUD 29.38
BHP
AUD 2.13
FMG
Ri o Ti nto
AUD 56.86
USD 17.48
Va l e
Teck Res .
USD 12.73
STEEL
EUR 8.477
A. Mi tta l
KRW 268.5
Pos co
USD 21.33
US Steel
USD 44.33
Nucor
JPY 2498
JFE
BRL 8.92
Gerda u
CNY 6.25
Ba o Steel
NON FERROUS
USD 16.08
Al coa
NOK 43.7
Hydro
HKD 5.19
Rus a l
Note: Detailed on pg 23
EV/EBITDA (x) P/B (x)
CY15 CY16 CY15
6.1
4.3
5.7
4.2
6.3
5.0
7.6
4.0
8.6
8.1
6.4
7.5
6.8
9.7
13.4
6.2
4.6
6.7
5.0
5.9
4.8
6.9
3.7
6.6
6.9
5.8
6.7
6.1
6.4
7.7
1.5
0.6
1.5
0.6
0.5
0.3
0.5
0.7
1.7
0.8
1.1
0.8
1.4
1.2
1.3
Gol d (INR/10gms )
28,017
Sl i ver (INR/1kg)
39,639
Lea d Spot LME (USD/ton)
1,845
FC 6-8% C ba s i s 60% Cr (USD/l b Cr)
1.11
INR/USD
BDI
0 27,997
1 39,175
1 1,828
-1
1.12
61.4
0
61.6
-3 63.2
3 59.8
703
-7
753
-10
782
-47 1,316
Source: Meta l Bul l eti n, Bl oomberg, Steel Mi nt, MOSL
Steel prices continue to slide; LME ali recovers 2%
Ø
India long product (TMT Mumbai) prices fell 1% WoW. Sponge iron prices
were down 1% WoW and domestic scrap prices declined 3.2% WoW on
healthy supply of imported scrap. Pellet prices corrected 11% WoW on
tepid demand and lower iron ore prices.
Ø
India import HRC prices slipped again this week, down 2.6% WoW on
competitive Chinese imports.
Ø
A few regional iron ore miners lowered their prices by INR500-700/t.
Ø
Iron ore China cfr prices were down 3% WoW while coking coal prices
were down by 4% WoW. Thermal coal prices however rose 3% WoW.
Ø
EU HRC prices although were 1.3% higher WoW, spreads continue to
contract on impact of currency depreciation. Scrap prices also weakened,
down 4% WoW. Chinese domestic HRC prices slipped 4% WoW.
Ø
LME aluminum reversed its declining trend, rising 2% WoW.
Ø
LME zinc and lead were up 2%/1% WoW respectively. Copper was
however down 1% WoW.
Ø
Goa state government lifted the iron ore mining ban in the state. Lease
permits will soon be granted but EC/FC clearances will have to be
obtained before operations can resume. At current depressed global iron
ore prices (USD66) and high export tax (30%), operations will not be
attractive – EBITDA/t estimated to be below ~INR500.
Source: Bloomberg
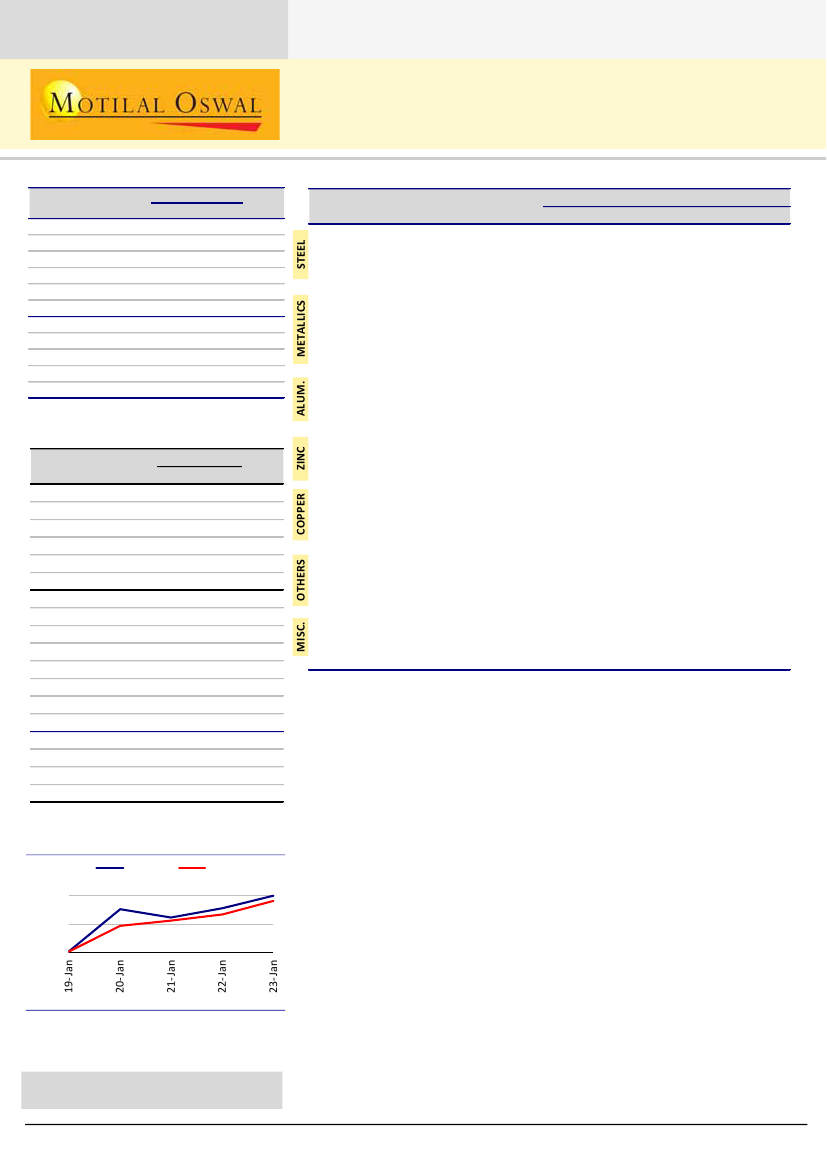
BSE Metals Index v/s Sensex
BSE Metal
Sensex
104
102
100
Source: Bloomberg
Note: Indexed to 100 on 19 Jan 2015
Stock performance table on pg 24
th
Investors are advised to refer through disclosures
made at the end of the Research Report.
Sanjay Jain
(SanjayJain@MotilalOswal.com); +91 22 3982 5412 /
Dhruv Muchhal
(Dhruv.Muchhal@MotilalOswal.com)

Metals Weekly
Contents
Page No.
Ferrous
India
European Union
China
Other regions
Steel raw material
Ferro alloys
3-10
3&4
5
6
7&8
9 & 10
11
Non-ferrous
Aluminum
Copper
Zinc
Lead
Commodity curve analysis
China non-ferrous trade data
12-18
12
14
15
16
17
18
Key indicators
Industrial production growth across the globe
BSE announcements
Metals valuation matrix
Metals stock performance
19-20
21
22
23
24
27 January 2015
2

Metals Weekly
Ferrous
Ferrous
INDIA
Indian flat steel prices import parity (INR/T, exl. ED & VAT)
India import HRC prices
were down USD10/t WoW
to USD430/t on
competitive offers
from China
40,000
38,000
36,000
34,000
32,000
30,000
28,000
HRC Mumbai (INR/t)
Indian long steel price (INR/T, exl. ED & VAT)
Long products (TMT
Mumbai) prices were
down 1.2% WoW to
INR33,000/t, declining for
the second consecutive
week
39,000
36,500
34,000
31,500
TMT Mumbai (INR/t)
Steel intermediates prices (INR/T, exl. ED & VAT)
Sponge iron prices were
down 0.5% WoW to
INR19,800/t
24,000
23,000
22,000
21,000
20,000
19,000
Sponge (Raipur)
India: Monthly crude steel production
India steel production
grew 2.4% YoY to 7.07mt
in December 2014. This
was slightly better than
2.3% YoY growth recorded
in November 2014
7.25
7.00
6.75
6.50
6.25
India
YoY (%)
15.0
10.0
5.0
0.0
-5.0
Source: SteelMint, WSA, MOSL
27 January 2015
3

Metals Weekly
Ferrous
Ferrous
INDIA
Scrap Mandi (INR/t)
28,000
26,500
25,000
23,500
22,000
India domestic scrap prices
were down 3.2% WoW to
INR22,450/t. Prices have
declined on availability of
imported
Scrap (Mandi)
Iron ore lumps (INR/t)
Domestic iron ore lump
prices were unchanged
WoW
9,000
8,000
7,000
6,000
5,000
4,000
NMDC 6-40mm (CG)
Lumps 5-18 (Odisha)
Iron ore fines (INR/t) ex mine
Domestic iron ore fines
prices were unchanged
WoW. A few miners
however made downward
adjustment to prices
bringing their prices in line
with the cuts announced
last week by some
major miners
4,000
3,600
3,200
2,800
2,400
2,000
Rungta Fines 63% (Odisha, incl. royalty)
NMDC Fines, ex-royalty
Pellet (Barbil) INR/t
Pellet prices fell to
INR6,200/t from
INR7,000/t WoW on lower
iron ore prices, weak
demand and increasing
supplies
9,000
8,500
8,000
7,500
7,000
6,500
6,000
Pellet (Barbil)
Source: SteelMint, WSA, MOSL
27 January 2015
4

Metals Weekly
European Union
European HRC prices (EUR/ton)
EU HRC prices were up
1.3% WoW to EUR394/t,
driven in our view by
depreciation of EUR
to USD
525
475
425
375
North Europe HRC
South Europe HRC
Rotterdam: shredded scrap prices (USD/t)
Rotterdam export scrap
prices were down
3.6% WoW to USD297/t
405
380
355
330
305
280
European wire rods southern region (Euro/t)
510
490
470
450
430
South Europe wire rod
prices were unchanged
WoW
Spreads ( HRC-1.6xiron ore-0.7xcoking coal) – (USD/t)
EU HRC product spreads
continue to trend lower.
Although steel prices were
higher WoW and iron
ore/coking coal declined,
the impact of currency
depreciation more than
offset benefit from higher
EUR prices
400
345
290
235
180
EU
China
Source: Metal Bulletin, Bloomberg, WSA, MOSL
27 January 2015
5

Metals Weekly
China
China domestic prices (USD/ton)
China domestic steel prices
(in USD) declined further
this week. HRC was down
4.1% WoW to USD428/t
while rebar was down
1.0% WoW to USD363/t.
Besides for weak demand,
currency depreciation also
impacted prices
HRC
850
750
650
550
450
350
Rebar
Steel spreads (Steel price – 1.6x iron ore – 0.55x coke) for Chinese producers
Chinese steel product
spreads contracted further
this week on lower steel
prices and marginal
currency depreciation. This
offset the impact of lower
iron ore prices. Moreover,
while coking coal prices
were down, coke was
unchanged WoW
320
275
230
185
140
HRC
Rebar
Steel trade (m ton)
Chinese steel exports rose
95.6% YoY in December to
9.58mt. For 2014, exports
grew by 52% to 87.15mt
Exports
12
10
8
6
4
2
0
Imports
Steel inventories in main China cities (m tons)
Steel inventories
rose WoW
9
8
7
6
5
4
3
27 January 2015
6

Metals Weekly
Other regions
CIS HRC export prices (USD/ton) fob basis
CIS HRC export prices were
down USD20/t WoW to
USD430/t
CIS Exports (HRC)
540
510
480
450
420
Turkish export billets (USD/ton)
Turkey billet export prices
were unchanged WoW
Turkish Exp Billets
540
520
500
480
460
440
420
North America HRC prices (USD/ton)
US HRC prices are hitting
new lows with prices down
further USD10/t WoW to
USD550/t. Media reports
highlights talks about plant
closures to arrest
increasing steel supplies
690
660
630
600
570
540
CIS: Monthly crude steel production
CIS countries contraction
in crude steel production
accelerated to 8.0% YoY in
December (8.4mt) from
6.2% declined recorded in
November 2014
10.0
9.5
9.0
8.5
8.0
CIS
YoY (%)
10
5
0
-5
-10
Source: Metal Bulletin, WSA, Bloomberg, MOSL
27 January 2015
7

Metals Weekly
Other regions
North America: Monthly crude steel production
US crude steel production
was down 0.2% YoY in
December to 9.97mt. This
was however better than
0.7% YoY decline recorded
in November 2014
North America
11.0
10.5
10.0
9.5
9.0
YoY (%)
15.0
7.5
0.0
-7.5
-15.0
Global: Monthly crude steel production
Global crude steel
production growth in
December accelerated to
3.5% YoY (133.7mt) v/s
1.7% growth recorded in
November 2014
Global
145
140
135
130
125
120
YoY (%)
8
6
4
2
0
-2
Global: Monthly crude steel capacity utilization
Global crude steel capacity
utilization at 72.7% was
flat YoY but down 80bps
MoM
84
81
78
75
72
69
Capacity Utilization
Source: Bloomberg, WSA, MOSL
27 January 2015
8

Metals Weekly
Steel raw materials
Import price of 62% grade iron-ore fines in China (USD/ton)
Iron ore China cfr prices
were down 3% WoW
closing USD66/t. This was
driven, in our view, by the
sharp decline in Chinese
steel prices in the
recent weeks
CIF
130
115
100
85
70
55
FOB
OTC iron-ore swaps (USD/ton)
2015
2Q15
1Q15
96
90
84
78
72
66
60
China iron-ore production and imports (m tons)
China iron ore imports
grew 18% YoY in
December to 86.8mt
Ore Imports
150
120
90
60
30
Ore Prod
Pig iron prod (RHS)
68
62
56
50
44
China iron-ore inventories (mt)
China iron ore inventories
declined WoW
110
100
90
80
70
60
Source: Metal Bulletin, Bloomberg, MOSL
27 January 2015
9

Metals Weekly
Steel raw materials
Freight rates to China (USD/ton)
Freight rates from Brazil to
China were slightly higher
WoW
Brazil
32
24
16
8
0
Australia
India
Coal price index
Thermal coal prices were
up 3% WoW to USD62/t
Richards Bay Steam Coal
90
80
70
60
Coke price index (fob China)
China coke export spot (LHS)
360
310
260
210
160
Coking coal (USD/t)
Spot coking coal (fob Australia)
Coking coal prices were
down 4% WoW to
USD103/t
180
160
140
120
100
27 January 2015
10

Metals Weekly
Ferro alloys
China’s imports of manganese ore and concentrate
Imports
2,000
1,700
1,400
1,100
800
500
Prices (RHS)
280
250
220
190
160
130
Chrome ore FOB spot prices
200
180
160
140
40% Chrome Africa
Ferro chrome CIF prices (CNY/t)
11,500
10,000
8,500
7,000
5,500
Fe Chrome 50% Cr China
Fe Chrome 63% Cr Pittursburgh
Silico Manganese prices
0.7
0.6
0.5
0.4
Silico Manganese in warehouses in Pittsburg USA
Source: Metal Bulletin, Bloomberg, MOSL
27 January 2015
11

Metals Weekly
Non-ferrous
LME aluminum was up 2%
WoW to USD1,831/t
Non-ferrous
Aluminum
LME inventories and spot prices
2,200
2,000
1,800
1,600
Inventories (RHS)
Spot
5.5
5.2
4.9
4.6
4.3
4.0
Global primary aluminum monthly production and YoY growth
Global metal production in
October grew 2.6% YoY,
slower than 4.6% YoY
growth recorded in
September
Production
4,400
4,200
4,000
3,800
3,600
YoY
8.0
5.5
3.0
0.5
-2.0
Aluminum: SHFE Vs LME arbitrage (USD/T)
LME and SHFE arbitrage
has now turned favorable
290
190
90
-10
-110
-210
India: Company-wise primary aluminum monthly production
Hindalco
Balco
Nalco
SSLT
27 January 2015
12

Metals Weekly
Non-ferrous
Aluminum
Aluminum raw material and power cost for marginal producer in USA (USD/t)
All-in-aluminum prices
were up 1% WoW
3,200
2,400
1,600
800
0
CPC
Alumina
Power
LME+Spot
CPC US (USD/t)
600
500
400
300
200
Alumina (USD/t)
Alumina was unchanged
WoW
440
400
360
320
280
240
Industrial power US (Lousiana) (USc/kwh)
8.0
7.0
6.0
5.0
4.0
Source: Metal Bulletin, Bloomberg, Industry, MOSL
27 January 2015
13

Metals Weekly
Non-ferrous
Copper
LME inventories and prices
Inventories (RHS)
Spot
0.5
0.4
0.3
0.2
0.1
LME copper fell 1% WoW
to USD5,581/t
7,400
7,000
6,600
6,200
5,800
5,400
Global refined copper monthly production and YoY growth
Global copper production
in October grew 6.0% YoY
to 1.99 mt. This was
slower than September
growth of 8.9% YoY
2.1
2.0
1.9
1.8
1.7
1.6
1.5
Production
YoY - RHS
15.0
12.5
10.0
7.5
5.0
2.5
0.0
China: Refined copper monthly production and YoY growth
0.79
0.72
0.65
0.58
0.51
0.44
0.37
0.30
Production
YoY - RHS
36
25
14
3
-8
Copper: Spot TCRC (USc/lb)
34.0
32.0
30.0
28.0
26.0
24.0
22.0
27 January 2015
14

Metals Weekly
Non-ferrous
Zinc
LME inventories and prices
LME zinc was up 2% WoW
to USD2,106/t
2,600
2,400
2,200
2,000
1,800
Inventories (RHS)
Spot
1.0
0.9
0.8
0.7
0.6
Global refined zinc monthly production and YoY growth
Production
YoY growth (RHS)
14.0
8.0
2.0
-4.0
-10.0
Zinc production in October
grew by 2.6% YoY to 1.17
mt. – slower than 1.1%
growth in Aug 2014
1.2
1.1
1.1
1.0
0.9
China: Refined zinc monthly production and YoY growth
Production
0.6
0.5
0.4
0.4
0.3
-2
-22
YoY growth (RHS)
40
19
Zinc: Refined zinc monthly production - kt
Domestic production grew
9.4% YoY in November
4
2
2
2
2
2
2
2
2
2
HZL
0
1
88
BZL
2
2
1
2
1
-
-
-
0
2
1
1
65
65
54 63 57 63
53 62 60 56
-
69 62 65 61
66
64 61 64 69
55
47 42 52 56
27 January 2015
15

Metals Weekly
Non-ferrous
Lead
LME inventories and prices
LME lead was up 4% WoW
to USD1,831/t
2,300
2,200
2,100
2,000
1,900
1,800
1,700
Inventories (RHS)
Spot
0.25
0.23
0.20
0.18
0.15
Global refined lead monthly production and YoY growth
Refined lead production in
October declined 9.3% YoY
to 861kt
1.0
0.9
0.8
0.7
0.6
Production
YoY - RHS
25
15
5
-5
-15
China: Refined lead monthly production and YoY growth
0.5
0.4
0.3
0.2
Production
YoY - RHS
40
20
0
-20
-40
:
India: Company-wise refined lead monthly production
HZL
10 9
9
12 12
12 12 11
10
9
9
6
7
12 11 11
14
10 10 11 11 10 9 10 11
Source: Metal Bulletin, Bloomberg, MOSL
27 January 2015
16

Metals Weekly
Commodity forward curves
LME aluminum (USD/ton)
2,400
2,200
2,000
1,800
Current
1-week ago
3-month ago
LME copper (USD/ton)
6,800
6,500
6,200
5,900
5,600
5,300
Current
1-week ago
3-month ago
LME zinc futures (USD/ton)
2,280
2,260
2,240
2,220
2,200
2,180
2,160
2,140
2,120
2,100
Current
1-week ago
3-month ago
Base metals US spot premium (USD/ton)
565
490
415
340
265
190
115
40
Aluminium
Zinc
Copper
Source: Metal Bulletin, Bloomberg, MOSL
27 January 2015
17

Metals Weekly
China non-ferrous trade data
China’s aluminum trade ('000 tons)
Unwrought aluminum
exports in December were
almost double YoY
at 543 kt
600
500
400
300
200
100
0
Imports
Exports
China’s refined copper trade ('000 tons)
500
400
300
200
100
0
Imports
Exports
China’s refined zinc trade ('000 tons)
China refined zinc exports
stood at 15.1 kt in
December 2014, down
48% MoM but significantly
higher than just 0.1kt in
December 2013
100
75
50
25
0
Export
Import
China’s alumina imports ('000 tons) and prices (USD/ton)
China alumina imports
surged 44% MoM to 638kt
800
600
400
200
0
Source: Metal Bulletin, Bloomberg, MOSL
27 January 2015
18

Metals Weekly
Key indicators
China new loan growth (Yuan b)
1,500
1,200
900
600
300
China: PMI
54
52
50
48
46
Mfg PMI
Steel PMI
62
56
50
44
38
Fixed asset investment
growth continues to
moderate at 15.7% in
December 2014
China: Fixed asset investment growth (%)
22
20
18
16
Currency movement with respect to the rupee
71
67
63
59
55
51
USD (LHS)
GBP
EURO
110
101
92
83
74
65
Source: Bloomberg, MOSL
27 January 2015
19

Metals Weekly
Key indicators (Contd...)
China Energy Production Electricity (b kwh)
China electricity
production grew 11.6%
YoY in December much
ahead of 4.2% YoY growth
recorded in November
550
500
450
400
350
300
250
200
Electricity
YoY (%, RHS)
48
38
28
18
8
-2
-12
China Monthly Trade YoY (%)
40
20
0
-20
Import
Export
China Price Index YoY (%)
6
3
0
-3
-6
PPI
CPI
China GDP YoY (%)
China’s GDP growth was
7.3% in 4QCY14
8.4
8.0
7.6
7.2
Source: Bloomberg, MOSL
27 January 2015
20

Metals Weekly
Industrial production growth
The UK and the USA (%)
UK
6
3
0
-3
-6
USA
Japan (%)
20
10
0
-10
-20
European Union (%)
8
2
-4
-10
-16
France
Germany
Italy
BRIC (%)
Russia
14
7
0
-7
Brazil
India
China
Source: Bloomberg, MOSL
27 January 2015
21

Metals Weekly
Stock exchange announcements
Sesa Sterlite:
(a) SSLT received approval from the State government of Goa for renewal of all its
mining leases in the state. It expects to resume mining operation once all regulatory
process – including lease registration, EC and other consents by the state
government – is complete.
(b) For its Balco 1200MW CPP it has received approval of Consent to Operate from
the Chattisgarh State Pollution Control Board and other clearances for starting the
power plant.
27 January 2015
22

Metals Weekly
Metals
Valuation Matrix
Valuations: Indian Companies
Rating
Steel
Ta ta Steel
SAIL
JSW Steel
JSPL
NMDC
Non-Ferrous
Hi nda l co
SSLT
Hi ndus ta n Zi nc
Na l co
CMP=current ma rket pri ce
Buy
Neutra l
Buy
Neutra l
Buy
Buy
Buy
Buy
Buy
Price
(INR)
402.7
78.15
1013
158.4
139.4
144.8
205.1
165.9
48.55
MCAP
(USD M)
6,346
5,238
3,972
2,351
8,964
4,850
9,867
11,374
2,030
FY14E
35.5
4.6
34.4
20.9
16.1
12.5
17.2
16.3
2.6
EPS
FY15E
25.6
6.3
103.8
13.0
17.2
13.7
20.6
20.4
5.6
FY16E
56.0
5.6
100.0
11.3
14.5
15.1
18.9
18.8
6.8
P/E (x)
FY15E FY16E
15.7
12.3
9.8
12.2
8.1
10.5
9.9
8.1
8.7
7.2
14.0
10.1
14.1
9.6
9.6
10.9
8.8
7.1
EV/EBITDA (x)
FY15E FY16E
7.2
9.3
6.5
9.0
4.4
7.9
6.3
4.8
3.1
6.1
8.3
6.5
8.8
5.5
6.7
5.7
4.0
1.9
P/B(x)
FY14E FY15E
1.6
0.7
1.1
0.6
1.8
1.2
0.7
1.1
0.7
1.7
1.3
1.2
0.8
0.8
1.6
1.4
0.9
0.9
Source: MOSL
Valuations: Global Companies
Company
Mining
BHP-Bi l l i ton
FMG
Ri o Ti nto
Va l e
Teck Res ources
STEEL
Arcel or Mi tta l
Pos co
US Steel
Nucor
JFE
Gerda u
Ba o Steel
NON FERROUS
Al coa
Nors k Hydro
Rus a l
BBG
CODE
BHP AU
FMG AU
RIO AU
Va l e US
TCK US
MT NA
005490 KS
X US
NUE US
5411 JT
GGBR4 BZ
600019 CH
AA US
NHY NO
486 HK
Currency
AUD
AUD
AUD
USD
USD
EUR
k KRW
USD
USD
JPY
BRL
CNY
USD
NOK
HKD
PRICE
29
2
57
17
13
8
269
21
44
2,498
9
6
16
44
5
MCAP
(US$ M)
119,131
5,034
81,228
38,011
7,337
15,869
21,245
3,103
14,141
13,564
5,594
16,071
19,557
11,627
9,956
PE (x)
CUR YR
NXT YR
14.0
7.3
11.9
9.9
15.4
11.0
9.7
8.4
13.9
11.9
13.2
12.7
13.9
14.1
5.2
14.4
8.6
10.5
7.9
10.2
7.6
8.6
7.4
12.0
9.1
9.9
11.0
11.7
12.7
5.1
EV/EBITDA(x)
CUR YR
NXT YR
6.1
4.3
5.7
4.2
6.3
5.0
7.6
4.0
8.6
8.1
6.4
7.5
6.8
9.7
13.4
6.2
4.6
6.7
5.0
5.9
4.8
6.9
3.7
6.6
6.9
5.8
6.7
P/BV (x)
CY15E
1.5
0.6
1.5
0.6
0.5
0.3
0.5
0.7
1.7
0.8
1.1
0.8
6.1
1.4
6.4
1.2
7.7
1.3
Source: Bl oomberg
27 January 2015
23

Metals Weekly
Metals Stock
Performance
Among large-cap companies, JPSL
was the best performer while
Naclo was the weakest performer
over one month
Metals stock performance on absolute and relative basis (%)
Months
Steel
Ta ta Steel
SAIL
JSW Steel
JSPL
NMDC
Non-Ferrous
SSLT
Hi ndus ta n Zi nc
Na l co
Hi nda l co
Mid Caps
Monnet Is pa t
Goda wa ri
Sa rda Energy
Ta ta Sponge
Adhuni k Meta l i ks
Bhus ha n Steel
Ja i Ba l a ji
Ra i n Indus tri es
Pra ka s h Indus tri es
SENSEX
1
1.9
-4.9
-2.8
8.6
-3.9
0.5
3.4
-7.4
-5.5
-2.4
-5.5
-6.1
4.2
4.4
-1.2
-0.7
-14.8
-5.9
6.4
Absolute Perf (%)
3
6
-12.3
-6.2
-16.0
-4.5
-13.9
-17.6
0.8
-18.9
-3.1
-24.1
-21.8
-14.9
-16.3
-47.3
-21.0
-7.1
-21.6
-5.8
9.0
-27.4
-10.4
-14.6
-46.2
-20.4
-30.6
-0.4
-18.5
-25.0
-53.9
-22.2
-38.9
-23.7
-55.5
-78.4
-37.5
-7.5
-52.6
12.0
12
3.5
12.9
1.9
-40.7
-4.0
-1.8
24.8
32.3
26.8
-49.7
45.0
74.9
59.1
-27.9
-82.1
19.1
4.7
50.8
37.0
Relative Perf to Sensex (%)
1
3
6
12
-4.5
-11.3
-9.3
2.2
-10.4
-6.0
-3.0
-13.9
-12.0
-8.9
-12.0
-12.5
-2.2
-2.0
-7.6
-7.2
-21.3
-12.4
-
-21.3
-15.3
-25.0
-13.5
-22.9
-26.6
-8.2
-27.9
-12.1
-33.2
-30.9
-23.9
-25.4
-56.3
-30.0
-16.1
-30.6
-14.8
-
-39.4
-22.4
-26.6
-58.2
-32.4
-42.5
-12.4
-30.5
-37.0
-33.5
-24.1
-35.1
-77.7
-40.9
-38.8
-12.2
-4.7
-10.2
Among mid-cap companies,
Adhunik Metaliks relatively
outperformed
and Rain Industries has
underperformed over one month
-65.9 -86.7
-34.2
8.0
-50.9
38.0
-35.7
22.1
-67.5 -64.9
-90.4 -119.1
-49.5 -17.8
-19.5
-32.3
-64.6
13.9
-
-
Global Metals stock performance on absolute basis (%)
1week
1month
-0.4
2.0
-3.6
-16.5
-6.6
-27.6
-22.0
-11.6
-9.8
-7.8
-3.8
-6.8
-5.6
3.8
-3.4
-4.9
0.2
9.8
9.0
Absolute Perf (%)
3 months
6 months
-5.8
-12.7
-27.5
-39.7
-17.6
-48.5
-44.0
-14.3
-17.8
46.2
-14.3
28.6
14.8
17.3
2.9
-24.6
-3.0
26.8
18.0
-15.0
-24.6
-45.3
-53.9
-30.9
-61.6
-25.9
-14.1
-25.2
43.5
-13.4
18.4
-5.9
3.9
-6.3
-41.9
7 months
-10.4
-20.7
-40.3
-59.4
-20.1
-51.9
-21.9
-12.7
-33.9
63.3
-9.7
6.7
-12.6
17.5
-8.8
-51.2
12 months
-10.4
-20.7
-40.3
-59.4
-20.1
-51.9
-21.9
-12.7
-33.9
63.3
-9.7
6.7
-12.6
17.5
-8.8
-51.2
Among global mining companies,
BHP Billiton was the best
performer, while FMG was the
worst performing stock over
one month
Among global steel majors, Voest
Alpine was the best relative
performer, while US Steel was the
worst performing stock over the
last one month
Among the global aluminum,
Rusal was the best relative
performer
Mining
Ri o Ti nto
BHP Bi l l i ton
Va l e
FMG
Angl o Ameri ca n
Veda nta
Steel
US Steel
Nucor
Arcel or Mi tta l
Ba o Steel
Pos co
JFE Hol di ngs
Ni ppon
Thys s en Krupp
Voes t Al pi ne
Gerda u
Aluminium
Al coa
Rus a l
Cha l co
-0.2
8.6
-6.7
-7.8
0.4
6.1
-6.5
-1.4
-0.9
-4.2
1.5
5.1
4.1
7.1
7.1
-4.4
3.1
9.3
0.3
-7.6
30.6
30.6
40.0
99.6
99.6
11.9
32.6
32.6
Source: MOSL, Bl oomberg
27 January 2015
24

Metals Weekly
NOTES
27 January 2015
25

This document has been prepared by Motilal Oswal Securities Limited (hereinafter referred to as Most) to provide information about the company(ies) and/sector(s), if any, covered in the report and may be
distributed by it and/or its affiliated company(ies). This report is for personal information of the selected recipient/s and does not construe to be any investment, legal or taxation advice to you. This research report does
not constitute an offer, invitation or inducement to invest in securities or other investments and Motilal Oswal Securities Limited (hereinafter referred as MOSt) is not soliciting any action based upon it. This report is not
for public distribution and has been furnished to you solely for your general information and should not be reproduced or redistributed to any other person in any form. This report does not constitute a personal
recommendation or take into account the particular investment objectives, financial situations, or needs of individual clients. Before acting on any advice or recommendation in this material, investors should consider
whether it is suitable for their particular circumstances and, if necessary, seek professional advice. The price and value of the investments referred to in this material and the income from them may go down as well as
up, and investors may realize losses on any investments. Past performance is not a guide for future performance, future returns are not guaranteed and a loss of original capital may occur.
MOSt and its affiliates are a full-service, integrated investment banking, investment management, brokerage and financing group. We and our affiliates have investment banking and other business relationships with a
some companies covered by our Research Department. Our research professionals may provide input into our investment banking and other business selection processes. Investors should assume that MOSt and/or
its affiliates are seeking or will seek investment banking or other business from the company or companies that are the subject of this material and that the research professionals who were involved in preparing this
material may educate investors on investments in such business. The research professionals responsible for the preparation of this document may interact with trading desk personnel, sales personnel and other
parties for the purpose of gathering, applying and interpreting information. Our research professionals are paid on the profitability of MOSt which may include earnings from investment banking and other business.
MOSt generally prohibits its analysts, persons reporting to analysts, and members of their households from maintaining a financial interest in the securities or derivatives of any companies that the analysts cover.
Additionally, MOSt generally prohibits its analysts and persons reporting to analysts from serving as an officer, director, or advisory board member of any companies that the analysts cover. Our salespeople, traders,
and other professionals or affiliates may provide oral or written market commentary or trading strategies to our clients that reflect opinions that are contrary to the opinions expressed herein, and our proprietary
trading and investing businesses may make investment decisions that are inconsistent with the recommendations expressed herein. In reviewing these materials, you should be aware that any or all of the foregoing
among other things, may give rise to real or potential conflicts of interest. MOSt and its affiliated company(ies), their directors and employees and their relatives may; (a) from time to time, have a long or short position
in, act as principal in, and buy or sell the securities or derivatives thereof of companies mentioned herein. (b) be engaged in any other transaction involving such securities and earn brokerage or other compensation
or act as a market maker in the financial instruments of the company(ies) discussed herein or act as an advisor or lender/borrower to such company(ies) or may have any other potential conflict of interests with
respect to any recommendation and other related information and opinions.; however the same shall have no bearing whatsoever on the specific recommendations made by the analyst(s), as the recommendations
made by the analyst(s) are completely independent of the views of the affiliates of MOSt even though there might exist an inherent conflict of interest in some of the stocks mentioned in the research report
Reports based on technical and derivative analysis center on studying charts company's price movement, outstanding positions and trading volume, as opposed to focusing on a company's fundamentals and, as
such, may not match with a report on a company's fundamental analysis. In addition MOST has different business segments / Divisions with independent research separated by Chinese walls catering to different set
of customers having various objectives, risk profiles, investment horizon, etc, and therefore may at times have different contrary views on stocks sectors and markets.
Unauthorized disclosure, use, dissemination or copying (either whole or partial) of this information, is prohibited. The person accessing this information specifically agrees to exempt MOSt or any of its affiliates or
employees from, any and all responsibility/liability arising from such misuse and agrees not to hold MOSt or any of its affiliates or employees responsible for any such misuse and further agrees to hold MOSt or any of
its affiliates or employees free and harmless from all losses, costs, damages, expenses that may be suffered by the person accessing this information due to any errors and delays. The information contained herein is
based on publicly available data or other sources believed to be reliable. Any statements contained in this report attributed to a third party represent MOSt’s interpretation of the data, information and/or opinions
provided by that third party either publicly or through a subscription service, and such use and interpretation have not been reviewed by the third party. This Report is not intended to be a complete statement or
summary of the securities, markets or developments referred to in the document. While we would endeavor to update the information herein on reasonable basis, MOSt and/or its affiliates are under no obligation to
update the information. Also there may be regulatory, compliance, or other reasons that may prevent MOSt and/or its affiliates from doing so. MOSt or any of its affiliates or employees shall not be in any way
responsible and liable for any loss or damage that may arise to any person from any inadvertent error in the information contained in this report. MOSt or any of its affiliates or employees do not provide, at any time,
any express or implied warranty of any kind, regarding any matter pertaining to this report, including without limitation the implied warranties of merchantability, fitness for a particular purpose, and non-infringement.
The recipients of this report should rely on their own investigations.
This report is intended for distribution to institutional investors. Recipients who are not institutional investors should seek advice of their independent financial advisor prior to taking any investment decision based on
this report or for any necessary explanation of its contents.
Most and it’s associates may have managed or co-managed public offering of securities, may have received compensation for investment banking or merchant banking or brokerage services, may have received any
compensation for products or services other than investment banking or merchant banking or brokerage services from the subject company in the past 12 months.
Most and it’s associates have not received any compensation or other benefits from the subject company or third party in connection with the research report.
Subject Company may have been a client of Most or its associates during twelve months preceding the date of distribution of the research report
MOSt and/or its affiliates and/or employees may have interests/positions, financial or otherwise of over 1 % at the end of the month immediately preceding the date of publication of the research in the securities
mentioned in this report. To enhance transparency, MOSt has incorporated a Disclosure of Interest Statement in this document. This should, however, not be treated as endorsement of the views expressed in the
report.
Motilal Oswal Securities Limited is under the process of seeking registration under SEBI (Research Analyst) Regulations, 2014.
There are no material disciplinary action that been taken by any regulatory authority impacting equity research analysis activities
Analyst Certification
The views expressed in this research report accurately reflect the personal views of the analyst(s) about the subject securities or issues, and no part of the compensation of the research analyst(s) was, is, or will be
directly or indirectly related to the specific recommendations and views expressed by research analyst(s) in this report. The research analysts, strategists, or research associates principally responsible for preparation
of MOSt research receive compensation based upon various factors, including quality of research, investor client feedback, stock picking, competitive factors and firm revenues
Disclosure of Interest Statement
§
Analyst ownership of the stock
§
Served as an officer, director or employee
Companies where there is interest
SESA STERLITE
No
Disclosures
Metals Weekly
Regional Disclosures (outside India)
For U.S.
This report is not directed or intended for distribution to or use by any person or entity resident in a state, country or any jurisdiction, where such distribution, publication, availability or use would be contrary to law,
regulation or which would subject MOSt & its group companies to registration or licensing requirements within such jurisdictions.
Motilal Oswal Securities Limited (MOSL) is not a registered broker - dealer under the U.S. Securities Exchange Act of 1934, as amended (the"1934 act") and under applicable state laws in the United States. In
addition MOSL is not a registered investment adviser under the U.S. Investment Advisers Act of 1940, as amended (the "Advisers Act" and together with the 1934 Act, the "Acts), and under applicable state laws in the
United States. Accordingly, in the absence of specific exemption under the Acts, any brokerage and investment services provided by MOSL, including the products and services described herein are not available to or
intended for U.S. persons.
This report is intended for distribution only to "Major Institutional Investors" as defined by Rule 15a-6(b)(4) of the Exchange Act and interpretations thereof by SEC (henceforth referred to as "major institutional
investors"). This document must not be acted on or relied on by persons who are not major institutional investors. Any investment or investment activity to which this document relates is only available to major
institutional investors and will be engaged in only with major institutional investors. In reliance on the exemption from registration provided by Rule 15a-6 of the U.S. Securities Exchange Act of 1934, as amended (the
"Exchange Act") and interpretations thereof by the U.S. Securities and Exchange Commission ("SEC") in order to conduct business with Institutional Investors based in the U.S., MOSL has entered into a chaperoning
agreement with a U.S. registered broker-dealer, Motilal Oswal Securities International Private Limited. ("MOSIPL"). Any business interaction pursuant to this report will have to be executed within the provisions of this
chaperoning agreement.
The Research Analysts contributing to the report may not be registered /qualified as research analyst with FINRA. Such research analyst may not be associated persons of the U.S. registered broker-dealer, MOSIPL,
and therefore, may not be subject to NASD rule 2711 and NYSE Rule 472 restrictions on communication with a subject company, public appearances and trading securities held by a research analyst account.
Motilal Oswal Capital Markets Singapore Pte Limited is acting as an exempt financial advisor under section 23(1)(f) of the Financial Advisers Act(FAA) read with regulation 17(1)(d) of the Financial Advisors
Regulations and is a subsidiary of Motilal Oswal Securities Limited in India. This research is distributed in Singapore by Motilal Oswal Capital Markets Singapore Pte Limited and it is only directed in Singapore to
accredited investors, as defined in the Financial Advisers Regulations and the Securities and Futures Act (Chapter 289), as amended from time to time.
In respect of any matter arising from or in connection with the research you could contact the following representatives of Motilal Oswal Capital Markets Singapore Pte Limited:
Anosh Koppikar
Kadambari Balachandran
Email : anosh.Koppikar@motilaloswal.com
Email : kadambari.balachandran@motilaloswal.com
Contact : (+65)68189232
Contact : (+65) 68189233 / 65249115
Office Address : 21 (Suite 31),16 Collyer Quay,Singapore 04931
For Singapore
Motilal Oswal Securities Ltd
Motilal Oswal Tower, Level 9, Sayani Road, Prabhadevi, Mumbai 400 025
Phone: +91 22 3982 5500 E-mail: reports@motilaloswal.com
27 January 2015
26