28 January 2015
3QFY15 Results Update | Sector: Automobiles
Amara Raja Batteries
BSE SENSEX
29,559
Bloomberg
Equity Shares (m)
52-Week Range (INR)
S&P CNX
8,914
AMRJ IN
170.8
946/321
CMP: INR915
TP: INR1,093 (+19%)
Buy
In-line performance; new capacities, weak lead prices to drive performance
FY16 onwards
M.Cap. (INR b) / (USD b) 156.3/2.5
AMRJ’s performance was in line with EBITDA/PAT of ~INR1.8b/1b, despite higher
other expenses. FY16 is an inflection year for AMRJ, with significant new capacities
1, 6, 12 Rel. Per (%)
3/73/128
driving revenue growth (~23% CAGR) and benign lead prices driving margins (+250bp
Avg Val (INR M)/Vol ‘000 173/309
by FY17E), translating into ~34% EPS CAGR (FY15E-17E) after a muted FY15. Stable
Free float (%)
47.9
competitive environment, significant FCF generation (~INR7b over FY16E-17E) and
improving RoE (4pp by FY17E to ~31%), coupled with potential shift from unorganized
Financials & Valuation (INR Million)
to organized players, due to GST, would continue to drive re-rating of the stock.
y/e MAR
2015E 2016E 2017E
7,246
4,131
24.2
11.6
98.7
27.1
37.8
37.8
9.3
Net Sales
EBITDA
Adj PAT
EPS (INR)
Gr. (%)
BV/Sh.INR
RoE (%)
RoCE (%)
P/E (x)
P/BV (X)
42,288 52,893 63,315
9,617 12,383
5,481
32.1
32.7
123.8
28.8
40.7
28.5
7.4
7,468
43.7
36.3
158.0
31.0
44.1
20.9
5.8
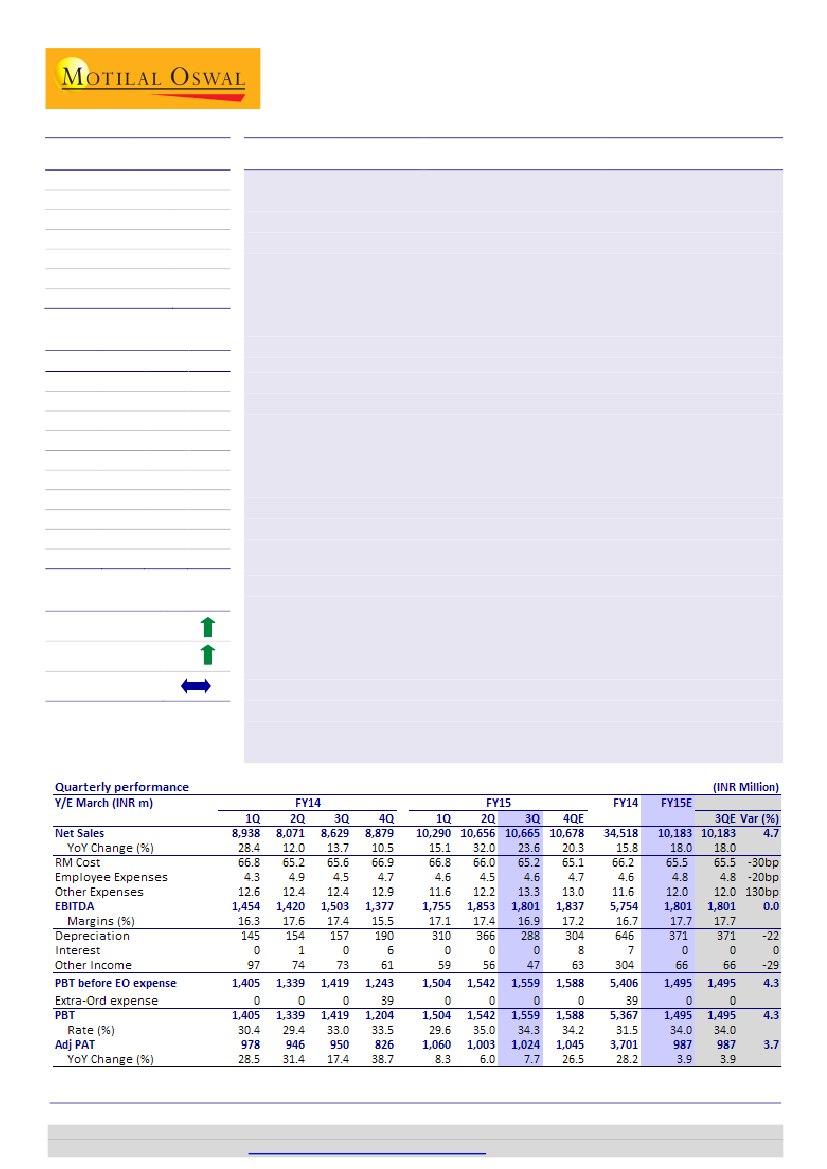
Net sales grew 23.6% YoY (+0.1% QoQ) to INR10.7b (est. INR10.2b), driven by
telecom (~29% YoY) and replacement segment (~20% YoY).
RM cost declined by 40bp YoY (-80bp QoQ) to 65.2% on account of favorable mix
and stable lead price (in INR terms).
Other expenses were higher at 13.3% of sales (+90bp/+110bp YoY/QoQ v/s est.
12%), due to higher marketing spend and higher CSR spend.
EBITDA margin declined 50bp YoY/QoQ at 16.9% (v/s est. 17.7%) for 3QFY15.
However, EBITDA at ~INR1.8b (in-line) grew by 20% YoY (-3% QoQ).
PAT grew by 7.7% YoY (2.1% QoQ) to INR1b (v/s est. INR0.98b).
Estimate change
TP change
Rating change
11%
39%
Takeaways from management interaction:
a) Lead prices for 3QFY15 for the company
stood at ~INR121/kg (v/s INR121/kg in 2QFY15), almost flat QoQ, b) capacity
expansion is on track, with four-wheeler battery plant to be operational by end of
current quarter and two-wheeler battery plant by April-May 2015, c) capex of ~INR4b
each for FY15 and FY16 and d) excise duty hike of 2% passed on to customers.
Valuation and view:
We raise FY16E/17E EPS estimates by ~6%/11% to ~INR32/44 to
factor the strong revenue growth and benign lead prices. We value AMRJ at ~25x
FY17E EPS (v/s 20x earlier) to factor the increased visibility of superior competitive
positioning and capital efficiencies. Maintain
Buy
with a target price of ~INR1,093.
Jinesh Gandhi
(Jinesh@MotilalOswal.com); +91 22 3982 5416
Jay Shah
(Jay.Shah@MotilalOswal.com); +91 22 3078 4701
Investors are advised to refer through disclosures made at the end of the Research Report.
Motilal Oswal research is available on
www.motilaloswal.com/Institutional-Equities,
Bloomberg, Thomson Reuters, Factset and S&P Capital.

Amara Raja Batteries
Exhibit 1: Net sales growth of 23.6% YoY
Net sales (INR m)
32.7
28.4
28.0
23.7 19.6
15.1
12.0 13.7 10.5
Growth YoY (%)
32.0
23.6
Exhibit 2: Revenue mix improving in favor of telecom
4W
100
75
50
25
0
3QFY14
2QFY15
3QFY15
Source: Company, MOSL
2W
Auto Others
Telecom
UPS
Industrial Others
Source: Company, MOSL
Exhibit 3: Gross margins up 80bp QoQ
Gross margin (%)
Exhibit 4: EBITDA margin decline on higher promotion
and CSR spends
EBITDA
17.2
15.1 16.0 13.9 16.3
EBITDA (%)
17.6 17.4
15.5
17.1 17.4 16.9
Source: Company, MOSL
Exhibit 5: PAT growth restricted on lower other income
and higher tax rate
PAT (INR m)
95
720
761
39
809
596
23
29
2
31
39
17
8
6
8
Growth YoY (%)
1,060 1,003 1,024
978 946 950
826
Exhibit 6: Lead prices are down ~10% QoQ in INR/tonne
175,000
150,000
125,000
100,000
75,000
50,000
INR/tonne
Source: Company, MOSL
28 January 2015
2

Amara Raja Batteries
Valuation and view
Industry structure remains duopoly, but AMRJ is a strong No. 2:
While the
industry structure remains largely duopoly, AMRJ has emerged as a formidable
challenger to leader EXIDE, with market leadership in telecom (46% share) and
UPS (32%) segments, and a fast gaining share in Autos. Over FY04-14, AMRJ
clocked a CAGR of 35% and 75% in net sales and PAT respectively, far exceeding
EXID’s 20% CAGR each in net sales and PAT. This has been driven through a
combination of technological innovations (first to introduce maintenance-free,
factory charged, extended warranty batteries), witty advertising and unique
distribution model (franchisee based) supported with operational efficiency-led
competitive pricing.
AMRJ – gearing up to be leader:
AMRJ is gearing up to be a leader through i)
consolidating in existing areas, ii) entering new business opportunities within
battery space, mainly home UPS, Solar and Motive Power and iii) aided by
capacity and network expansion. Company aims to increase its share in the OEM
and replacement segments to 40% (from current 30%) and 30% (from current
24%) respectively over the medium term. In the telecom segment, AMRJ
expects to further consolidate its leadership with 52-53% share from the current
46%.
Strong ~34% EPS CAGR over FY15-FY17E, robust return ratios and FCF; Buy:
FY16 is inflection year for AMRJ, with significant new capacities driving top-line
growth (~23% CAGR) and benign lead prices driving margins (+250bp by FY17),
translating into ~34% EPS CAGR (FY15-17E) after muted FY15. Stable
competitive environment, significant FCF generation (~INR7b over FY16-17) and
improving RoEs (4pp by FY17 to ~31%), coupled with potential shift from
unorganized to organized players due to GST would continue to drive re-rating
of the stock. We are upgrading our FY16/17 EPS estimates by ~6%/11% to
~INR32/44 to factor in for strong revenue growth and benign lead prices. We
now value AMRJ at ~25x FY17 EPS (v/s 20x earlier) to factor in for increasing
visibility of sustained superior competitive positioning and capital efficiencies.
Buy with TP of ~INR1,093.
Exhibit 7:
Revised forecast (Consol)
(INR M)
Net Sales
EBITDA (%)
Net Profit
EPS (INR)
Rev
42,288
17.1
4,131
24.2
FY15E
Old
41,676
17.5
4,046
23.7
Chg (%)
1.5
-1.8
2.1
2.1
Rev
52,893
18.2
5,481
32.1
FY16E
Old
51,954
17.7
5,147
30.1
Chg (%)
1.8
2.5
6.5
6.5
Rev
63,315
19.6
7,468
43.7
FY17E
Old
61,969
18.4
6,725
39.4
Chg (%)
2.2
6.3
11.1
11.1
28 January 2015
3

Amara Raja Batteries
Exhibit 8: Valuations trading above historical average, reflecting improving fundamentals
35
28
21
14
7
0
12.1
8.5
8.7
P/E (x)
5 Yrs Avg(x)
15 Yrs Avg(x)
10 Yrs Avg(x)
31.5
8.0
6.0
4.0
2.0
1.6
0.0
3.1
2.2
P/B (x)
5 Yrs Avg(x)
15 Yrs Avg(x)
7.8
10 Yrs Avg(x)
Source: MOSL
Source: MOSL
Exhibit 9: Comparative
Valuation
CMP * Rating
(INR)
Auto OEM's
Bajaj Auto
Hero MotoCorp
TVS Motor
M&M
Maruti Suzuki
Tata Motors
Ashok Leyland
Eicher Motors#
Auto Ancillaries
Bharat Forge
Exide Industries
Amara Raja Batteries
2,397
2,865
312
1,314
3,725
589
68
16,341
Buy
Buy
Buy
Neutral
Buy
Buy
Buy
Buy
TP
(INR)
2,832
3,375
289
1,318
4,616
581
61
16,473
1,154
190
1,093
P/E (x)
FY15E
FY16E
20.2
20.6
38.3
21.1
31.5
10.1
173.9
71.0
35.6
29.4
37.8
15.8
16.2
21.5
16.8
21.6
7.8
25.8
41.8
25.5
21.6
28.5
EV/EBITDA (x)
FY15E
FY16E
12.9
14.4
22.6
16.9
16.0
4.2
22.2
41.9
17.9
18.0
21.5
10.1
11.4
13.5
14.4
11.5
3.3
11.6
25.1
13.7
13.1
16.2
RoE (%)
FY15E
FY16E
33.5
45.1
24.8
17.0
14.7
25.1
2.3
27.8
22.5
14.0
27.1
36.4
46.9
34.7
16.5
18.5
25.2
13.4
36.8
25.8
16.6
28.8
RoCE (%)
FY15E
FY16E
47.0
62.0
27.9
17.7
18.1
27.0
6.0
27.6
21.9
19.5
37.8
50.4
66.0
41.2
17.9
23.2
27.3
13.2
39.8
26.9
23.4
40.7
1,016 Buy
198 Buy
915 Buy
28 January 2015
4

Amara Raja Batteries
Corporate profile: Amara Raja Batteries
Company description
Commencing operations in 1992, AMRJ has become
India’s
second-largest
lead-acid
battery
manufacturer (next to market leader EXID), with
market leadership in telecom and UPS segments. It is
reckoned as one of the pioneers in VRLA (valve
regulated lead acid) batteries. Johnson Control USA
(JC) is an equal partner and acquired 26% equity in
AMRJ in 1997.
Exhibit 10: Sensex rebased
Amara Raja Batt.
1,050
850
650
450
250
Jan-14
Apr-14
Jul-14
Oct-14
Jan-15
Sensex - Rebased
Exhibit 11: Shareholding pattern (%)
Dec-14
Promoter
DII
FII
Others
52.1
8.7
18.2
21.0
Sep-14
52.1
9.5
16.9
21.5
Dec-13
52.1
12.8
13.4
21.8
Exhibit 12: Top holders
Holder Name
ICICI Prudential Value Discovery Fund
HDFC Trustee Company Ltd - A/c HDFC Mid - Cap
Franklin Templeton Investment Funds
Dr Upendranath N
Smallcap World Fund INC
% Holding
1.8
1.5
1.5
1.5
1.3
Note: FII Includes depository receipts
Exhibit 13: Top management
Name
Ramachandra N Galla
Jayadev Galla
S V Raghavendra
Srinivasa Rao Ganga
Rajesh Jindal
Chairman
Vice Chairman & M.D.
Chief Financial Officer
Chief Marketing Officer,
Industrial Battery Division
Chief Marketing Officer,
Automotive Battery Division
Designation
Exhibit 14: Directors
Name
Ramachandra N Galla
Jayadev Galla
P Lakshmana Rao*
Raymond J Brown*
T R Narayanaswamy*
*Independent
Name
N Sri Vishnu Raju*
Nagarjun Valluripalli*
Shu Qing Yang
Bruce A Ronning Jr.
Exhibit 15: Auditors
Name
Chevuturi Associates
E Phalguna Kumar & Co
Sagar & Associates
Type
Statutory
Statutory
Cost Auditor
Exhibit 16: MOSL forecast v/s consensus
EPS (INR)
FY15
FY16
FY17
MOSL forecast
24.2
32.1
43.7
Consensus
forecast
24.9
31.1
39.5
Variation (%)
-2.8
3.3
10.6
28 January 2015
5

Amara Raja Batteries
Amara Raja| Story in Charts: Robust ~34% EPS CAGR expected over FY15-17E
Exhibit 17: New capacities to drive strong growth
4W (mn units)
MVRLA (mn units)
2W (mn units)
LVRLA (billion. Amph)
8.4
4.7
6
4
1.65
3
34.3
25.2
16.0
23.1
25.1
19.7
Exhibit 18: Expect net sales to register a CAGR of ~23%
over FY15-17E
Net sales (INR m)
Growth (%)
3.5
2.25
1.5
4.5
3.5
1.5
FY11
FY12
FY13
FY14
FY12
FY13
FY14
FY15E
FY16E
FY17E
Source: Company, MOSL
Exhibit 19: Expect margins to sustain and improve
to 19.6% by FY17E
EBITDA (INR m)
EBITDA margins (%)
Exhibit 20: Strong EPS growth of ~34% over FY15-17E
45.2
EPS
36.2
26.3
11.6
12.6
17.2
FY13
21.7
FY14
24.2
FY15E
32.1
FY16E
43.7
FY17E
Growth (%)
32.7
36.3
14.4
15.2
16.3
17.1
18.2
19.6
FY12
FY13
FY14
FY15E
FY16E
FY17E
FY12
Source: Company, MOSL
Exhibit 21: FCF to turn positive in FY16E/17E
CFO
Capex
FCF
Exhibit 22: Return ratios to remain strong
RoCE (%)
37.8
29.3
41.2
31.1
40.9
30.6
RoE (%)
37.8
27.1
40.7
28.8
44.1
31.0
-809
-1,463
-3,570
-5,000
-5,000
-2,000
FY12
FY13
FY14
FY15E
FY16E
FY17E
FY12
FY13
FY14
FY15E
FY16E
FY17E
Source: Company, MOSL
28 January 2015
6

Amara Raja Batteries
Key Operating Metrics
Revenue Model
Automotive (INR m)
Growth YoY (%)
OEM (INR m)
Growth YoY (%)
Replacement (INR m)
Growth YoY (%)
Two-wheelers (INR m)
Growth YoY (%)
Industrial (INR m)
Growth (%)
Others (Traded)
Growth (%)
Net revenue (INR m)
Growth (%)
14,645
17,611
20.3
FY10
8,414
10.8
1,497
21.1
6,432
5.9
485
68
6,412
14.9
0
FY11
10,725
27.5
2,098
40.1
7,871
22.4
756
56
7,569
18.0
65
FY12
13,358
24.6
2,562
22.1
9,540
21.2
1,257
66
9,212
21.7
881
1,254.1
23,645
34.3
FY13
16,983
27.1
3,019
17.9
12,249
28.4
1,714
36
11,523
25.1
2,586
193.4
29,614
25.2
FY14
22,229
30.9
3,613
19.7
15,640
27.7
2,976
74
13,768
19.5
1,843
-28.7
34,001
14.8
FY15E
27,563
24.0
3,976
10.0
18,899
20.8
4,688
58
17,105
24.2
2,396
30.0
42,288
24.4
FY16E
35,435
28.6
5,191
30.6
22,860
21.0
7,383
58
20,512
19.9
2,918
21.8
52,893
25.1
FY17E
43,452
22.6
6,490
25.0
26,884
17.6
10,078
37
23,660
15.4
3,351
14.8
63,315
19.7
28 January 2015
7

Amara Raja Batteries
Financials and valuations
Standalone - Income Statement
Y/E March
Net Sales
Change (%)
Total Expenditure
EBITDA
Margin (%)
Depreciation
EBIT
Int. and Finance Charges
Other Income - Rec.
PBT after EO Exp.
Tax Rate (%)
PAT Adj for EO items
Change (%)
FY10
14,645
11.5
11,760
2,885
19.7
429
2,455
79
170
2,546
34.4
1,670
107.5
FY11
17,611
20.3
15,037
2,574
14.6
417
2,157
31
78
2,204
32.8
1,481
-11.3
FY12
23,645
34.3
20,249
3,396
14.4
465
2,931
25
280
3,186
32.5
2,151
45.2
FY13
29,614
25.2
25,099
4,515
15.2
661
3,854
10
466
4,218
32.0
2,929
36.2
FY14
34,367
16.0
28,764
5,603
16.3
646
4,957
7
455
5,367
31.5
3,701
26.3
FY15E
42,288
23.1
35,042
7,246
17.1
1,268
5,978
9
225
6,194
33.3
4,131
11.6
(INR Million)
FY16E
52,893
25.1
43,275
9,617
18.2
1,790
7,827
9
400
8,218
33.3
5,481
32.7
FY17E
63,315
19.7
50,932
12,383
19.6
1,926
10,456
9
750
11,197
33.3
7,468
36.3
Standalone - Balance Sheet
Y/E March
Equity Share Capital
Total Reserves
Net Worth
Deferred Liabilities
Total Loans
Capital Employed
Gross Block
Less: Accum. Deprn.
Net Fixed Assets
Capital WIP
Total Investments
Curr. Assets, Loans&Adv.
Inventory
Account Receivables
Cash and Bank Balance
Loans and Advances
Curr. Liability & Prov.
Account Payables
Other Current Liabilities
Provisions
Net Current Assets
Appl. of Funds
FY10
171
5,266
5,436
216
912
6,565
4,911
1,854
3,057
227
161
6,311
2,176
2,423
625
1,087
3,191
1,376
281
1,535
3,120
6,565
FY11
171
6,289
6,459
205
1,000
7,664
5,388
2,237
3,151
375
161
7,472
2,847
3,057
451
1,117
3,496
1,091
937
1,468
3,977
7,664
FY12
171
8,064
8,235
220
855
9,310
6,213
2,667
3,546
315
161
9,493
2,666
3,197
2,292
1,339
4,206
949
1,196
2,061
5,288
9,310
FY13
171
10,427
10,598
195
881
11,674
6,803
3,214
3,589
1,030
161
12,925
2,929
3,807
4,108
2,082
6,030
1,577
1,960
2,493
6,895
11,674
FY14
171
13,456
13,627
301
843
14,772
9,955
3,860
6,096
1,447
161
13,691
3,350
4,528
2,946
2,867
6,623
1,577
1,858
3,188
7,068
14,771
FY15E
171
16,688
16,859
382
773
18,013
15,402
5,127
10,275
1,000
161
14,550
4,081
5,572
1,370
3,527
7,972
2,073
2,286
3,613
6,578
18,014
(INR Million)
FY16E
171
20,975
21,146
489
773
22,408
20,402
6,918
13,484
1,000
161
18,075
5,046
6,969
1,648
4,412
10,312
2,752
2,859
4,701
7,763
22,408
FY17E
171
26,817
26,988
634
773
28,395
22,402
8,844
13,558
1,000
161
26,733
5,978
8,342
7,132
5,281
13,057
3,372
3,422
6,263
13,676
28,395
28 January 2015
8

Amara Raja Batteries
Ratios
Y/E March
Basic (INR)
EPS
Cash EPS
BV/Share
DPS
Payout (%)
Valuation (x)
P/E
Cash P/E
P/BV
EV/Sales
EV/EBITDA
Dividend Yield (%)
Return Ratios (%)
RoE
RoCE
Working Capital Ratios
Asset Turnover (x)
Inventory (Days)
Debtor (Days)
Leverage Ratio (x)
Current Ratio
Debt/Equity
FY10
9.8
12.3
31.8
1.5
17.4
93.5
74.4
28.7
10.7
54.3
0.2
35.2
38.4
2.2
54.2
52
2.0
0.2
FY11
8.7
11.1
37.8
2.3
30.9
105.5
82.3
24.2
8.9
60.9
0.3
24.9
31.4
2.3
59.0
57
2.1
0.2
FY12
12.6
15.3
48.2
1.9
17.4
72.7
59.7
19.0
6.5
45.6
0.2
29.3
37.8
2.5
41.2
45
2.3
0.1
FY13
17.2
21.0
62.0
2.5
17.6
53.3
43.5
14.7
5.2
33.9
0.3
31.1
41.2
2.5
36.1
42
2.1
0.1
FY14
21.7
25.4
79.8
3.2
17.6
42.2
35.9
11.5
4.5
27.5
0.4
30.6
40.9
2.3
35.6
43
2.1
0.1
FY15E
24.2
31.6
98.7
4.4
21.8
37.8
28.9
9.3
3.7
21.5
0.5
27.1
37.8
2.3
35.2
43
1.8
0.0
FY16E
32.1
42.6
123.8
5.8
21.8
28.5
21.5
7.4
2.9
16.2
0.6
28.8
40.7
2.4
34.8
43
1.8
0.0
FY17E
43.7
55.0
158.0
7.9
21.8
20.9
16.6
5.8
2.4
12.1
0.9
31.0
44.1
2.2
34.5
43
2.0
0.0
Standalone - Cash Flow Statement
Y/E March
Net P/L Before Tax and E/O Items
Depreciation
Interest & Finance Charges
Direct Taxes Paid
(Inc)/Dec in WC
CF from Operations
(inc)/dec in FA
Others
CF from Investments
(Inc)/Dec in Debt
Interest Paid
Dividend Paid
CF from Fin. Activity
Inc/Dec of Cash
Add: Beginning Balance
Closing Balance
FY10
2,546
430
61
785
-260
1,992
-515
338
-177
-1,908
-68
-68
-2,044
-78
703
625
FY11
2,204
417
9
776
-1,138
716
-667
54
-612
17
-21
-419
-422
-174
625
451
FY12
3,187
470
-28
1,026
120
2,723
-809
82
-727
-271
84
-222
-409
1,848
444
2,292
FY13
4,218
577
-110
1,366
-94
3,225
-1,463
269
-1,194
3
-17
-323
-336
1,825
2,283
4,108
FY14
5,405
646
-448
1,692
-1,335
2,575
-3,570
455
-3,115
-9
-7
-645
-661
-1,162
4,108
2,946
FY15E
6,194
1,268
-216
2,063
-1,085
4,098
-5,000
225
-4,775
10
-9
-900
-899
-1,576
2,946
1,370
(INR Million)
FY16E
8,218
1,790
-391
2,737
-907
5,974
-5,000
400
-4,600
107
-9
-1,194
-1,096
278
1,370
1,648
FY17E
11,197
1,926
-741
3,729
-430
8,224
-2,000
750
-1,250
146
-9
-1,627
-1,490
5,484
1,648
7,132
28 January 2015
9

This document has been prepared by Motilal Oswal Securities Limited (hereinafter referred to as Most) to provide information about the company(ies) and/sector(s), if any, covered in the report and may be
distributed by it and/or its affiliated company(ies). This report is for personal information of the selected recipient/s and does not construe to be any investment, legal or taxation advice to you. This research report does
not constitute an offer, invitation or inducement to invest in securities or other investments and Motilal Oswal Securities Limited (hereinafter referred as MOSt) is not soliciting any action based upon it. This report is not
for public distribution and has been furnished to you solely for your general information and should not be reproduced or redistributed to any other person in any form. This report does not constitute a personal
recommendation or take into account the particular investment objectives, financial situations, or needs of individual clients. Before acting on any advice or recommendation in this material, investors should consider
whether it is suitable for their particular circumstances and, if necessary, seek professional advice. The price and value of the investments referred to in this material and the income from them may go down as well as
up, and investors may realize losses on any investments. Past performance is not a guide for future performance, future returns are not guaranteed and a loss of original capital may occur.
MOSt and its affiliates are a full-service, integrated investment banking, investment management, brokerage and financing group. We and our affiliates have investment banking and other business relationships with a
some companies covered by our Research Department. Our research professionals may provide input into our investment banking and other business selection processes. Investors should assume that MOSt and/or
its affiliates are seeking or will seek investment banking or other business from the company or companies that are the subject of this material and that the research professionals who were involved in preparing this
material may educate investors on investments in such business. The research professionals responsible for the preparation of this document may interact with trading desk personnel, sales personnel and other
parties for the purpose of gathering, applying and interpreting information. Our research professionals are paid on the profitability of MOSt which may include earnings from investment banking and other business.
MOSt generally prohibits its analysts, persons reporting to analysts, and members of their households from maintaining a financial interest in the securities or derivatives of any companies that the analysts cover.
Additionally, MOSt generally prohibits its analysts and persons reporting to analysts from serving as an officer, director, or advisory board member of any companies that the analysts cover. Our salespeople, traders,
and other professionals or affiliates may provide oral or written market commentary or trading strategies to our clients that reflect opinions that are contrary to the opinions expressed herein, and our proprietary
trading and investing businesses may make investment decisions that are inconsistent with the recommendations expressed herein. In reviewing these materials, you should be aware that any or all of the foregoing
among other things, may give rise to real or potential conflicts of interest. MOSt and its affiliated company(ies), their directors and employees and their relatives may; (a) from time to time, have a long or short position
in, act as principal in, and buy or sell the securities or derivatives thereof of companies mentioned herein. (b) be engaged in any other transaction involving such securities and earn brokerage or other compensation
or act as a market maker in the financial instruments of the company(ies) discussed herein or act as an advisor or lender/borrower to such company(ies) or may have any other potential conflict of interests with
respect to any recommendation and other related information and opinions.; however the same shall have no bearing whatsoever on the specific recommendations made by the analyst(s), as the recommendations
made by the analyst(s) are completely independent of the views of the affiliates of MOSt even though there might exist an inherent conflict of interest in some of the stocks mentioned in the research report
Reports based on technical and derivative analysis center on studying charts company's price movement, outstanding positions and trading volume, as opposed to focusing on a company's fundamentals and, as
such, may not match with a report on a company's fundamental analysis. In addition MOST has different business segments / Divisions with independent research separated by Chinese walls catering to different set
of customers having various objectives, risk profiles, investment horizon, etc, and therefore may at times have different contrary views on stocks sectors and markets.
Unauthorized disclosure, use, dissemination or copying (either whole or partial) of this information, is prohibited. The person accessing this information specifically agrees to exempt MOSt or any of its affiliates or
employees from, any and all responsibility/liability arising from such misuse and agrees not to hold MOSt or any of its affiliates or employees responsible for any such misuse and further agrees to hold MOSt or any of
its affiliates or employees free and harmless from all losses, costs, damages, expenses that may be suffered by the person accessing this information due to any errors and delays. The information contained herein is
based on publicly available data or other sources believed to be reliable. Any statements contained in this report attributed to a third party represent MOSt’s interpretation of the data, information and/or opinions
provided by that third party either publicly or through a subscription service, and such use and interpretation have not been reviewed by the third party. This Report is not intended to be a complete statement or
summary of the securities, markets or developments referred to in the document. While we would endeavor to update the information herein on reasonable basis, MOSt and/or its affiliates are under no obligation to
update the information. Also there may be regulatory, compliance, or other reasons that may prevent MOSt and/or its affiliates from doing so. MOSt or any of its affiliates or employees shall not be in any way
responsible and liable for any loss or damage that may arise to any person from any inadvertent error in the information contained in this report. MOSt or any of its affiliates or employees do not provide, at any time,
any express or implied warranty of any kind, regarding any matter pertaining to this report, including without limitation the implied warranties of merchantability, fitness for a particular purpose, and non-infringement.
The recipients of this report should rely on their own investigations.
This report is intended for distribution to institutional investors. Recipients who are not institutional investors should seek advice of their independent financial advisor prior to taking any investment decision based on
this report or for any necessary explanation of its contents.
Most and it’s associates may have managed or co-managed public offering of securities, may have received compensation for investment banking or merchant banking or brokerage services, may have received any
compensation for products or services other than investment banking or merchant banking or brokerage services from the subject company in the past 12 months.
Most and it’s associates have not received any compensation or other benefits from the subject company or third party in connection with the research report.
Subject Company may have been a client of Most or its associates during twelve months preceding the date of distribution of the research report
MOSt and/or its affiliates and/or employees may have interests/positions, financial or otherwise of over 1 % at the end of the month immediately preceding the date of publication of the research in the securities
mentioned in this report. To enhance transparency, MOSt has incorporated a Disclosure of Interest Statement in this document. This should, however, not be treated as endorsement of the views expressed in the
report.
Motilal Oswal Securities Limited is under the process of seeking registration under SEBI (Research Analyst) Regulations, 2014.
There are no material disciplinary action that been taken by any regulatory authority impacting equity research analysis activities
Analyst Certification
The views expressed in this research report accurately reflect the personal views of the analyst(s) about the subject securities or issues, and no part of the compensation of the research analyst(s) was, is, or will be
directly or indirectly related to the specific recommendations and views expressed by research analyst(s) in this report. The research analysts, strategists, or research associates principally responsible for preparation
of MOSt research receive compensation based upon various factors, including quality of research, investor client feedback, stock picking, competitive factors and firm revenues
Disclosure of Interest Statement
Analyst ownership of the stock
Served as an officer, director or employee
AMARA RAJA BATTERIES
No
No
Disclosures
Amara Raja Batteries
Regional Disclosures (outside India)
For U.S.
This report is not directed or intended for distribution to or use by any person or entity resident in a state, country or any jurisdiction, where such distribution, publication, availability or use would be contrary to law,
regulation or which would subject MOSt & its group companies to registration or licensing requirements within such jurisdictions.
Motilal Oswal Securities Limited (MOSL) is not a registered broker - dealer under the U.S. Securities Exchange Act of 1934, as amended (the"1934 act") and under applicable state laws in the United States. In
addition MOSL is not a registered investment adviser under the U.S. Investment Advisers Act of 1940, as amended (the "Advisers Act" and together with the 1934 Act, the "Acts), and under applicable state laws in the
United States. Accordingly, in the absence of specific exemption under the Acts, any brokerage and investment services provided by MOSL, including the products and services described herein are not available to or
intended for U.S. persons.
This report is intended for distribution only to "Major Institutional Investors" as defined by Rule 15a-6(b)(4) of the Exchange Act and interpretations thereof by SEC (henceforth referred to as "major institutional
investors"). This document must not be acted on or relied on by persons who are not major institutional investors. Any investment or investment activity to which this document relates is only available to major
institutional investors and will be engaged in only with major institutional investors. In reliance on the exemption from registration provided by Rule 15a-6 of the U.S. Securities Exchange Act of 1934, as amended (the
"Exchange Act") and interpretations thereof by the U.S. Securities and Exchange Commission ("SEC") in order to conduct business with Institutional Investors based in the U.S., MOSL has entered into a chaperoning
agreement with a U.S. registered broker-dealer, Motilal Oswal Securities International Private Limited. ("MOSIPL"). Any business interaction pursuant to this report will have to be executed within the provisions of this
chaperoning agreement.
The Research Analysts contributing to the report may not be registered /qualified as research analyst with FINRA. Such research analyst may not be associated persons of the U.S. registered broker-dealer, MOSIPL,
and therefore, may not be subject to NASD rule 2711 and NYSE Rule 472 restrictions on communication with a subject company, public appearances and trading securities held by a research analyst account.
Motilal Oswal Capital Markets Singapore Pte Limited is acting as an exempt financial advisor under section 23(1)(f) of the Financial Advisers Act(FAA) read with regulation 17(1)(d) of the Financial Advisors
Regulations and is a subsidiary of Motilal Oswal Securities Limited in India. This research is distributed in Singapore by Motilal Oswal Capital Markets Singapore Pte Limited and it is only directed in Singapore to
accredited investors, as defined in the Financial Advisers Regulations and the Securities and Futures Act (Chapter 289), as amended from time to time.
In respect of any matter arising from or in connection with the research you could contact the following representatives of Motilal Oswal Capital Markets Singapore Pte Limited:
Anosh Koppikar
Kadambari Balachandran
Email : anosh.Koppikar@motilaloswal.com
Email : kadambari.balachandran@motilaloswal.com
Contact : (+65)68189232
Contact : (+65) 68189233 / 65249115
Office Address : 21 (Suite 31),16 Collyer Quay,Singapore 04931
For Singapore
28 January 2015
Motilal Oswal Securities Ltd
Motilal Oswal Tower, Level 9, Sayani Road, Prabhadevi, Mumbai 400 025
Phone: +91 22 3982 5500 E-mail: reports@motilaloswal.com
10