30 January 2015
1QFY15 Results Update | Sector:
Capital Goods
Siemens
BSE SENSEX
29,183
Bloomberg
Equity Shares (m)
M.Cap. (INR b) / (USD b)
52-Week Range (INR)
1, 6, 12 Rel. Per (%)
Avg Val (INRm)/Vol ‘000
Free float (%)
S&P CNX
8,809
SIEM IN
356.1
370.4/6
1,083/512
10/5/31
323/389
25.0
CMP: INR1,040
TP: INR930 (-11%)
Sell
Operating performance above estimates, Material costs at lowest levels in
past 10-12 years supported by sharp EUR depreciation
n
Financials & Valuation (INR Billion)
Y/E SEP
Net Sales
EBITDA
Adj PAT
AdjEPS(INR)
EPS Gr (%)
BV/Sh(INR)
RoE (%)
RoCE (%)
Valuations
P/E (x)
P/BV (x)
119.5
8.5
73.4
7.3
55.6
6.8
2014 2015E 2016E
106.6 112.2
5.9
3.1
8.7
82.5
7.4
8.3
9.1
5.0
14.2
62.8
10.6
11.7
128.9
11.1
6.7
18.7
31.9
152.8
12.6
13.7
n
n
122.9 143.4
Estimate change
TP change
Rating change
64%
n
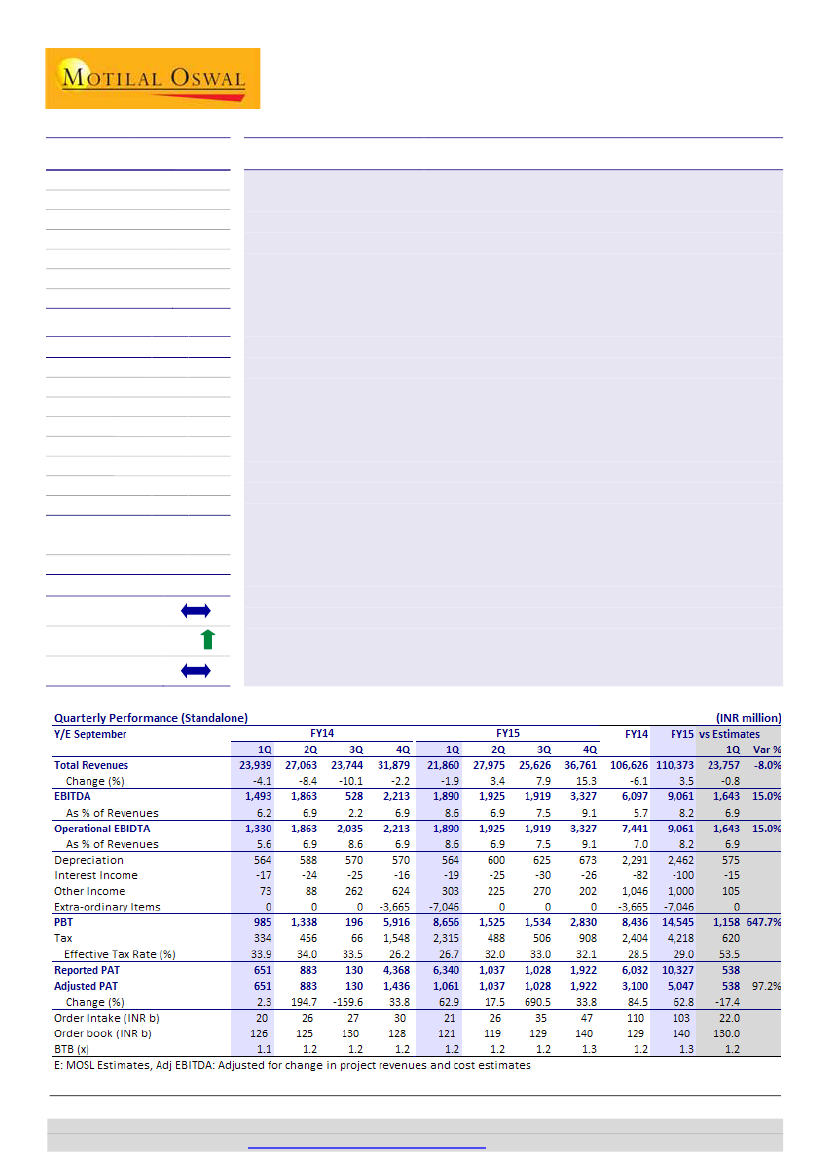
Operating performance above expectation:
SIEM’s 1QFY15 operating
performance have been above estimates, with adjusted revenues at INR23.2b
(down 1.9% YoY) vs estimates of INR23.8b, Adj EBIDTA margins at 8.6% (up
309bp YoY) vs estimates of 6.9% and adj net profit of INR1.1b (up 63% YoY) vs
estimates of INR538m. Exceptional gain pertains to sale of Metal Technologies
business to VAI Metals (Post tax gains at INR5.3b).
Material costs at lowest levels in past 10-12 years supported by sharp EUR
depreciation:
Importantly, material costs for SIEM has declined to just 65.5% in
1QFY15 and is at the lowest levels in the past 10-12 years. We believe that this
is possibly supported by the sharp appreciation of 8% in INR vs EUR in the last
one year. Sustainability of the same will be keenly monitored. For SIEM, Raw
Material imports in FY14 comprised of 55% of the total RM costs, and of this,
~82% was procured from SIEM AG / Group companies; thus the company has
strong leverage to currency volatility. Also, staff cost at INR3.3b are lower by
2.3%; during September 2014, employees stood at 10,933 vs 11,469 YoY.
Order inflows stable; book-to-bill at 1.2x:
Order intake for the quarter stood at
INR20.9b vs INR20.1b in 1QFY14, stable YoY. For FY14 order intake was at
INR103.2b vs INR109.6b in FY13, declining by 6% on YoY basis. Book to Bill has
remained stable at 1.2x.
Valuations at premium; maintain Sell:
At the CMP, SIEM trades at 73x / 56x its
FY15E / FY16E EPS of INR14.2/18.7. Given the premium valuations, we maintain
Sell
rating with revised TP of INR930 (we shift to DCF based valuation).
Satyam Agarwal
(AgarwalS@MotilalOswal.com); +91 22 3982 5410
Amit Shah
(Amit.Shah@MotilalOswal.com)
/ Nirav Vasa
(Nirav.Vasa@MotilalOswal.com)
Investors are advised to refer through disclosures made at the end of the Research Report.
Motilal Oswal research is available on
www.motilaloswal.com/Institutional-Equities,
Bloomberg, Thomson Reuters, Factset and S&P Capital.

Siemens
Operating performance above estimates, Material costs at lowest levels in
past 10-12 years supported by sharp EUR depreciation
n
n
n
n
n
SIEM’s 1QFY15 operating performance have been above estimates, with
adjusted revenues at INR23.2b (down 1.9% YoY) vs estimates of INR23.8b, Adj
EBIDTA margins at 8.6% (up 309bp YoY) vs estimates of 6.9%. Adjusted EBIDTA
stood at INR1.9b up 42% YoY led by savings in material costs and also cost
optimization initiatives. SIEM reported adjusted net profit of INR1.1 (up 63%
YoY) vs estimates of INR538m.
Exceptional gain during the quarter stands at INR7b, on sale of Metal
Technologies business to VAI Metals Technologies (subsidiary of Siemens VAI
Metals, Germany). Post tax gains on the transaction stands at INR5.3b. Also,
SIEM has changed accounting policy for revenue recognition of the healthcare
business, and thus the net sales are lower by INR1.8b (including earlier years by
INR1b).
Importantly, material costs for SIEM has declined to just 65.5% in 1QFY15 and is
at the lowest levels in the past 10-12 years. We believe that this is possibly
supported by the sharp appreciation of 8% in INR vs EUR in the last one year.
Sustainability of the same will be keenly monitored. For SIEM, Raw Material
imports in FY14 comprised of 55% of the total RM costs, and of this, ~82% was
procured from SIEM AG / Group companies.
Also, staff cost at INR3.3b are lower by 2.3%; during September 2014,
employees stood at 10,933 vs 11,469 YoY. Savings in material costs and tight
control on staff expenses has led to adjusted EBIDTA margins at 8.6% in 1QFY15,
which is commendable, given the negative operating leverage.
Wef October 2014, SEIM has acquired 100% equity shares of Siemens Rail
Automation Private Limited from Siemens International Holding BV, Netherlands
(99 99%) and Siemens AG (0.01%) for INR550m.
Exhibit 1: Adjusted Revenues stable (down 1.9% YoY) despite Exhibit 2: EBITDA margins improve supported by savings in
constrained environment
material costs
Revenue (INR b)
11
2
11
21 37
16
17
37
-3
-7
23
Revenue Growth (%)
31
8
-6
0
-2
-2 -4
-9-10
-13
-27
EBITDA (INR m)
EBITDA Margin (%)
1
2
6 15
-15
Source: MOSL, Company
30 January 2015
2

Siemens
Exhibit 3: Raw Material costs at lowest levels in past 10-12 Exhibit 4: Staff costs stable, employee numbers have declined
years, possibly supported by currency tailwinds
in FY14 (INR m)
RM cost as a % to sales
Emp Cost
No of Emp (000)
6.5
6.7
7.5
10.8
11.2
11.5
10.9
Source: MOSL, Company
Order inflows stable, Book to Bill at 1.2x
n
n
Order intake for the quarter stood at INR20.9b vs INR20.1b in 1QFY14, stable
YoY. For FY14 order intake was at INR103.2b vs INR109.6b in FY13, declining by
6% on YoY basis. Book to Bill has remained stable at 1.2x.
SIEM’s product portfolio comprises mainly of late cycle products related to
infrastructural and power transmission capex. Hence, uptick in order intake is
expected once ordering activity picks up in these sectors.
Exhibit 6: Book to Bill remains at 1.2x
Order Book (INR b)
35
1.2 1.3 1.2
20
2627
30
21
1.6
1.5 1.5
1.3 1.2
1.6
1.5 1.4
BTB (x,TTM)
1.1
1.2
Exhibit 5: Order intake stable
Order Intake (INR b)
52
40
26
24
21 201923
2220
30
33
23
2728
18
2729
20
2826
1.2 1.2 1.2
1.2 1.2
1.0 1.0
1.2 1.1 1.2 1.2
1.2
1.1
1.0
Source: MOSL, Company
30 January 2015
3

Siemens
Exhibit 7: Quarterly Performance (INR m)
FY14
1Q
Revenues (INR m)
Power and Gas
Energy Management
Building technologies
Mobility
digital factory
Process Industries and rives
Healthcare
Metals Technologies
Others
Gross Sales
Less: inter segment revenue
Net Sales
EBIT (INR m)
Power and gas
Energy management
Building technologies
Mobility
digital factory
Process Industries and rives
Healthcare
Metals Technologies
Others
Total EBIT
Interest income net off expenses
Exceptional items
Profit before tax
EBIT Margin %
Power and gas
Energy management
Building technologies
Mobility
Digital factory
Process Industries and rives
Healthcare
Metals Technologies
Others
Total EBIT
4,455
6,206
683
2,193
3,594
3,958
2,493
1,876
104
25,561
1,623
23,939
4Q
4,854
9,478
881
2,819
4,420
5,534
3,978
1,919
164
34,047
2,168
31,879
FY15
1Q
4,494
5,832
702
1,784
3,884
3,612
1,409
1,505
109
23,330
1,471
21,860
FY14
15,626
29,549
3,037
8,606
15,793
18,844
14,442
7,559
478
113,933
7,308
106,626
896
38
47
9
28
83
(355)
(28)
54
771
52
162
985
(160)
829
37
269
212
507
388
(258)
442
2,265
(14)
3,665
5,916
491
325
55
98
323
72
55
(103)
42
1,358
252
7,046
8,656
(206)
1,852
197
348
891
713
430
(400)
723
4,549
60
3,827
8,436
20.1
0.6
6.8
0.4
0.8
2.1
(14.3)
(1.5)
51.4
3.2
(3.3)
8.7
4.2
9.5
4.8
9.2
9.8
(13.4)
269.6
7.1
10.9
5.6
7.9
5.5
8.3
2.0
3.9
(6.9)
38.0
6.2
(1.3)
6.3
6.5
4.0
5.6
3.8
3.0
(5.3)
151.2
4.3
Capital Employed
Power and gas
3,579
1,748
2,516
Energy management
17,482
14,788
15,173
Building technologies
(284)
(419.48)
(293)
Mobility
1,479
1,471
2,690
digital factory
2,650
2,470
2,592
Process Industries and rives
4,294
3,432
3,814
Healthcare
(200)
(785)
(440)
Metals Technologies
2,565
2,308
0
Others
868
648
1,330
unallocated (including cash and cash equivalent)
8,500
18,095
22,712
Total Capital Employed
40,933
43,757
50,095
Siemens has changed reporting structure from 1QFY15 and hence data points are limited
1,748
14,788
(419)
1,471
2,470
3,432
(785)
2,308
648
18,095
43,757
30 January 2015
4

Siemens
Working Capital cycle has also witnessed improvement in September 2014
n
Working capital cycle has improved sequentially from 61 days to 52 days led by
better receivable days management. Receivables days have reduced from 152
days to 142 days sequentially.
Exhibit 8: Stable working Capital cycle
Days
Inventory
Receivables
Loans and Advances
Other Current Assets
Trade Payables
Other Current Liabilities
Provisions
Net Working Capital
4QFY11
25
129
42
30
73
67
56
30
2QFY12
29
133
35
27
68
57
39
59
4QFY12
27
135
32
31
76
66
49
32
2QFY13
32
151
33
28
79
52
45
67
4QFY13 2QFY14 4QFY14
31
33
37
145
152
142
36
40
49
27
27
29
84
97
96
54
56
59
53
37
51
49
61
52
Source: MOSL, Company
Maintain Sell rating
n
n
n
n
For SIEM, share of products and services has increased meaningfully to 58% in
FY14, from lows of 34% in FY09; and we expect the contribution to increase
further to 62% in FY15. This is a combination of sustained efforts towards: i) new
product launches / acquisitions (~7 since FY06) / Manufacturing facilities (22
factories now vs 7 in FY05), etc and ii) headwinds to the investment climate
impacting projects business. Services business has also witnessed ramp-up and
contributed 6.8% of revenues in FY13, vs 4.5% in FY12
SIEM earnings have historically been volatile, and are impacted by multitude of
factors, including: A] Project business contributes to ~42% of SIEM’s revenues
and margins are a function of i) commodity prices as a meaningful part of these
are fixed price contracts ii) time delays, leading to cost over runs and also
provisions for liquidated damages iii) delayed pick-up by customers impacting
fixed cost absorption B] Currency movement, given that 55% of the raw
materials are imported (RM cost was 71% of revenues in FY14) and thus the
sharp EUR depreciation vs INR over the past 18 months has supported margins.
Correcting the manufacturing footprint and increasing localization has been an
important structural overhang for SIEM that is yet to be decisively addressed, in
our opinion.
At the CMP, SIEM trades at 73x / 56x its FY15E / FY16E EPS of INR14.2/18.7.
Given the premium valuations, we maintain
Sell
rating with revised TP of INR930
(we shift to DCF based valuation).
30 January 2015
5

Siemens
Exhibit 9: One-year forward P/E
150
100
59.6
50
0
47.5
36.1
98.9
P/E (x)
5 Yrs Avg(x)
15 Yrs Avg(x)
10 Yrs Avg(x)
Exhibit 10: One-year forward P/BV
30.0
20.0
10.0
0.0
8.9
7.2
6.6
P/B (x)
5 Yrs Avg(x)
15 Yrs Avg(x)
10 Yrs Avg(x)
7.9
Source: MOSL, Company
Exhibit 11: Summary of Recommendation
M-Cap
CMP
EPS (INR)
P/E (x)
EV/EBITDA (x)
RoE (%)
Company
Rating
USD
INR
FY15E FY16E FY17E FY15E FY16E FY17E FY15E FY16E FY17E FY15E FY16E FY17E
ABB#
Neutral
4.4
1,285 11.2 17.1 27.4 114.9
75.2
46.9
48.8
37.0
26.2
8.6
12.5
18.2
BHEL
Buy
11.5
292
7.9 12.7 18.2
36.8
22.9
16.1
21.2
12.7
8.5
5.8
8.7
11.5
Crompton
Buy
2.0
190
5.3 10.3 14.5
35.7
18.4
13.1
17.6
12.0
8.6
8.7
15.3
18.8
Cummins
Buy
4.0
889 23.8 27.2 33.1
37.3
32.7
26.9
31.7
27.9
23.0
24.1
25.2
28.1
L&T
Buy
25.4
1,700 45.0 57.2 80.1
37.8
29.7
21.2
22.8
20.0
15.3
13.6
14.0
16.2
Siemens##
Sell
6.0
1,040
8.7 14.2 18.7 119.5
73.4
55.6
60.4
38.7
30.9
7.4
10.6
12.6
Thermax
Buy
2.2
1,146 25.0 33.0 46.1
45.8
34.8
24.8
28.4
20.8
15.4
14.1
17.0
21.0
Havells
Neutral
2.6
259
8.6 10.2 13.1
30.2
25.4
19.7
19.2
15.1
11.9
27.8
28.1
30.1
Voltas
Buy
1.3
269 10.3 13.6 16.6
26.0
19.8
16.2
20.8
15.5
12.0
15.6
17.9
19.0
BHE
Buy
4.3
3,332 151.8 179.7 197.6
21.9
18.5
16.9
17.4
14.1
12.2
15.3
15.9
15.4
KEC Int
NR
0.4
94
5.8
9.1 13.2
16.3
10.3
7.1
7.2
4.9
3.9
10.1
14.3
17.9
VA TW
Buy
0.7
1,613 48.1 64.4 85.0
33.6
25.1
19.0
17.0
12.9
9.9
13.5
15.9
17.9
# Year end December; ## Year end September
Source: MOSL, Company
30 January 2015
6

Siemens
Corporate profile: Siemens India
Company description
Siemens India, a 75% subsidiary of Siemens AG, is a
strong play on infrastructure, industry and
transport systems. The company derives ~45% of
revenues from power (largely T&D) and industry
sectors each. The company also has a strong
presence in healthcare diagnostics products.
Exhibit 12: Sensex rebased
1,200
1,000
800
600
400
Jan-14
May-14
Jul-14
Oct-14
Jan-1
Siemens
Sensex - Rebased
Exhibit 13: Shareholding pattern (%)
Dec-14
Promoter
DII
FII
Others
75.0
9.2
4.5
11.3
Sep-14
75.0
9.1
4.4
11.5
Dec-13
75.0
8.7
3.6
12.8
Exhibit 14: Top holders
Holder Name
LIC of India
% Holding
4.1
Note: FII Includes depository receipts
Exhibit 15: Top management
Name
Deepak S Parekh
Sunil Mathur
Christian Rummel
Designation
Chairman
Managing Director & CEO
Executive Director & CFO
Exhibit 16: Directors
Name
Deepak S Parekh*
Sunil Mathur
Pradip V Nayak*
Yezdi H Malegam*
Keki B Dadiseth*
Darius C Shroff*
Name
Narendra J Jhaveri*
Joe Kaeser
Roland Busch
Johannes Apitzsch
Mariel von Drathen
Christian Rummel
*Independent
Exhibit 17: Auditors
Name
S R B C & Co LLP
S R Batliboi & Associates LLP
R Nanabhoy & Co
Type
Statutory
Statutory
Cost Auditor
Exhibit 18: MOSL forecast v/s consensus
EPS
(INR)
FY15
FY16
FY17
MOSL
forecast
14.2
18.7
24.9
Consensus
forecast
14.0
20.1
26.0
Variation
(%)
1.5
-6.8
-4.4
30 January 2015
7

Siemens
Financials and valuations
Income Statement (Standalone)
Y/E September
Total Revenues
Change (%)
Raw Materials
Staff Cost
SGA Expenses
EBITDA
Change (%)
% of Total Rev.
Depreciation
Interest
Other Income
EO Items (net)
PBT
Tax
Rate (%)
PAT
Adjusted PAT
Change (%)
2010
93,733
11.2
68,463
6,325
6,280
12,666
27
13.5
1,016
106
1,043
0
12,587
4,315
34.3
8,272
8,272
26.5
2011
120,289
28.3
89,799
9,174
7,964
13,352
5
11.1
1,522
127
1,048
21
12,772
4,295
33.6
8,476
8,456
2.2
2012
129,199
7.4
98,483
11,959
9,844
8,913
-33
6.9
2,010
270
575
-1,999
5,209
1,777
34.1
3,432
5,031
-40.5
2013
113,525
-12.1
85,368
13,524
10,427
4,206
-53
3.7
2,502
189
345
325
2,185
246
11.3
1,939
1,679
-66.6
2014
106,626
-6.1
75,542
14,118
11,023
5,943
41
5.6
2,291
82
1,039
3,827
8,436
2,404
28.5
6,032
3,100
84.7
2015E
112,223
5.2
75,301
16,683
11,177
9,061
52
8.1
2,462
100
1,000
7,046
14,545
4,218
29.0
10,327
5,047
62.8
(INR Million)
2016E
128,913
14.9
86,857
18,532
12,434
11,090
22
8.6
2,591
100
1,250
0
9,649
2,991
31.0
6,658
6,658
31.9
Balance Sheet (Standalone)
Y/E September
Share Capital
Reserves
Net Worth
Loans
Minority Interest
Net Deferred Tax Liab
Capital Employed
Gross Fixed Assets
Less: Depreciation
Net Fixed Assets
Capital WIP
Investments
Curr. Assets
Inventory
Debtors
Cash & Bank Balance
Loans & Advances
Other Current assets
Current Liab. & Prov.
Creditors
Other Liabilities
Provisions
Net Current Assets
Application of Funds
E: MOSL Estimates
2010
674
34,103
34,778
2
-1,313
33,467
13,549
6,209
7,340
2,465
3,885
79,281
6,822
33,023
18,534
12,390
8,512
59,505
29,151
14,704
15,651
19,776
33,467
0
2011
681
37,481
38,162
0
-1,889
36,273
19,560
8,269
11,291
2,195
405
85,953
8,078
41,759
12,750
13,708
9,658
63,571
28,280
17,252
18,039
22,382
36,274
1
2012
704
38,922
39,626
0
-3,176
36,450
24,356
10,234
14,122
850
410
87,889
9,431
46,897
9,768
11,031
10,762
66,821
32,437
17,232
17,152
21,068
36,451
1
2013
712
39,591
40,303
0
-4,297
36,006
26,852
13,063
13,789
889
432
79,033
9,334
44,373
6,038
11,073
8,215
58,137
31,044
11,011
16,082
20,896
36,007
1
2014
712
43,044
43,756
0
-3,738
40,018
28,114
14,558
13,556
409
82
84,803
10,472
40,620
11,210
14,134
8,367
58,832
32,323
12,043
14,466
25,971
40,018
0
2015E
712
50,350
51,062
0
-3,738
47,324
29,664
17,020
12,644
1,000
82
96,075
10,761
42,429
20,133
13,528
9,224
62,477
32,805
13,836
15,836
33,598
47,325
(INR Million)
2016E
712
53,697
54,409
0
-3,738
50,671
31,214
19,611
11,603
1,000
82
109,121
11,655
46,267
27,182
13,421
10,596
71,135
36,900
16,600
17,635
37,986
50,672
1
1
30 January 2015
8

Siemens
Financials and valuations
Ratios
Y/E September
Basic (INR)
EPS
Growth (%)
Cash EPS
Book Value
DPS
Payout (incl. Div. Tax.)
Valuation (x)
P/E (Standalone)
Cash P/E
EV/EBITDA
EV/Sales
Price/Book Value
Dividend Yield (%)
Profitability Ratios (%)
EBITDA Margin
Net Margin
RoE
RoCE
Turnover Ratios
Debtors (Days)
Inventory (Days)
Creditors. (Days)
Asset Turnover (x)
Leverage Ratio
Debt/Equity (x)
2010
24.5
26.5
27.6
103.2
5.0
23.8
42.4
37.7
16.3
2.2
10.1
0.7
13.5
8.8
25.9
27.1
129
27
114
2.8
0.0
11.1
7.0
23.2
24.5
127
25
86
3.3
0.0
6.9
2.7
12.9
14.3
132
27
92
3.5
0.0
2011
24.8
1.2
29.3
112.1
6.0
28.1
2012
14.8
(40.5)
20.7
116.4
6.2
48.8
2013
4.8
(67.7)
11.9
114.5
5.1
124.1
129.3
87.6
50.1
1.8
9.1
0.5
3.7
1.7
4.2
5.1
143
30
100
3.2
0.0
2014
8.7
82.5
15.1
122.9
6.0
82.7
119.5
68.7
60.1
3.3
8.5
0.6
5.6
5.7
7.4
8.3
139
36
111
2.7
0.0
2015E
14.2
62.8
21.1
143.4
7.2
59.8
73.4
49.3
38.5
3.1
7.3
0.7
8.1
9.2
10.6
11.7
138
35
107
2.4
0.0
2016E
18.7
31.9
26.0
152.8
7.9
49.7
55.6
40.0
30.6
2.6
6.8
0.8
8.6
5.2
12.6
13.7
131
33
104
2.5
0.0
Cash Flow Statement
Y/E September
PBT before EO Items
Add : Depreciation
Interest
Less: Directtaxespaid
(Inc)/Dec in WC
CF from Operations
EO Income
CF from oper. Incl. EOitems
(Inc)/dec in FA
(Pur)/Sale of Investments
CF from Investments
(Inc)/Dec in Networth
Inc/(Dec) in Debt
Less : Interest Paid
Dividend Paid
CF from Fin. Activity
Inc/Dec of Cash
Add: Beginning Bal.
Closing Balance
E: MOSL Estimates
2010
12,587
1,016
106
4,315
2,054
11,448
0
11,448
-3,469
885
-2,584
-888
-3
106
1,966
-4,778
4,087
14,449
18,536
2011
12,751
1,522
127
4,295
-8,715
1,389
21
1,410
-5,203
3,480
-1,723
-3,295
-2
127
2,373
-5,472
-5,785
18,534
12,749
2012
7,208
2,010
270
1,777
-5,400
2,311
-1,999
312
-3,496
-5
-3,501
-800
0
270
2,455
207
-2,982
12,750
9,768
2013
1,860
2,502
189
246
-4,275
30
325
355
-2,208
-22
-2,230
-299
0
189
2,084
-1,855
-3,730
9,768
6,038
2014
4,609
2,291
82
2,404
1,467
6,045
3,827
9,872
-1,578
350
-1,228
543
0
82
2,564
-3,473
5,172
6,038
11,210
(INR Million)
2015E
7,499
2,462
100
4,218
1,296
7,138
7,046
14,184
(2,141)
0
(2,141)
0
0
100
3,021
(3,121)
8,923
11,210
20,133
2016E
9,649
2,591
100
2,991
2,661
12,010
0
12,010
(1,550)
0
(1,550)
0
0
100
3,311
(3,411)
7,049
20,133
27,182
30 January 2015
9

This document has been prepared by Motilal Oswal Securities Limited (hereinafter referred to as Most) to provide information about the company(ies) and/sector(s), if any, covered in the report and may be
distributed by it and/or its affiliated company(ies). This report is for personal information of the selected recipient/s and does not construe to be any investment, legal or taxation advice to you. This research report does
not constitute an offer, invitation or inducement to invest in securities or other investments and Motilal Oswal Securities Limited (hereinafter referred as MOSt) is not soliciting any action based upon it. This report is not
for public distribution and has been furnished to you solely for your general information and should not be reproduced or redistributed to any other person in any form. This report does not constitute a personal
recommendation or take into account the particular investment objectives, financial situations, or needs of individual clients. Before acting on any advice or recommendation in this material, investors should consider
whether it is suitable for their particular circumstances and, if necessary, seek professional advice. The price and value of the investments referred to in this material and the income from them may go down as well as
up, and investors may realize losses on any investments. Past performance is not a guide for future performance, future returns are not guaranteed and a loss of original capital may occur.
MOSt and its affiliates are a full-service, integrated investment banking, investment management, brokerage and financing group. We and our affiliates have investment banking and other business relationships with a
some companies covered by our Research Department. Our research professionals may provide input into our investment banking and other business selection processes. Investors should assume that MOSt and/or
its affiliates are seeking or will seek investment banking or other business from the company or companies that are the subject of this material and that the research professionals who were involved in preparing this
material may educate investors on investments in such business. The research professionals responsible for the preparation of this document may interact with trading desk personnel, sales personnel and other
parties for the purpose of gathering, applying and interpreting information. Our research professionals are paid on the profitability of MOSt which may include earnings from investment banking and other business.
MOSt generally prohibits its analysts, persons reporting to analysts, and members of their households from maintaining a financial interest in the securities or derivatives of any companies that the analysts cover.
Additionally, MOSt generally prohibits its analysts and persons reporting to analysts from serving as an officer, director, or advisory board member of any companies that the analysts cover. Our salespeople, traders,
and other professionals or affiliates may provide oral or written market commentary or trading strategies to our clients that reflect opinions that are contrary to the opinions expressed herein, and our proprietary
trading and investing businesses may make investment decisions that are inconsistent with the recommendations expressed herein. In reviewing these materials, you should be aware that any or all of the foregoing
among other things, may give rise to real or potential conflicts of interest. MOSt and its affiliated company(ies), their directors and employees and their relatives may; (a) from time to time, have a long or short position
in, act as principal in, and buy or sell the securities or derivatives thereof of companies mentioned herein. (b) be engaged in any other transaction involving such securities and earn brokerage or other compensation
or act as a market maker in the financial instruments of the company(ies) discussed herein or act as an advisor or lender/borrower to such company(ies) or may have any other potential conflict of interests with
respect to any recommendation and other related information and opinions.; however the same shall have no bearing whatsoever on the specific recommendations made by the analyst(s), as the recommendations
made by the analyst(s) are completely independent of the views of the affiliates of MOSt even though there might exist an inherent conflict of interest in some of the stocks mentioned in the research report
Reports based on technical and derivative analysis center on studying charts company's price movement, outstanding positions and trading volume, as opposed to focusing on a company's fundamentals and, as
such, may not match with a report on a company's fundamental analysis. In addition MOST has different business segments / Divisions with independent research separated by Chinese walls catering to different set
of customers having various objectives, risk profiles, investment horizon, etc, and therefore may at times have different contrary views on stocks sectors and markets.
Unauthorized disclosure, use, dissemination or copying (either whole or partial) of this information, is prohibited. The person accessing this information specifically agrees to exempt MOSt or any of its affiliates or
employees from, any and all responsibility/liability arising from such misuse and agrees not to hold MOSt or any of its affiliates or employees responsible for any such misuse and further agrees to hold MOSt or any of
its affiliates or employees free and harmless from all losses, costs, damages, expenses that may be suffered by the person accessing this information due to any errors and delays. The information contained herein is
based on publicly available data or other sources believed to be reliable. Any statements contained in this report attributed to a third party represent MOSt’s interpretation of the data, information and/or opinions
provided by that third party either publicly or through a subscription service, and such use and interpretation have not been reviewed by the third party. This Report is not intended to be a complete statement or
summary of the securities, markets or developments referred to in the document. While we would endeavor to update the information herein on reasonable basis, MOSt and/or its affiliates are under no obligation to
update the information. Also there may be regulatory, compliance, or other reasons that may prevent MOSt and/or its affiliates from doing so. MOSt or any of its affiliates or employees shall not be in any way
responsible and liable for any loss or damage that may arise to any person from any inadvertent error in the information contained in this report. MOSt or any of its affiliates or employees do not provide, at any time,
any express or implied warranty of any kind, regarding any matter pertaining to this report, including without limitation the implied warranties of merchantability, fitness for a particular purpose, and non-infringement.
The recipients of this report should rely on their own investigations.
This report is intended for distribution to institutional investors. Recipients who are not institutional investors should seek advice of their independent financial advisor prior to taking any investment decision based on
this report or for any necessary explanation of its contents.
Most and it’s associates may have managed or co-managed public offering of securities, may have received compensation for investment banking or merchant banking or brokerage services, may have received any
compensation for products or services other than investment banking or merchant banking or brokerage services from the subject company in the past 12 months.
Most and it’s associates have not received any compensation or other benefits from the subject company or third party in connection with the research report.
Subject Company may have been a client of Most or its associates during twelve months preceding the date of distribution of the research report
MOSt and/or its affiliates and/or employees may have interests/positions, financial or otherwise of over 1 % at the end of the month immediately preceding the date of publication of the research in the securities
mentioned in this report. To enhance transparency, MOSt has incorporated a Disclosure of Interest Statement in this document. This should, however, not be treated as endorsement of the views expressed in the
report.
Motilal Oswal Securities Limited is under the process of seeking registration under SEBI (Research Analyst) Regulations, 2014.
There are no material disciplinary action that been taken by any regulatory authority impacting equity research analysis activities
Analyst Certification
The views expressed in this research report accurately reflect the personal views of the analyst(s) about the subject securities or issues, and no part of the compensation of the research analyst(s) was, is, or will be
directly or indirectly related to the specific recommendations and views expressed by research analyst(s) in this report. The research analysts, strategists, or research associates principally responsible for preparation
of MOSt research receive compensation based upon various factors, including quality of research, investor client feedback, stock picking, competitive factors and firm revenues
Disclosure of Interest Statement
§
Analyst ownership of the stock
§
Served as an officer, director or employee
SIEMENS
No
No
Disclosures
Siemens
Regional Disclosures (outside India)
For U.S.
This report is not directed or intended for distribution to or use by any person or entity resident in a state, country or any jurisdiction, where such distribution, publication, availability or use would be contrary to law,
regulation or which would subject MOSt & its group companies to registration or licensing requirements within such jurisdictions.
Motilal Oswal Securities Limited (MOSL) is not a registered broker - dealer under the U.S. Securities Exchange Act of 1934, as amended (the"1934 act") and under applicable state laws in the United States. In
addition MOSL is not a registered investment adviser under the U.S. Investment Advisers Act of 1940, as amended (the "Advisers Act" and together with the 1934 Act, the "Acts), and under applicable state laws in the
United States. Accordingly, in the absence of specific exemption under the Acts, any brokerage and investment services provided by MOSL, including the products and services described herein are not available to or
intended for U.S. persons.
This report is intended for distribution only to "Major Institutional Investors" as defined by Rule 15a-6(b)(4) of the Exchange Act and interpretations thereof by SEC (henceforth referred to as "major institutional
investors"). This document must not be acted on or relied on by persons who are not major institutional investors. Any investment or investment activity to which this document relates is only available to major
institutional investors and will be engaged in only with major institutional investors. In reliance on the exemption from registration provided by Rule 15a-6 of the U.S. Securities Exchange Act of 1934, as amended (the
"Exchange Act") and interpretations thereof by the U.S. Securities and Exchange Commission ("SEC") in order to conduct business with Institutional Investors based in the U.S., MOSL has entered into a chaperoning
agreement with a U.S. registered broker-dealer, Motilal Oswal Securities International Private Limited. ("MOSIPL"). Any business interaction pursuant to this report will have to be executed within the provisions of this
chaperoning agreement.
The Research Analysts contributing to the report may not be registered /qualified as research analyst with FINRA. Such research analyst may not be associated persons of the U.S. registered broker-dealer, MOSIPL,
and therefore, may not be subject to NASD rule 2711 and NYSE Rule 472 restrictions on communication with a subject company, public appearances and trading securities held by a research analyst account.
Motilal Oswal Capital Markets Singapore Pte Limited is acting as an exempt financial advisor under section 23(1)(f) of the Financial Advisers Act(FAA) read with regulation 17(1)(d) of the Financial Advisors
Regulations and is a subsidiary of Motilal Oswal Securities Limited in India. This research is distributed in Singapore by Motilal Oswal Capital Markets Singapore Pte Limited and it is only directed in Singapore to
accredited investors, as defined in the Financial Advisers Regulations and the Securities and Futures Act (Chapter 289), as amended from time to time.
In respect of any matter arising from or in connection with the research you could contact the following representatives of Motilal Oswal Capital Markets Singapore Pte Limited:
Anosh Koppikar
Kadambari Balachandran
Email : anosh.Koppikar@motilaloswal.com
Email : kadambari.balachandran@motilaloswal.com
Contact : (+65)68189232
Contact : (+65) 68189233 / 65249115
Office Address : 21 (Suite 31),16 Collyer Quay,Singapore 04931
For Singapore
30 January 2015
Motilal Oswal Securities Ltd
Motilal Oswal Tower, Level 9, Sayani Road, Prabhadevi, Mumbai 400 025
Phone: +91 22 3982 5500 E-mail: reports@motilaloswal.com
10