31 January 2015
3QFY15 Results Update | Sector:
Utilities
NTPC
BSE SENSEX
29,183
Bloomberg
Equity Shares (m)
MCap.(INR b) / (USDb)
52-Week Range (INR)
1, 6, 12 Rel. Per (%)
Free float (%)
S&P CNX
8,809
NTPC IN
8,245.5
1,187/19.2
169/111
-5/-16/-30
25
CMP: INR144
n
TP: INR177 (+23%)
Buy
Robust core business performance, upgrade earnings estimate
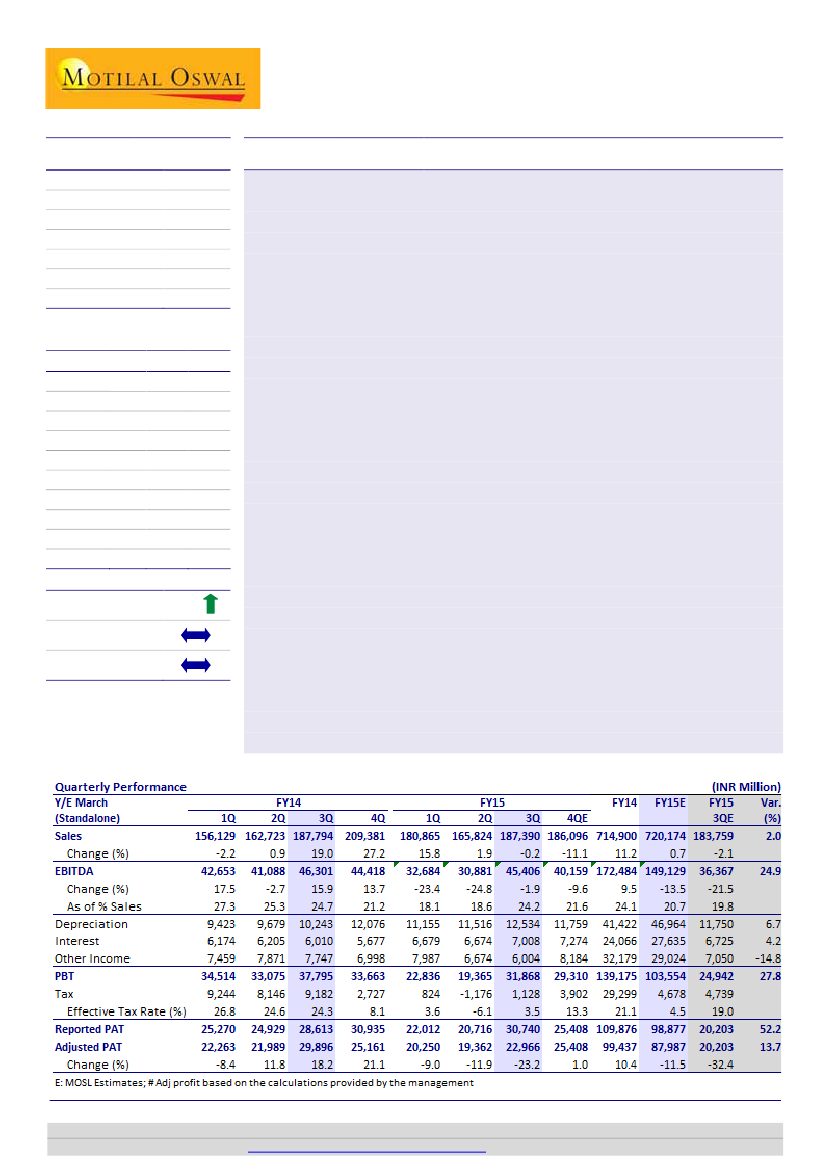
3QFY15 earnings ahead of estimate:
NTPC reported revenues of INR187.4b, flat
YoY and largely in-line with our estimate of INR184b. While revenue growth
looked muted owing to higher base and impact of new regulation, the key
highlight of the performance was strong EBIDTA at INR45.4b (though down 2%
YoY), 25% higher than our estimate. This is also credible given lower profitability
in 1HFY15 owing to new regulation. Net profit stood at INR31b, vs estimate of
INR20b though partly aided by one-offs.
Core business performance robust:
NTPC booked prior period revenues of
INR1.2b (above EBIDTA) and tax refund of INR6.5b (below PBT) for the quarter.
Recurring EBIDTA stood at INR44b, as number of projects with fixed charge under
recovery (linked to availability) came down from 5 to 2 in 9MFY15. Recurring PAT
stood at INR23b, 14% higher than estimate despite other income at INR6b was
lower than our estimate of INR7b. Higher fixed charge recovery rather than
incentive contributed to better performance, in our view, as generation/PLF was
muted.
Operational performance in-line, capacity addition back ended:
For 3QFY15,
generation stood at 61.3BUs (up 4% YoY), vs est of 60.5BUs and sales stood at
57.2BUs (up 3.5% YoY), vs estimate of 53.2BUs. Coal and Gas project PLFs too
were in-line with estimate at 81% (160bps lower YoY) and 32% (200bps lower),
respectively. Capacity addition is near NIL, while FY15E addition target is 1.8GW.
Upgrade estimate, Re-iterate Top Buy:
NTPC is our top-pick given relatively
robust business model, strong cashflow/low leverage, beneficiary of improved
demand/generation and comfort on valuation. We upgrade our FY15/16E
estimate by 9% / 5% and expect net profit of INR88b in FY15E (down 11% YoY)
and INR94b in FY16E (up 7% YoY). Stock trades at PER of 11x and P/BV of 1.3x
(RoE 12%) on FY17E basis. Bonus debenture, dividend payout provides comfort.
Buy.
AvgVal(INRm)/Vol‘000 1,136/8,137
Financials & Valuation (INR Billion)
Y/E MAR
Sales
EBITDA
NP
AdjEPS(INR)
EPS Gr. (%)
2015E 2016E 2017E
720.2
154.9
88.0
10.7
-11.4
556.6
170.1
94.1
11.4
7.0
104.2
10.6
9.2
12.6
1.4
609.3
202.3
106.6
12.9
13.2
111.2
12.0
10.5
11.1
1.3
n
BV/Sh. (INR) 110.5
RoE (%)
RoCE (%)
P/E (x)
P/BV (x)
9.9
8.6
13.5
1.3
n
Estimate change
TP change
Rating change
9/5%
n
Nalin Bhatt
(NalinBhatt@MotilalOswal.com); +91 22 3982 5429
Investors are advised to refer through disclosures made at the end of the Research Report.
Motilal Oswal research is available on
www.motilaloswal.com/Institutional-Equities,
Bloomberg, Thomson Reuters, Factset and S&P Capital.