3 February 2014
2QFY15 Results Update | Sector:
Cement
Shree Cement
BSE SENSEX
29,000
Bloomberg
S&P CNX
8,757
SRCM IN
CMP: INR10,836
TP: INR12,272 (+13%)
Buy
Equity Shares (m)
34.8
M.Cap. (INR b) / (USD
200.0/3.3
b)
52-Week Range (INR) 11755/4234
1, 6, 12 Rel. Per (%)
Avg Val INRm/Vol ‘000
Free float (%)
Financials & Valuation (INR b)
Y/E June
Sales
EBITDA
NP
Adj EPS
EPS Gr. %)
BV/Sh .INR
RoE (%)
RoCE (%)
P/E (x)
P/BV (x)
EV/EBITDA
EV/Ton.USD
2015E 2016E 2017E
68.4
16.2
6.9
199.0
-10.4
1,522
13.8
14.3
54.7
7.2
23.0
275
85.7 106.2
23.8
11.2
61.3
19.3
21.2
34.0
6.0
15.1
242
33.8
19.4
73.2
26.9
31.8
19.6
4.7
10.0
230
12/33/103
134/18
35.2
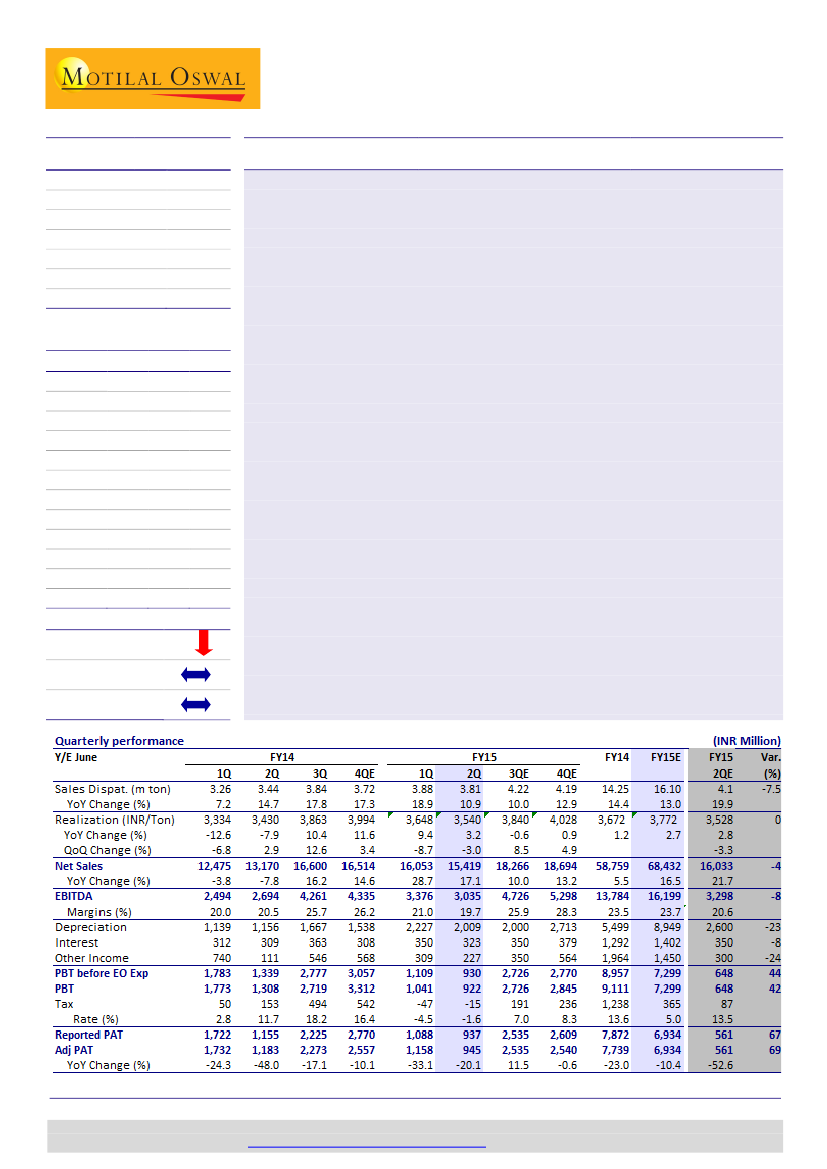
EBITDA below est. on lower volume and increase in freight cost; strong
quarter for merchant power
Volume-led revenue miss in cement:
SRCM’s 2QFY15 revenue grew 17% YoY
(-3.9% QoQ) to INR15.4b v/s estimate of INR16b. Cement revenue stood at
INR13.5b, +14% YoY (v/s est. of INR14.5b). This was led by lower volume growth of
11% YoY to 3.81mt (-1.7% QoQ) v/s estimate of 4.1mt (19.9% YoY), while
realizations fell 3% QoQ (+3.2% YoY) to INR3,540/ton (in-line).
Freight cost push and lower fixed cost absorption dent profitability:
EBITDA grew
12.7% YoY (-10% QoQ) to INR3b (v/s est. of INR3.3b), translating into margin of
19.7% (-1.3pp QoQ, -0.8pp YoY). Cement EBITDA/ton stood at INR715 (-INR101
QoQ, flat YoY) v/s estimate of INR759, led by ~2% higher cost on account of
increased freight cost (overloading restrictions in Rajasthan) and lesser absorption
of fixed cost (lower volume). Lower depreciation and prior period tax reversal
boost PAT at INR945m, -20% YoY (v/s est. of INR561m).
Strong quarter for merchant power:
Merchant power revenue was up 40% YoY
(1% QoQ) to INR1.9b led by 20% YoY (flat QoQ) volume growth to 491units and
QoQ flat realizations of INR3.92/unit (+16% YoY). EBITDA stood at ~INR309m,
translating into EBITDA/unit at INR0.63 (v/s INR0.4 in 1QFY15, INR0.6 in 2QFY14).
Cut FY16E/17E EPS by ~6%:
We cut FY16E/17E EPS by ~6% to factor (1) lower
cement volume growth of 13% in FY15E (v/s earlier 18%), (2) lower realization
growth of INR300/ton YoY in FY16E (v/s earlier est. of INR400/ton) and (3) higher
power volume and realizations. We raise FY15E EPS by 24% to factor for the lower
depreciation. This translates into FY15E/16E/17E cement EBITDA/ton of
INR1,006/1,232/1,519.
Valuation and view:
The stock trades at 15.1x/10x EV/EBITDA on FY16E/17E
and EV of USD230/ton FY17E (adjusting for merchant power assets of ~400mw).
Maintain
Buy
with an SOTP-based target price of INR12,272 (EV at USD260/ton
and implied 11.3x FY17E EV/EBITDA).
321.0 555.8
1,808 2,323
Estimate change
TP change
Rating change
6%
Jinesh Gandhi
(Jinesh@MotilalOswal.com); +91 22 3982 5416
Sandipan Pal
(Sandipan.Pal@MotilalOswal.com); +91 22 3982 5436
Investors are advised to refer through disclosures made at the end of the Research Report.
Motilal Oswal research is available on
www.motilaloswal.com/Institutional-Equities,
Bloomberg, Thomson Reuters, Factset and S&P Capital.

Shree Cement
Volume-led revenue miss in cement; beat in power business
SRCM’s 2QFY15 revenue grew 17% YoY (-3.9% QoQ) to INR 15.4b v/s estimate of
INR16b. Cement revenue stood at INR13.5b, +14% YoY (v/s est of INR14.5b).
This was led by lower volume growth of 11% YoY to 3.81mt (-1.7% QoQ) v/s est
4.1mt (19.9% YoY), while realizations dropped 3% QoQ (+3.2% YoY) to
INR3,540/ton (in line)
Merchant power revenue was up 40% YoY (1% QoQ) to INR1.9b led by 20% YoY
(flat QoQ) volume growth to 491units and QoQ flat realizations of INR3.92/unit
(+16% YoY)
Exhibit 2:
Power business recorded strong volume and
realizations
Units Sold (m units)
Realization (INR/unit)
Exhibit 1:
Cement posted lower volume growth and drop in
realizations
Realization (INR/ton)
3.5
2.5
2.3
2.6
2.7
2.5 2.8
2.9
Dispatches (m ton)
3.8 3.7 3.9 3.8
3.4
3.4
3.3
3.03.0 3.3 3.2
Source: Company, MOSL
Freight cost push and lower fixed cost absorption dent profitability
EBITDA grew 12.7% YoY (-10% QoQ) to INR3b (v/s est of INR3.3b), translating
into margin of 19.7% (-1.3pp QOQ, -0.8pp YoY).
Cement EBITDA/ton stood INR715 (-INR101 QoQ, flat YoY) v/s est of INR759, led
by ~2% beat in cost on account of higher freight cost (overloading restrictions in
Rajasthan) and lesser absorption of fixed cost (lower volume). However, a 2%
QoQ moderation in pet coke prices led sequential drop in energy cost.
EBITDA of merchant power business recorded strong profitability with EBITDA at
~INR309m (v/s estimates of INR171m), translating into EBITDA/unit at INR0.63
(v/s INR0.4 in 1QFY15, INR0.6 in 2QFY14).
Lower depreciation and prior period tax reversal boost PAT at INR945m, -20%
YoY (v/s est of INR561m). Commissioning of Waste Heat Recovery Plant for Unit
10 led higher depreciation for power business.
3 February 2015
2

Shree Cement
Exhibit 3:
EBITDA margin dropped with fall in realizations
EBITDA (INR m)
EBITDA (%)
Exhibit 4:
Trend in cement EBITDA (INR/ton)
EBITDA (INR/Ton)
Source: Company, MOSL
Exhibit 5:
Power EBITDA (INR/unit) recorded strong uptick
1.9
1.1
2.0
1.6
0.8
0.9
0.5
0.2 0.3
1.1
0.9 0.9
1.1
0.7
0.6
0.2
0.4
(0.0)
0.6
Source: Company, MOSL
Exhibit 6: Cement business income statement (INR/ton)
Net Realization
Raw Material Cost
Staff Cost
Power & fuel
Freight & selling Exp
Other Exp
Total Exp
EBITDA
EBITDA Margin (%)
2QFY15
3,540
326
287
612
855
745
2,825
715
20.2
2QFY14
3,430
265
294
575
817
763
2,715
716
20.9
YoY (%)
3
23
-2
6
5
-2
4
0
1QFY15
QoQ(%)
3,648
-3
337
-3
291
-1
628
-2
818
5
757
-2
2,831
0
817
-12
22.4
Source: Company, MOSL
Cutting FY16/17 EPS by ~6%
We are cutting FY16/17E EPS by ~6% to factor in for (1) lower cement volume
growth of 13% in FY15 (v/s earlier 18%), (2) lower realization growth of
INR300/ton YoY in FY16 (v/s earlier estimates of INR400/ton), and (3) higher
power volume and realizations.
We are raising FY15 EPS by 24% to factor in for lower depreciation. This
translates into FY15/16/17 cement EBITDA/ton of INR1,006/INR1,232/1,519.
3 February 2015
3

Shree Cement
Exhibit 7: Revised estimates
(INR B)
Net Sales
EBITDA
Net Profit
EPS (INR)
Rev
68.4
16.2
6.9
199.0
FY15E
Old
69.1
16.1
5.6
160.2
Chg (%)
-1
0.8
24.2
24.2
FY16E
Rev
Old Chg (%) Rev
85.7
85.9
0
106.2
23.8
24.8
-4.1
33.8
11.2
11.9
-6.2
19.4
321.0 342.0 -6.2
555.8
FY17E
Old Chg (%)
103.8
2
33.8
-0.2
20.6
-6.1
592.2
-6.1
Source: Company, MOSL
Valuation & view
SRCM is strongly placed among large cap peers to benefit from demand up-cycle
due to (1) strong volume levers (systematic capacity addition), (2) cost
leadership, (3) healthy balance sheet with INR13b of net cash and (4) critical
mass for consistent superior growth from internal accruals.
Entry in new market (East) with 2.5mt of Greenfield plant in Chhattisgarh may
lead to interim rise cost structure, but it would improve company’s market mix
with further diversification.
We expect SRCM to generate operating cash flow of ~INR70b over FY15-17 v/s
announced capex need of INR30-35b. Hence, it would be able to drive growth
without impacting its balance sheet.
The stock trades at 15.1x/10x EV/EBITDA on FY16/17E and EV of US$230/ton
FY17E (adjusting for Merchant Power assets of ~400MW). Maintain Buy with
SOTP based target price of INR12,272 (EV at USD260/ton and implied 11.3x
FY17E EV/EBITDA). Buy
Exhibit 8: Shree Cement - Sum of the parts valuations
INR M
Cement business
Merchant Power
Total EV
Less: Net Debt
Equity Value
Fair Value (INR/share)
EV/Ton at TP (USD)
Parameter
EV/EBITDA
DCF
Factor
11
@ 12% WACC
FY17
370,347
12,808
383,155
-44,356
427,511
12,272
260
Source: Company, MOSL
3 February 2015
4

Shree Cement
Exhibit 9: Steady growth in capacity aids volume levers
Exhibit 10: Operating profitability superior to industry (INR)
Source: Company, MOSL
Exhibit 11: B/S strong to drive consistent growth from
internal accruals
Exhibit 12: Return ratio set to improve gradually with
volume recovery
Source: Company, MOSL
3 February 2015
5

Shree Cement
Corporate profile: Shree Cement
Company description
Shree Cement is the largest single-location
integrated cement plant in North India, with an
installed capacity of 13m ton. It is strategically
located in central Rajasthan from where it can
cater to the entire Rajasthan market as well as
Delhi and Haryana, with economic logistics cost. It
is a significant player in North India. Over the years,
it has established a reputation as one of the
world’s most efficient cement manufacturers.
Exhibit 8: Sensex rebased
11,500
10,000
8,500
7,000
5,500
4,000
Feb-14
May-14
Aug-14
Nov-14
Feb-15
Shree Cement
Sensex - Rebased
Shareholding pattern (%)
Dec-14
Promoter
DII
FII
Others
64.8
5.6
11.3
18.3
Sep-14
64.8
5.7
11.0
18.5
Dec-13
64.8
5.9
8.2
21.2
Top holders
Holder Name
FLT Ltd
UTI Opportunities Fund UTI Infrastructure Fund UTI
HDFC Standard Life Insurance Company Ltd
% Holding
10.3
1.9
1.5
Note: FII Includes depository receipts
Top management
Name
B G Bangur
H M Bangur
Designation
Chairman
Managing Director
Directors
Name
B G Bangur
H M Bangur
Y K Alagh*
O P Setia*
R L Gaggar*
Name
Nitin Desai*
Shreekant Somany*
Leena Srivastava*
Ramakant Sharma
Prashant Bangur
*Independent
Auditors
Name
B R Maheshwari & Co
P K Ajmera & Co
K G Goyal & Associates
Type
Statutory
Internal
Cost Auditor
MOSL forecast v/s consensus
EPS
(INR)
FY15
FY16
FY17
MOSL
forecast
199.0
321.0
555.8
Consensus
forecast
260.2
393.6
541.4
Variation
(%)
-23.5
-18.5
2.7
3 February 2015
6

Shree Cement
Financials and valuations
Income Statement
Y/E June
Net Sales
Change (%)
Total Expenditure
% of Sales
EBITDA
Margin (%)
Depriciation
EBIT
Int. and Finance Charges
Other Income - Rec.
PBT before EO Expense
EO Expense/(Income)
PBT after EO Expense
Tax
Tax Rate (%)
Reported PAT
Adj PAT for EO items
Change (%)
Margin (%)
2010 ^
36,321
34.0
21,296
58.6
15,025
41.4
5,704
9,321
1,291
1,284
9,313
634
8,679
1,918
22.1
6,761
7,097
18.6
19.5
2011 ^
34,535
-4.9
25,687
74.4
8,848
25.6
6,758
2,091
1,753
1,251
1,588
485
1,103
-994
-90.0
2,097
2,582
-63.6
7.5
2012
47,806
38.4
33,941
71.0
13,865
29.0
7,133
6,732
1,878
1,471
6,325
41
6,284
649
10.3
5,635
5,671
119.7
11.9
2013
55,671
16.5
40,293
72.4
15,378
27.6
4,356
11,022
1,931
2,114
11,205
11
11,194
1,155
10.3
10,040
10,049
77.2
18.1
2014
58,759
5.5
44,975
76.5
13,784
23.5
5,499
8,285
1,292
1,964
8,957
-154
9,111
1,238
13.6
7,872
7,739
-23.0
13.2
2015E
68,432
16.5
52,232
76.3
16,199
23.7
8,949
7,251
1,402
1,450
7,299
0
7,299
365
5.0
6,934
6,934
-10.4
10.1
(INR Million)
2016E
85,737
25.3
61,934
72.2
23,803
27.8
11,144
12,659
1,304
1,800
13,155
0
13,155
1,973
15.0
11,182
11,182
61.3
13.0
2017E
106,240
23.9
72,487
68.2
33,754
31.8
11,178
22,576
1,067
3,000
24,510
0
24,510
5,147
21.0
19,363
19,363
73.2
18.2
Balance Sheet
Y/E June
Equity Share Capital
Other Reserves
Total Reserves
Net Worth
Deferred Liabilities
Secured Loan
Unsecured Laon
Total Loans
Capital Employed
Gross Block
Less: Accum. Deprn.
Net Fixed Assets
Capital WIP
Investments
Curr. Assets
Inventory
Account Receivables
Cash and Bank Balance
Others
Curr. Liability & Prov.
Account Payables
Provisions
Net Current Assets
Appl. of Funds
E: MOSL Estimates; ^ Y/E March
2010 ^
348
17,984
17,984
18,332
-124
18,306
2,756
21,062
39,271
36,189
21,995
14,194
3,000
15,922
15,822
3,581
824
4,164
7,252
9,667
4,668
4,999
6,155
39,271
2011 ^
348
19,513
19,513
19,862
-723
19,079
1,000
20,079
39,218
42,713
28,752
13,961
5,000
11,965
17,756
4,042
1,082
4,987
7,644
9,463
6,635
2,828
8,293
39,218
2012
348
26,991
26,991
27,339
-697
16,079
532
16,611
43,253
50,564
35,886
14,678
1,500
25,352
17,499
5,033
1,811
4,590
6,065
15,776
13,822
1,954
1,723
43,253
2013
348
38,088
38,088
38,436
-938
11,274
0
11,274
48,773
56,895
40,242
16,653
2,500
22,033
19,478
5,305
3,147
3,694
7,333
11,891
10,841
1,050
7,587
48,773
2014
348
46,760
46,760
47,109
-1429
10,783
0
10,783
56,463
66,764
45,741
21,023
8,500
22,444
19,892
8,098
2,966
1,593
7,236
15,396
14,209
1,186
4,496
56,463
2015E
348
52,682
52,682
53,031
-2596
10,783
0
10,783
61,217
88,864
54,690
34,174
5,000
22,444
13,995
6,937
3,281
-5,034
8,812
14,396
13,124
1,272
-401
61,217
2016E
348
62,649
62,649
62,998
-3386
9,283
0
9,283
68,895
96,864
65,833
31,030
4,500
22,444
29,352
8,691
4,111
7,154
9,396
18,431
16,443
1,988
10,920
68,895
2017E
348
80,595
80,595
80,944
-3386
7,783
0
7,783
85,341
106,364
77,011
29,353
2,500
22,444
54,701
10,770
5,094
27,195
11,643
23,657
20,375
3,282
31,044
85,341
3 February 2015
7

Shree Cement
Financials and valuations
Ratios
Y/E June
Basic (INR)
EPS
Cash EPS
BV/Share
DPS
Payout (%)
Valuation (x)
P/E
Cash P/E
P/BV
EV/Sales
EV/EBITDA
EV (US$)
EV/ton (USD-Cap)
Dividend Yield (%)
Return Ratios (%)
RoE
RoCE
Working Capital Ratios
Inventory (Days)
Debtor (Days)
Creditor (Days)
Working Capital Turnover (Days)
Leverage Ratio (x)
Current Ratio
Debt/Equity
2010 ^
203.7
455.6
526.2
13.0
7.8
2011 ^
74.1
394.1
570.1
14.0
27.2
2012
162.8
479.1
784.8
20.0
14.5
2013
288.5
441.3
1,103.3
20.0
8.1
2014
222.2
427.5
1,352.3
22.0
11.4
2015E
199.0
572.6
1,522.2
25.0
14.6
2016E
321.0
776.8
1,808.4
30.0
10.9
2017E
555.8
991.9
2,323.5
35.0
7.3
53.5
23.9
20.7
10.9
25.3
5,927
494
0.1
5,962
452
66.9
22.7
13.9
8.2
26.4
5,669
420
0.2
37.8
24.7
9.9
7.0
23.7
5,635
417
0.2
49.1
25.5
8.1
6.6
26.6
5,597
320
0.2
54.7
19.0
7.2
5.8
23.0
5,773
275
0.2
34.0
14.0
6.0
4.5
15.1
5,576
242
0.3
19.6
11.0
4.7
3.4
10.0
5,282
230
0.3
46.6
31.9
13.5
8.4
24.0
19.6
30.6
28.1
18.1
19.0
13.8
14.3
19.3
21.2
26.9
31.8
36
8
47
62
43
11
70
88
38
14
106
13
35
21
71
50
50
18
88
28
37
18
70
-2
37
18
70
46
37
18
70
107
1.6
1.1
1.9
1.0
1.1
0.6
1.6
0.3
1.3
0.2
1.0
0.2
1.6
0.1
2.3
0.1
Cash Flow Statement
Oper. Profit/(Loss) before Tax
Interest/Dividends Recd.
Direct Taxes Paid
(Inc)/Dec in WC
CF from Operations
2010 ^
14,498
1,131
-1,897
-61
13,671
2011 ^
8,848
1,251
395
-1,315
9,180
2012
13,865
1,471
-564
6,173
20,945
2013
15,368
2,114
-2,198
-5,957
9,326
2014
13,630
1,964
-1,729
990
14,854
2015E
16,199
1,450
-1,533
-1,730
14,387
(INR Million)
2016E
23,803
1,800
-2,763
867
23,707
2017E
33,754
3,000
-5,147
-83
31,524
(inc)/dec in FA
(Pur)/Sale of Investments
CF from investments
Issue of Shares
(Inc)/Dec in Debt
Interest Paid
Dividend Paid
CF from Fin. Activity
Inc/Dec of Cash
Add: Beginning Balance
Closing Balance
3 February 2015
-11,710
-6,306
-18,016
0
5,729
-1,332
-611
3,786
-559
4,723
4,164
-8,525
3,958
-4,567
-482
-983
-1,753
-571
-3,789
823
4,164
4,987
-4,350
-13,387
-17,738
2,617
-3,468
-1,878
-815
-3,544
-337
4,987
4,590
-7,331
3,319
-4,012
1,867
-5,337
-1,931
-810
-6,211
-896
4,590
3,693
-15,869
-411
-16,280
1,697
-491
-1,292
-897
-983
-2,409
3,694
1,284
-18,600
0
-18,600
0
0
-1,402
-1,012
-2,414
-6,627
1,593
-5,034
-7,500
0
-7,500
0
-1,500
-1,304
-1,214
-4,019
12,188
-5,034
7,154
-7,500
0
-7,500
0
-1,500
-1,067
-1,417
-3,983
20,041
7,154
27,195
8

Shree Cement
NOTES
3 February 2015
9

Shree Cement
This document has been prepared by Motilal Oswal Securities Limited (hereinafter referred to as Most) to provide information about the company(ies) and/sector(s), if any, covered in the report and may be
distributed by it and/or its affiliated company(ies). This report is for personal information of the selected recipient/s and does not construe to be any investment, legal or taxation advice to you. This research report does
not constitute an offer, invitation or inducement to invest in securities or other investments and Motilal Oswal Securities Limited (hereinafter referred as MOSt) is not soliciting any action based upon it. This report is not
for public distribution and has been furnished to you solely for your general information and should not be reproduced or redistributed to any other person in any form. This report does not constitute a personal
recommendation or take into account the particular investment objectives, financial situations, or needs of individual clients. Before acting on any advice or recommendation in this material, investors should consider
whether it is suitable for their particular circumstances and, if necessary, seek professional advice. The price and value of the investments referred to in this material and the income from them may go down as well as
up, and investors may realize losses on any investments. Past performance is not a guide for future performance, future returns are not guaranteed and a loss of original capital may occur.
MOSt and its affiliates are a full-service, integrated investment banking, investment management, brokerage and financing group. We and our affiliates have investment banking and other business relationships with a
some companies covered by our Research Department. Our research professionals may provide input into our investment banking and other business selection processes. Investors should assume that MOSt and/or
its affiliates are seeking or will seek investment banking or other business from the company or companies that are the subject of this material and that the research professionals who were involved in preparing this
material may educate investors on investments in such business. The research professionals responsible for the preparation of this document may interact with trading desk personnel, sales personnel and other
parties for the purpose of gathering, applying and interpreting information. Our research professionals are paid on the profitability of MOSt which may include earnings from investment banking and other business.
MOSt generally prohibits its analysts, persons reporting to analysts, and members of their households from maintaining a financial interest in the securities or derivatives of any companies that the analysts cover.
Additionally, MOSt generally prohibits its analysts and persons reporting to analysts from serving as an officer, director, or advisory board member of any companies that the analysts cover. Our salespeople, traders,
and other professionals or affiliates may provide oral or written market commentary or trading strategies to our clients that reflect opinions that are contrary to the opinions expressed herein, and our proprietary
trading and investing businesses may make investment decisions that are inconsistent with the recommendations expressed herein. In reviewing these materials, you should be aware that any or all of the foregoing
among other things, may give rise to real or potential conflicts of interest. MOSt and its affiliated company(ies), their directors and employees and their relatives may; (a) from time to time, have a long or short position
in, act as principal in, and buy or sell the securities or derivatives thereof of companies mentioned herein. (b) be engaged in any other transaction involving such securities and earn brokerage or other compensation
or act as a market maker in the financial instruments of the company(ies) discussed herein or act as an advisor or lender/borrower to such company(ies) or may have any other potential conflict of interests with
respect to any recommendation and other related information and opinions.; however the same shall have no bearing whatsoever on the specific recommendations made by the analyst(s), as the recommendations
made by the analyst(s) are completely independent of the views of the affiliates of MOSt even though there might exist an inherent conflict of interest in some of the stocks mentioned in the research report
Reports based on technical and derivative analysis center on studying charts company's price movement, outstanding positions and trading volume, as opposed to focusing on a company's fundamentals and, as
such, may not match with a report on a company's fundamental analysis. In addition MOST has different business segments / Divisions with independent research separated by Chinese walls catering to different set
of customers having various objectives, risk profiles, investment horizon, etc, and therefore may at times have different contrary views on stocks sectors and markets.
Unauthorized disclosure, use, dissemination or copying (either whole or partial) of this information, is prohibited. The person accessing this information specifically agrees to exempt MOSt or any of its affiliates or
employees from, any and all responsibility/liability arising from such misuse and agrees not to hold MOSt or any of its affiliates or employees responsible for any such misuse and further agrees to hold MOSt or any of
its affiliates or employees free and harmless from all losses, costs, damages, expenses that may be suffered by the person accessing this information due to any errors and delays. The information contained herein is
based on publicly available data or other sources believed to be reliable. Any statements contained in this report attributed to a third party represent MOSt’s interpretation of the data, information and/or opinions
provided by that third party either publicly or through a subscription service, and such use and interpretation have not been reviewed by the third party. This Report is not intended to be a complete statement or
summary of the securities, markets or developments referred to in the document. While we would endeavor to update the information herein on reasonable basis, MOSt and/or its affiliates are under no obligation to
update the information. Also there may be regulatory, compliance, or other reasons that may prevent MOSt and/or its affiliates from doing so. MOSt or any of its affiliates or employees shall not be in any way
responsible and liable for any loss or damage that may arise to any person from any inadvertent error in the information contained in this report. MOSt or any of its affiliates or employees do not provide, at any time,
any express or implied warranty of any kind, regarding any matter pertaining to this report, including without limitation the implied warranties of merchantability, fitness for a particular purpose, and non-infringement.
The recipients of this report should rely on their own investigations.
This report is intended for distribution to institutional investors. Recipients who are not institutional investors should seek advice of their independent financial advisor prior to taking any investment decision based on
this report or for any necessary explanation of its contents.
Most and it’s associates may have managed or co-managed public offering of securities, may have received compensation for investment banking or merchant banking or brokerage services, may have received any
compensation for products or services other than investment banking or merchant banking or brokerage services from the subject company in the past 12 months.
Most and it’s associates have not received any compensation or other benefits from the subject company or third party in connection with the research report.
Subject Company may have been a client of Most or its associates during twelve months preceding the date of distribution of the research report
MOSt and/or its affiliates and/or employees may have interests/positions, financial or otherwise of over 1 % at the end of the month immediately preceding the date of publication of the research in the securities
mentioned in this report. To enhance transparency, MOSt has incorporated a Disclosure of Interest Statement in this document. This should, however, not be treated as endorsement of the views expressed in the
report.
Motilal Oswal Securities Limited is under the process of seeking registration under SEBI (Research Analyst) Regulations, 2014.
There are no material disciplinary action that been taken by any regulatory authority impacting equity research analysis activities
Analyst Certification
The views expressed in this research report accurately reflect the personal views of the analyst(s) about the subject securities or issues, and no part of the compensation of the research analyst(s) was, is, or will be
directly or indirectly related to the specific recommendations and views expressed by research analyst(s) in this report. The research analysts, strategists, or research associates principally responsible for preparation
of MOSt research receive compensation based upon various factors, including quality of research, investor client feedback, stock picking, competitive factors and firm revenues
Disclosure of Interest Statement
Analyst ownership of the stock
Served as an officer, director or employee
SHREE CEMENT
No
No
Disclosures
Regional Disclosures (outside India)
For U.S.
This report is not directed or intended for distribution to or use by any person or entity resident in a state, country or any jurisdiction, where such distribution, publication, availability or use would be contrary to law,
regulation or which would subject MOSt & its group companies to registration or licensing requirements within such jurisdictions.
Motilal Oswal Securities Limited (MOSL) is not a registered broker - dealer under the U.S. Securities Exchange Act of 1934, as amended (the"1934 act") and under applicable state laws in the United States. In
addition MOSL is not a registered investment adviser under the U.S. Investment Advisers Act of 1940, as amended (the "Advisers Act" and together with the 1934 Act, the "Acts), and under applicable state laws in the
United States. Accordingly, in the absence of specific exemption under the Acts, any brokerage and investment services provided by MOSL, including the products and services described herein are not available to or
intended for U.S. persons.
This report is intended for distribution only to "Major Institutional Investors" as defined by Rule 15a-6(b)(4) of the Exchange Act and interpretations thereof by SEC (henceforth referred to as "major institutional
investors"). This document must not be acted on or relied on by persons who are not major institutional investors. Any investment or investment activity to which this document relates is only available to major
institutional investors and will be engaged in only with major institutional investors. In reliance on the exemption from registration provided by Rule 15a-6 of the U.S. Securities Exchange Act of 1934, as amended (the
"Exchange Act") and interpretations thereof by the U.S. Securities and Exchange Commission ("SEC") in order to conduct business with Institutional Investors based in the U.S., MOSL has entered into a chaperoning
agreement with a U.S. registered broker-dealer, Motilal Oswal Securities International Private Limited. ("MOSIPL"). Any business interaction pursuant to this report will have to be executed within the provisions of this
chaperoning agreement.
The Research Analysts contributing to the report may not be registered /qualified as research analyst with FINRA. Such research analyst may not be associated persons of the U.S. registered broker-dealer, MOSIPL,
and therefore, may not be subject to NASD rule 2711 and NYSE Rule 472 restrictions on communication with a subject company, public appearances and trading securities held by a research analyst account.
Motilal Oswal Capital Markets Singapore Pte Limited is acting as an exempt financial advisor under section 23(1)(f) of the Financial Advisers Act(FAA) read with regulation 17(1)(d) of the Financial Advisors
Regulations and is a subsidiary of Motilal Oswal Securities Limited in India. This research is distributed in Singapore by Motilal Oswal Capital Markets Singapore Pte Limited and it is only directed in Singapore to
accredited investors, as defined in the Financial Advisers Regulations and the Securities and Futures Act (Chapter 289), as amended from time to time.
In respect of any matter arising from or in connection with the research you could contact the following representatives of Motilal Oswal Capital Markets Singapore Pte Limited:
Anosh Koppikar
Kadambari Balachandran
Email : anosh.Koppikar@motilaloswal.com
Email : kadambari.balachandran@motilaloswal.com
Contact : (+65)68189232
Contact : (+65) 68189233 / 65249115
Office Address : 21 (Suite 31),16 Collyer Quay,Singapore 04931
For Singapore
Motilal Oswal Securities Ltd
3 February 2015
Motilal Oswal Tower, Level 9, Sayani Road, Prabhadevi, Mumbai 400 025
Phone: +91 22 3982 5500 E-mail: reports@motilaloswal.com
10