3 February 2015
3QFY15 Results Update | Sector:
Automobiles
Hero MotoCorp
BSE SENSEX
29,000
Bloomberg
Equity Shares (m)
M.Cap. (INR b) / (USD b)
52-Week Range (INR)
1, 6, 12 Rel. Per (%)
Avg Val (INRm)/Vol ‘000
Free float (%)
Financials & Valuation (INR b)
Y/E MAR
Net Sales
EBITDA
Adj PAT
EPS (INR)
Gr. (%)
BV/Sh.(INR)
RoE (%)
RoCE (%)
P/E (x)
P/BV (x)
2015E
277.0
34.8
25.9
129.8
38.6
327.2
427.
60.5
21.7
8.6
2016E
318.5
44.2
34.2
171.2
31.9
402.0
47
67.5
16.4
7.0
2017E
368.2
51.7
40.2
201.4
17.6
494.9
44.9
64.6
14.0
5.7
S&P CNX
8,757
HMCL IN
199.7
561.6/9.1
3,272/1,907
-13/-6/0
1,342/500
60.1
CMP: INR2,812
TP: INR3,222 (+15%)
Buy
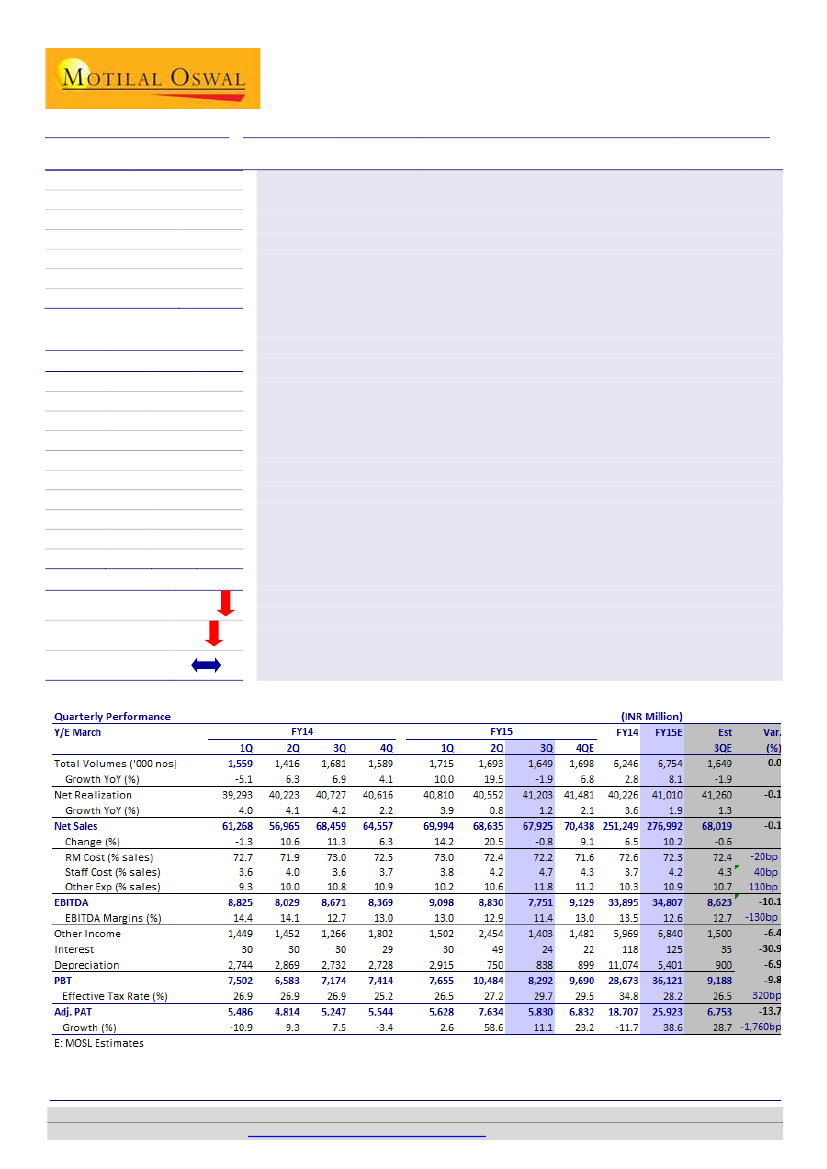
EBITDA margin of 11.4% impacted by higher publicity cost
HMCL’s 3QFY15 operating performance was disappointing, impacted by higher
publicity expenses. Impending demand recovery coincides with several new
product launches (two scooter launches in FY16) and new capacities (~2.1m by
1QFY17). Export focus would necessitate higher marketing investment in these
markets, thus impacting margins in the medium term. Cost cutting initiatives
provide option value as its efforts so far are more than negated by cost push.
Deliverance on successful new products and margins would be a key catalyst for
stock’s performance.
n
Net sales de-grew 0.8% YoY to INR67.9b (est. INR68b) on a volume growth of
-1.9% YoY (-2.6% QoQ), while realizations grew 1.2% YoY (1.6% QoQ).
n
Adj. EBITDA margin at 11.4% (v/s est. 12.7%) declined 130bp YoY (down 150bp
QoQ), impacted by one-time publicity expense of ~INR600m (~90bp) due to
bunching up of sponsorships of several events (PGA event in Orlando, Indian
Football League, World Cup Hockey etc). Staff cost was higher at ~30% YoY
(11% QoQ) to ~INR3.2b (v/s est. ~INR2.9b) due to commissioning of Neemrana
plant and Global Parts Centre.
n
Tax rate at ~29.7% (v/s est. 26.5%) was high due to higher tax on debt
investments. PAT grew by 11.1% YoY to INR5.8b (est. INR6.7b).
n
Valuation and view:
We cut the EPS estimates by 6.6%/3.1%/4.5% for
FY15E/16E/17E to INR129.8/171.2/201.4 respectively to factor in for a) higher
marketing spend especially for exports business and b) higher tax rates.. The
stock trades at 16.4x/14x FY16E/17E EPS. Maintain
Buy
with a target price of
INR3,222 (16x FY17E, in-line with LPA).
Estimate change
TP change
Rating change
7/3/5%
5%
Jinesh Gandhi
(Jinesh@MotilalOswal.com); +91 22 3982 5416
Investors are advised to refer through disclosures made at the end of the Research Report.
Motilal Oswal research is available on
www.motilaloswal.com/Institutional-Equities,
Bloomberg, Thomson Reuters, Factset and S&P Capital.

Hero MotoCorp
Volume de-growth of 2% as Motorcycle de-grew by 6%
n
n
n
n
Volumes de-grew by ~2% YoY on account of 6% de-growth in motorcycle.
Scooter sales were robust with 31% growth, while motorcycle de-grew 6%.
Sequentially, HMCL gained market share by 120bp to 40.7% in 3QFY15 in the
domestic 2W segment, due to gain of 380bp market share in Scooters to 19.5%.
Realizations grew 1.2% YoY (1.6% QoQ), partly benefitting from ~0.4% blended
price increase in Oct-14.
As a result, net sales de-grew 0.8% YoY to INR67.93b (est INR68.0b).
Exhibit 2: Realizations improve further to INR41.2k per unit
Exhibit 1: Volume de-growth of ~2% after 4 Quarters
Volumes ('000 units)
23.9
20.1
11.3 8.1
7.4
-1.0 -2.8
17.0
10.1
-10.0
1.9
Growth (%)
19.5
10.0
-1.9
-13.7
1Q 2Q 3Q 4Q 1Q 2Q 3Q 4Q 1Q 2Q 3Q 4Q 1Q 2Q 3Q
FY12
FY13
FY14
FY15
Source: Company, MOSL
Exhibit 3: Trend in Segment Mix ('000 units)
< 125cc
% of total
> 125cc
% of total
Total Motorcycles
% of total
Scooters
% of total
Total 2Ws
Of which exports
% of total
3QFY15 3QFY14
1,389
1,451
84.3
86.3
21
48
1.3
2.9
1,410
1,500
85.6
89.2
238
181
14.4
10.8
1,649
1,681
29
43
1.7
2.6
YoY % 2QFY15
-4.3
1,453
85.9
-56.6
44
2.6
-6.0
1,498
88.5
31.4
195
11.5
-1.9
1,693
(33)
31
1.8
QoQ %
-4.4
-52.7
-5.8
22.2
-2.6
-8.2
FY14
FY13
YoY %
5,378
5,287
1.7
86.1
87.1
160
212
-24.6
2.6
3.5
5,538
5,499
0.7
88.7
90.5
708
574
23.2
11.3
9.5
6,246
6,074
2.8
148
161
(8)
2.4
2.7
Source: Company, MOSL
Exhibit 4: Trend in Market Share
3QFY15
Total Motorcycles
Scooters
Total 2W
Total 2W (Domestic)
43.7
19.5
35.5
40.7
3QFY14
45.3
18.8
37.7
42.0
Chg YoY
(BP)
-160
80
-220
-120
Chg QoQ
(BP)
43.4
20
15.7
380
34.6
90
39.6
120
Source: Company, MOSL
2QFY15
3 February 2015
2

Hero MotoCorp
EBITDA margins post decline of 150bp sequentially
n
n
n
n
Adj. EBITDA margins at 11.4% (v/s est 12.7%) declined 130bp YoY (down 150bp
QoQ) impacted by one time publicity expense.
One time publicity expense (for the qtr) of ~INR600m (~90bp) was due to
bunching up of for sponsorship of several events (PGA event in Orlando, Indian
Football League, World Cup Hockey etc).
Staff cost was higher at ~30% YoY (11% QoQ) to ~INR3.2b (v/s est ~INR2.9b)
due to commissioning of Neemrana plant and Global Parts Centre.
Tax rate at ~29.7% (v/s est 26.5%) was high due to change in tax implications
on debt investments. PAT grew by 11.1% YoY to INR5.8b (est INR6.7b).
Exhibit 5: Margin decline QoQ on higher other expense and
staff cost
Exhibit 6: EBITDA/unit declines QoQ on lower margins
EBITDA (INR m)
10.7
11.511.110.810.7
9.0 8.7 9.6
EBITDA Margins (%)
11.110.0
9.6 9.7 10.1
12.9
11.4
EBITDA (INR/unit)
1Q 2Q 3Q 4Q 1Q 2Q 3Q 4Q 1Q 2Q 3Q 4Q 1Q 2Q 3Q
FY12
FY13
FY14
FY15
1Q 2Q 3Q 4Q 1Q 2Q 3Q 4Q 1Q 2Q 3Q 4Q 1Q 2Q 3Q
FY12
FY13
FY14
FY15
Source: Company, MOSL
Key takeaways from management interaction
n
n
n
n
n
n
Blended price increase of ~INR150/unit taken in Oct-14
Entered into Colombia market with six of its best selling bikes with 120 outlets
Cost saving initiatives continues to deliver, with ~INR600m savings, which were
off-set by cost push on Aluminum. 9MFY15 savings on account of ‘Leap’
program is ~INR2.4b, which were more than off-set by cost pressures.
Excise duty increase to add ~1% from 4QFY15 onwards.
1 New scooter (Dash, 110cc) to be launched in Jun-Jul'15, with another scooter
(Dare, 125cc) to be launched later.
Gujarat plant to be operational by Apr-16.
Valuation and view
n
n
Industry growth to gain pace, competitive pressure to reduce:
HMSI has guided
for 21% growth for FY15 (v/s industry growth expectation of 13%), a sharp
moderation v/s 37% growth in FY14 (industry growth of 7%). The share of
incremental industry volumes is expected to reduce significantly from 97% in
FY14 to ~39% in FY15, thereby implying reduced competitive intensity on an
incremental basis.
Product lifecycle turning positive; plans 2 launches in FY16:
HMCL has
undertaken virtually nil new product launches over the last 18 months. HMSI,
over the same period, launched around six new products. HMCL is embarking on
a favorable product lifecycle, with two promising new launches lined up in
1Q/2QFY16, together with major refreshes to existing products such as recently-
3
3 February 2015

Hero MotoCorp
n
n
launched Splendor iSmart (with start-stop technology). It is targeting ~35
launches over next 3 years, including 110cc scooter & 250cc motorcycle.
Export market to offer huge headroom for growth:
Over FY14-16E, entry into
multiple new export markets can improve overall growth by ~1% (growth can
accelerate significantly post the initial learning curve). It plans to double its
target export markets from currently 20 to 40 countries over next few years. We
are estimating export volumes of ~0.23m/0.34m/0.51m units in Y15/FY16/FY17.
Valuation & View:
Impending demand recovery coincides with several new
product launches (2 scooter launches in FY16) and new capacities (~2.1m by
1QFY17). Export focus would necessitate higher marketing investment in these
markets, impacting margins in medium term. Cost cutting initiatives provide
option value, as its efforts so far are more than negated by cost push.
Deliverance on successful new products and on margins would be key catalyst to
the stock performance. We cut our EPS estimates by 6.6%/3.1%/4.5% for
FY15E/16E/17E to INR129.8/171.2/201.4 respectively. The stock currently trades
at 16.4x/14.0x FY16E/17E EPS. Maintain Buy with a TP of INR3,222 (16x FY17E).
Exhibit 7: Revised Forecast
(INR B)
Volumes ('000 units)
Net Sales
EBITDA
EBITDA Margins (%)
Net Profit
EPS (Rs)
Rev
6,754
277.0
34.8
11.8
25.9
129.8
FY15E
Old Chg (%)
6,781
-0.4
278
-0.5
36
-3.9
12.3
-50
28
-6.6
139.0
-6.6
Rev
7,595
318.5
44.2
13.9
34.2
171.2
FY16E
Old Chg (%)
7,588
0.1
318
0.3
45
-1.0
14.1
-20
35
-3.1
176.7
-3.1
FY17E
Rev
Old Chg (%)
8,663 8,653
0.1
368.2
367
0.3
51.7
53
-2.1
14.0 14.4
-30
40.2
42
-4.5
201.4 210.9
-4.5
Source: Company, MOSL
Exhibit 8: Valuations trading at historical average, reflecting improving fundamentals
30
P/E (x)
5 Yrs Avg(x)
15 Yrs Avg(x)
10 Yrs Avg(x)
16.0
12.0
P/B (x)
5 Yrs Avg(x)
15 Yrs Avg(x)
10 Yrs Avg(x)
20
17.3
15.4
16.8
8.0
8.0
4.0
6.4
13.5
6.9
7.1
10
0
0.0
Source: MOSL
Source: MOSL
3 February 2015
4

Hero MotoCorp
Exhibit 9: Comparative Valuation
Auto OEM's
Bajaj Auto
Hero MotoCorp
TVS Motor
M&M
Maruti Suzuki
Tata Motors
Ashok Leyland
Eicher Motors#
Auto Ancillaries
Bharat Forge
Exide Industries
Amara Raja Batteries
# Nos. are on CY basis
CMP * Rating
(INR)
2,260 Buy
2,812 Buy
286 Buy
1,200 Neutral
3,608 Buy
602 Buy
65 Buy
16,320 Buy
1,089
198
910
Buy
Buy
Buy
TP
P/E (x)
(INR) FY16E
FY17E
2,832
14.9
12.8
3,222
16.4
14.0
326
21.5
15.3
1,319
15.3
12.2
4,616
20.9
15.7
744
8.0
6.8
87
18.3
10.9
16,473
41.8
26.1
1,233
241
1,093
25.8
21.3
28.4
19.9
17.8
20.8
EV/EBITDA (x)
FY16E
FY17E
9.4
7.6
11.3
9.3
13.4
9.5
13.1
10.7
11.1
8.7
3.4
2.7
9.1
5.8
25.1
16.4
13.6
13.2
16.1
10.5
10.8
12.0
RoE (%)
FY16E
FY17E
36.4
35.4
47.0
44.9
33.0
34.9
16.5
16.9
18.5
20.6
25.2
23.3
18.0
26.0
36.8
41.4
26.9
16.8
28.8
27.7
17.5
31.0
RoCE (%)
FY16E
FY17E
50.4
48.8
67.5
64.6
39.2
43.5
17.9
18.8
23.2
26.1
27.3
26.9
17.9
26.9
39.8
48.3
27.7
31.1
23.6
24.5
40.7
44.1
Source: Company, MOSL
3 February 2015
5

Hero MotoCorp
Story in charts: Robust 25% EPS CAGR over FY15-17E
Exhibit 10: Volumes to register a CAGR of 13.3% over FY15-
17E
Volumes ('000 units)
15.4
12.5
8.1
11.0
9.5
10.1
Volume growth (%)
14.1
Exhibit 11: EBITDA margin to expand on royalty expiry, cost
reduction
Adj. EBITDA Margin (%)
13.9
11.8
14.0
2.8
-2.6
FY12
FY13
FY14
FY15E
FY16E
FY17E
FY12
FY13
FY14
FY15E
FY16E
FY17E
Source: Company, MOSL
Exhibit 12: Strong earnings growth of 25% over FY15-17E
PAT (INR m)
38.6
18.4
Growth (%)
31.9
17.6
Exhibit 13: Robust dividend payout
Dividend payout (%)
70
DPS (INR)
80
90
60
45
65
-10.9
FY12
FY13
-11.7
FY14
FY15E
FY16E
FY17E
43
FY12
65
FY13
80
FY14
62
FY15E
54
FY16E
51
FY17E
Source: Company, MOSL
Exhibit 14: Return ratios to improve on better profitability
RoCE (%)
RoE (%)
Exhibit 15: Net cash surplus to rise further
Net Debt (INR mn)
(23,268)
43.6
65.6
49.9
45.6
52.0
35.3
60.5
42.7
67.5
47.0
64.6
44.9
(35,027)
(41,818)
(49,233)
(61,759)
(83,242)
FY12
FY13
FY14
FY15E
FY16E
FY17E
FY12
FY13
FY14
FY15E
FY16E
FY17E
Source: Company, MOSL
3 February 2015
6

Hero MotoCorp
Key operating metrics
Exhibit 16: Snapshot of Revenue Model
000 units
Total M/Cycles
Growth (%)
% of total volumes
Total Scooters
Growth (%)
% of total volumes
Total volumes
Growth (%)
- of which Exports
% of total volumes
Avg. Net Realn (INR/unit)
Growth (%)
Net Revenues (INR b)
Growth (%)
FY10
4,386
23.0
95.3
214
37.2
4.7
4,600
23.6
0
0.0
34,256
3.5
158
27.9
FY11
5,041
14.9
93.3
361
68.7
6.7
5,402
17.4
0
0.0
35,624
4.0
192
22.1
FY12
5,780
14.7
92.7
456
26.0
7.3
6,235
15.4
0
0.0
37,478
5.2
234
21.4
FY13
5,501
-4.8
90.5
574
26.1
9.5
6,076
-2.6
0
0.0
38,816
3.6
236
0.9
FY14
5,538
0.7
88.7
708
23.2
11.3
6,246
2.8
113
2.0
40,226
3.6
251
6.5
FY15E
6,004
8.4
88.9
750
6.0
11.1
6,754
8.1
226
3.7
41,010
1.9
277
10.2
FY16E
6,695
11.5
88.1
900
20.0
11.9
7,595
12.5
340
4.9
41,937
2.3
319
15.0
FY17E
7,628
13.9
88.1
1,035
15.0
11.9
8,663
14.1
510
6.5
42,507
1.4
368
15.6
Source: Company, MOSL
3 February 2015
7

Hero MotoCorp
Corporate profile: Hero MotoCorp
Company description
Hero MotoCorp (HMCL), erstwhile JV between
Honda Corporation Japan and the Munjal family, is
the leader in domestic motorcycle market with
~44% share, benefiting from a strong dealership
network and high penetration in the rural areas
(~45% of sales) as well. Post split from Honda, Hero
MotoCorp is free to tap global opportunity in 2W.
Exhibit 17: Sensex rebased
3,400
3,000
2,600
2,200
1,800
Feb-14
May-14
Aug-14
Nov-14
Feb-15
Hero Motocorp
Sensex - Rebased
Exhibit 18: Shareholding pattern (%)
Dec-14
Promoter
DII
FII
Others
39.9
7.4
39.3
13.3
Sep-14
39.9
8.4
34.3
17.3
Dec-13
39.9
8.5
30.6
21.0
Exhibit 19: Top holders
Holder Name
Lathe Investment Pte Ltd
Europacific Growth Fund
Aberdeen Global Indian Equity Fund (Mauritius) Ltd
Life Insurance corporation of India
BC India Pvt Investor II
% Holding
2.8
2.3
2.3
2.1
1.5
Note: FII Includes depository receipts
Exhibit 20: Top management
Name
Brijmohan Lall Munjal
Pawan Munjal
Sunil Kant Munjal
Ravi Sud
A Srinivasu
Designation
Chairman
Vice Chairman & MD & CEO
Joint Managing Director
Sr. Vice President and CFO
Head – National Sales
Exhibit 21: Directors
Name
Brijmohan Lall Munjal
Pawan Munjal
Sunil Kant Munjal
V P Malik*
Ravi Nath*
Pritam Singh*
*Independent
Name
Anand C Burman*
Pradeep Dinodia*
Meleveetil Damodaran*
Paul Edgerley
Suman Kant Munjal
Exhibit 22: Auditors
Name
Deloitte Haskins & Sells
Ramanath Iyer & Co
Type
Statutory
Cost Auditor
Exhibit 23: MOSL forecast v/s consensus
EPS
(INR)
FY15
FY16
FY17
MOSL
forecast
129.8
171.2
201.4
Consensus
forecast
133.4
165.1
182.0
Variation
(%)
-2.7
3.7
10.7
3 February 2015
8

Hero MotoCorp
Financials and valuations
Income Statement
Y/E March
Volumes ('000)
Volume Growth (%)
Net Sales
Change (%)
EBITDA
Adj EBITDA Margin (%)
Depreciation
EBIT
Interest cost
Other Income
PBT
Tax
Effective Tax Rate (%)
PAT
Change (%)
% of Net Sales
Adj. PAT
Change (%)
2010
4,600
23.6
157,582
27.9
26,620
16.9
1,915
24,705
-206
3,406
28,317
5,999
21.2
22,318
74.1
14.2
22,318
74.1
2011
5,402
17.4
192,450
22.1
24,596
11.8
4,024
20,573
152
4,425
24,048
4,769
19.8
19,279
-13.6
10.0
20,077
-10.0
2012
6,235
(INR Million)
2013
6,076
2014
6,246
2015E
6,754
8.1
276,992
10.2
34,807
11.8
5,401
29,406
125
6,840
36,121
10,198
28.2
25,923
38.6
9.4
25,923
38.6
2016E
7,595
12.5
318,522
15.0
44,249
13.9
4,026
40,223
125
7,742
47,840
13,644
28.5
34,196
31.9
10.7
34,196
31.9
2017E
8,663
14.1
368,231
15.6
51,679
14.0
4,450
47,230
125
9,478
56,582
16,364
28.9
40,219
17.6
10.9
40,219
17.6
15.4
233,681
21.4
34,078
11.0
10,973
23,105
213
5,756
28,647
4,866
17.0
23,781
23.4
10.2
23,781
18.4
-2.6
235,827
0.9
30,991
9.5
11,418
19,574
119
5,838
25,292
4,110
16.3
21,182
-10.9
9.0
21,182
-10.9
2.8
251,249
6.5
33,895
10.1
11,074
22,821
118
5,969
28,673
9,966
34.8
18,707
-11.7
7.4
18,707
-11.7
Balance Sheet
Y/E March
Sources of Funds
Share Capital
Reserves
Net Worth
Deferred Tax
Loans
Capital Employed
Application of Funds
Gross Fixed Assets
Less: Depreciation
Net Fixed Assets
Capital WIP
Investments
Curr.Assets, L & Adv.
Inventory
Sundry Debtors
Cash & Bank Balances
Loans & Advances
Others
Current Liab. & Prov.
Sundry Creditors
Other Liabilities
Provisions
Net Current Assets
Application of Funds
E: MOSL Estimates
2010
399
34,251
34,650
1,606
660
36,917
27,510
10,922
16,588
481
39,257
28,826
4,364
1,084
19,072
4,058
248
48,314
11,114
26,936
10,264
-19,488
36,917
2011
399
29,161
29,561
2,468
21,518
53,546
55,385
14,582
40,803
500
51,288
14,673
5,249
1,306
715
6,870
532
53,716
20,733
22,173
10,811
-39,044
53,546
2012
399
42,499
42,898
2,083
17,143
62,124
63,083
25,228
37,855
388
39,643
21,003
6,756
2,723
768
10,092
664
36,765
22,932
2,933
10,901
-15,762
62,124
2013
399
49,663
50,062
1,324
3,022
54,408
67,355
36,645
30,710
621
36,238
28,848
6,368
6,650
1,810
13,336
683
42,008
18,733
8,876
14,399
-13,161
54,408
2014
399
55,599
55,999
0
245
56,243
69,089
46,657
22,433
8,541
40,888
28,052
6,696
9,206
1,175
10,277
699
44,730
22,906
5,881
15,943
-16,678
56,243
2015E
399
64,935
65,335
0
-1,766
63,569
88,631
52,058
36,573
1,000
40,888
36,210
7,382
10,149
6,579
11,330
770
52,161
25,253
9,486
17,422
-15,951
63,569
2016E
399
79,880
80,279
0
-1,766
78,514
98,631
56,084
42,547
1,000
40,888
53,179
8,488
11,671
19,105
13,029
886
60,159
29,039
10,908
20,211
-6,980
78,514
(INR Million)
2017E
399
98,441
98,841
0
-1,766
97,075
103,631
60,534
43,097
1,000
40,888
79,980
9,813
13,492
40,589
15,062
1,024
68,949
33,571
12,611
22,768
11,031
97,075
3 February 2015
9

Hero MotoCorp
Financials and valuations
Ratios
Y/E March
Basic (INR)
EPS
EPS Growth (%)
Cash EPS
Book Value per Share
DPS
Payout (Incl. Div. Tax) %
Valuation (x)
P/E
Cash P/E
EV/EBITDA
EV/Sales
Price to Book Value
Dividend Yield (%)
Profitability Ratios (%)
RoE
RoCE
Turnover Ratios
Debtors (Days)
Inventory (Days)
Creditors (Days)
Working Capital (Days)
Asset Turnover (x)
Fixed Asset Turnover
Leverage Ratio
Debt/Equity (x)
2010
111.8
74.1
121.3
173.5
110.0
115.0
2011
100.5
-10.0
107.6
2012
119.1
18.4
132.0
214.8
45.0
43.5
23.6
21.3
15.8
2.3
13.1
1.6
65.6
49.9
4
11
36
-25
3.8
5.9
0.4
2013
106.1
-10.9
120.2
250.7
60.0
65.1
26.5
23.4
17.0
2.2
11.2
2.1
45.6
43.6
11
10
29
-20
4.3
6.9
0.1
2014
93.7
-11.7
106.1
280.4
65.0
79.8
30.0
26.5
15.3
2.1
10.0
2.3
35.3
52.0
14
10
33
-24
4.5
9.5
0.0
2015E
2016E
2017E
129.8
38.6
156.9
327.2
70.0
62.0
21.7
17.9
14.7
1.8
8.6
2.5
42.7
60.5
14
10
33
-21
4.4
9.4
0.0
171.2
31.9
191.4
402.0
80.0
53.7
16.4
14.7
11.3
1.6
7.0
2.8
47.0
67.5
14
10
33
-8
4.1
8.1
0.0
201.4
17.6
223.7
494.9
90.0
51.4
14.0
12.6
9.3
1.3
5.7
3.2
44.9
64.6
14
10
33
11
3.8
8.6
0.0
148.0
105.0
125.1
5.5
61.4
72.8
3
11
26
-45
4.3
9.7
0.0
5.5
62.5
55.3
3
11
39
-74
3.6
6.7
0.7
Cash Flow Statement
Y/E March
Profit before Tax
Depreciation & Amort.
Direct Taxes Paid
(Inc)/Dec in Working Capital
Interest/Div. Received
Other Items
CF from Oper. Activity
(Inc)/Dec in FA+CWIP
CF from Inv. Activity
Interest Paid
Dividends Paid
CF from Fin. Activity
Inc/(Dec) in Cash
Add: Beginning Balance
Closing Balance
E: MOSL Estimates
2010
28,317
1,915
-5,751
4,846
458
-2,476
27,309
-2,101
-5,734
-21
-20,948
-21,093
497
135
632
2011
24,048
2,253
-4,812
1,847
581
-2,565
21,352
-3,610
-13,804
-152
-9,401
-9,552
-2,005
625
-1,380
2012
28,647
2,807
-5,827
-6,906
698
-3,290
16,130
-5,034
8,396
-213
-24,369
-24,582
-56
393
337
2013
25,292
3,941
-6,133
-7,872
1,073
-3,800
12,500
-6,004
-925
-119
-10,444
-10,563
1,012
337
1,349
2014
28,673
2,491
-9,966
105
118
21,421
-2,134
-6,783
-118
-15,199
-15,317
-680
1,810
1,130
2015E
36,121
3,391
-10,198
2016E
47,840
4,026
-13,644
(INR Million)
2017E
56,582
4,450
-16,364
2,667
125
32,107
-9,990
-9,990
-125
3,555
125
41,902
-10,000
-10,000
-125
3,473
125
48,266
-5,000
-5,000
-125
-16,587
-16,712
5,404
1,175
6,579
-19,251
-19,376
12,526
6,579
19,105
-21,657
-21,782
21,484
19,105
40,589
3 February 2015
10

Hero MotoCorp
NOTES
3 February 2015
11

This document has been prepared by Motilal Oswal Securities Limited (hereinafter referred to as Most) to provide information about the company(ies) and/sector(s), if any, covered in the report and may be
distributed by it and/or its affiliated company(ies). This report is for personal information of the selected recipient/s and does not construe to be any investment, legal or taxation advice to you. This research report does
not constitute an offer, invitation or inducement to invest in securities or other investments and Motilal Oswal Securities Limited (hereinafter referred as MOSt) is not soliciting any action based upon it. This report is not
for public distribution and has been furnished to you solely for your general information and should not be reproduced or redistributed to any other person in any form. This report does not constitute a personal
recommendation or take into account the particular investment objectives, financial situations, or needs of individual clients. Before acting on any advice or recommendation in this material, investors should consider
whether it is suitable for their particular circumstances and, if necessary, seek professional advice. The price and value of the investments referred to in this material and the income from them may go down as well as
up, and investors may realize losses on any investments. Past performance is not a guide for future performance, future returns are not guaranteed and a loss of original capital may occur.
MOSt and its affiliates are a full-service, integrated investment banking, investment management, brokerage and financing group. We and our affiliates have investment banking and other business relationships with a
some companies covered by our Research Department. Our research professionals may provide input into our investment banking and other business selection processes. Investors should assume that MOSt and/or
its affiliates are seeking or will seek investment banking or other business from the company or companies that are the subject of this material and that the research professionals who were involved in preparing this
material may educate investors on investments in such business. The research professionals responsible for the preparation of this document may interact with trading desk personnel, sales personnel and other
parties for the purpose of gathering, applying and interpreting information. Our research professionals are paid on the profitability of MOSt which may include earnings from investment banking and other business.
MOSt generally prohibits its analysts, persons reporting to analysts, and members of their households from maintaining a financial interest in the securities or derivatives of any companies that the analysts cover.
Additionally, MOSt generally prohibits its analysts and persons reporting to analysts from serving as an officer, director, or advisory board member of any companies that the analysts cover. Our salespeople, traders,
and other professionals or affiliates may provide oral or written market commentary or trading strategies to our clients that reflect opinions that are contrary to the opinions expressed herein, and our proprietary
trading and investing businesses may make investment decisions that are inconsistent with the recommendations expressed herein. In reviewing these materials, you should be aware that any or all of the foregoing
among other things, may give rise to real or potential conflicts of interest. MOSt and its affiliated company(ies), their directors and employees and their relatives may; (a) from time to time, have a long or short position
in, act as principal in, and buy or sell the securities or derivatives thereof of companies mentioned herein. (b) be engaged in any other transaction involving such securities and earn brokerage or other compensation
or act as a market maker in the financial instruments of the company(ies) discussed herein or act as an advisor or lender/borrower to such company(ies) or may have any other potential conflict of interests with
respect to any recommendation and other related information and opinions.; however the same shall have no bearing whatsoever on the specific recommendations made by the analyst(s), as the recommendations
made by the analyst(s) are completely independent of the views of the affiliates of MOSt even though there might exist an inherent conflict of interest in some of the stocks mentioned in the research report
Reports based on technical and derivative analysis center on studying charts company's price movement, outstanding positions and trading volume, as opposed to focusing on a company's fundamentals and, as
such, may not match with a report on a company's fundamental analysis. In addition MOST has different business segments / Divisions with independent research separated by Chinese walls catering to different set
of customers having various objectives, risk profiles, investment horizon, etc, and therefore may at times have different contrary views on stocks sectors and markets.
Unauthorized disclosure, use, dissemination or copying (either whole or partial) of this information, is prohibited. The person accessing this information specifically agrees to exempt MOSt or any of its affiliates or
employees from, any and all responsibility/liability arising from such misuse and agrees not to hold MOSt or any of its affiliates or employees responsible for any such misuse and further agrees to hold MOSt or any of
its affiliates or employees free and harmless from all losses, costs, damages, expenses that may be suffered by the person accessing this information due to any errors and delays. The information contained herein is
based on publicly available data or other sources believed to be reliable. Any statements contained in this report attributed to a third party represent MOSt’s interpretation of the data, information and/or opinions
provided by that third party either publicly or through a subscription service, and such use and interpretation have not been reviewed by the third party. This Report is not intended to be a complete statement or
summary of the securities, markets or developments referred to in the document. While we would endeavor to update the information herein on reasonable basis, MOSt and/or its affiliates are under no obligation to
update the information. Also there may be regulatory, compliance, or other reasons that may prevent MOSt and/or its affiliates from doing so. MOSt or any of its affiliates or employees shall not be in any way
responsible and liable for any loss or damage that may arise to any person from any inadvertent error in the information contained in this report. MOSt or any of its affiliates or employees do not provide, at any time,
any express or implied warranty of any kind, regarding any matter pertaining to this report, including without limitation the implied warranties of merchantability, fitness for a particular purpose, and non-infringement.
The recipients of this report should rely on their own investigations.
This report is intended for distribution to institutional investors. Recipients who are not institutional investors should seek advice of their independent financial advisor prior to taking any investment decision based on
this report or for any necessary explanation of its contents.
Most and it’s associates may have managed or co-managed public offering of securities, may have received compensation for investment banking or merchant banking or brokerage services, may have received any
compensation for products or services other than investment banking or merchant banking or brokerage services from the subject company in the past 12 months.
Most and it’s associates have not received any compensation or other benefits from the subject company or third party in connection with the research report.
Subject Company may have been a client of Most or its associates during twelve months preceding the date of distribution of the research report
MOSt and/or its affiliates and/or employees may have interests/positions, financial or otherwise of over 1 % at the end of the month immediately preceding the date of publication of the research in the securities
mentioned in this report. To enhance transparency, MOSt has incorporated a Disclosure of Interest Statement in this document. This should, however, not be treated as endorsement of the views expressed in the
report.
Motilal Oswal Securities Limited is under the process of seeking registration under SEBI (Research Analyst) Regulations, 2014.
There are no material disciplinary action that been taken by any regulatory authority impacting equity research analysis activities
Analyst Certification
The views expressed in this research report accurately reflect the personal views of the analyst(s) about the subject securities or issues, and no part of the compensation of the research analyst(s) was, is, or will be
directly or indirectly related to the specific recommendations and views expressed by research analyst(s) in this report. The research analysts, strategists, or research associates principally responsible for preparation
of MOSt research receive compensation based upon various factors, including quality of research, investor client feedback, stock picking, competitive factors and firm revenues
Disclosure of Interest Statement
§
Analyst ownership of the stock
§
Served as an officer, director or employee
HERO MOTOCORP
No
No
Disclosures
Hero MotoCorp
Regional Disclosures (outside India)
For U.S.
This report is not directed or intended for distribution to or use by any person or entity resident in a state, country or any jurisdiction, where such distribution, publication, availability or use would be contrary to law,
regulation or which would subject MOSt & its group companies to registration or licensing requirements within such jurisdictions.
Motilal Oswal Securities Limited (MOSL) is not a registered broker - dealer under the U.S. Securities Exchange Act of 1934, as amended (the"1934 act") and under applicable state laws in the United States. In
addition MOSL is not a registered investment adviser under the U.S. Investment Advisers Act of 1940, as amended (the "Advisers Act" and together with the 1934 Act, the "Acts), and under applicable state laws in the
United States. Accordingly, in the absence of specific exemption under the Acts, any brokerage and investment services provided by MOSL, including the products and services described herein are not available to or
intended for U.S. persons.
This report is intended for distribution only to "Major Institutional Investors" as defined by Rule 15a-6(b)(4) of the Exchange Act and interpretations thereof by SEC (henceforth referred to as "major institutional
investors"). This document must not be acted on or relied on by persons who are not major institutional investors. Any investment or investment activity to which this document relates is only available to major
institutional investors and will be engaged in only with major institutional investors. In reliance on the exemption from registration provided by Rule 15a-6 of the U.S. Securities Exchange Act of 1934, as amended (the
"Exchange Act") and interpretations thereof by the U.S. Securities and Exchange Commission ("SEC") in order to conduct business with Institutional Investors based in the U.S., MOSL has entered into a chaperoning
agreement with a U.S. registered broker-dealer, Motilal Oswal Securities International Private Limited. ("MOSIPL"). Any business interaction pursuant to this report will have to be executed within the provisions of this
chaperoning agreement.
The Research Analysts contributing to the report may not be registered /qualified as research analyst with FINRA. Such research analyst may not be associated persons of the U.S. registered broker-dealer, MOSIPL,
and therefore, may not be subject to NASD rule 2711 and NYSE Rule 472 restrictions on communication with a subject company, public appearances and trading securities held by a research analyst account.
Motilal Oswal Capital Markets Singapore Pte Limited is acting as an exempt financial advisor under section 23(1)(f) of the Financial Advisers Act(FAA) read with regulation 17(1)(d) of the Financial Advisors
Regulations and is a subsidiary of Motilal Oswal Securities Limited in India. This research is distributed in Singapore by Motilal Oswal Capital Markets Singapore Pte Limited and it is only directed in Singapore to
accredited investors, as defined in the Financial Advisers Regulations and the Securities and Futures Act (Chapter 289), as amended from time to time.
In respect of any matter arising from or in connection with the research you could contact the following representatives of Motilal Oswal Capital Markets Singapore Pte Limited:
Anosh Koppikar
Kadambari Balachandran
Email : anosh.Koppikar@motilaloswal.com
Email : kadambari.balachandran@motilaloswal.com
Contact : (+65)68189232
Contact : (+65) 68189233 / 65249115
Office Address : 21 (Suite 31),16 Collyer Quay,Singapore 04931
For Singapore
3 February 2015
Motilal Oswal Securities Ltd
Motilal Oswal Tower, Level 9, Sayani Road, Prabhadevi, Mumbai 400 025
Phone: +91 22 3982 5500 E-mail: reports@motilaloswal.com
12