3 February 2015
3QFY15 Results Update | Sector:
Automobiles
TVS Motor Company
BSE SENSEX
29,000
Bloomberg
Equity Shares (m)
M.Cap. (INR b) / (USD b)
52-Week Range (INR)
1, 6, 12 Rel. Per (%)
Avg Val (INRm)/Vol ‘000
Free float (%)
S&P CNX
8,757
TVSL IN
475.1
135.9/2.2
322/77
3/74/216
614/3,270
42.6
CMP: INR286
n
TP: INR326 (+14%)
Buy
EBITDA margin flat at 6%; PAT restricted by lower other income
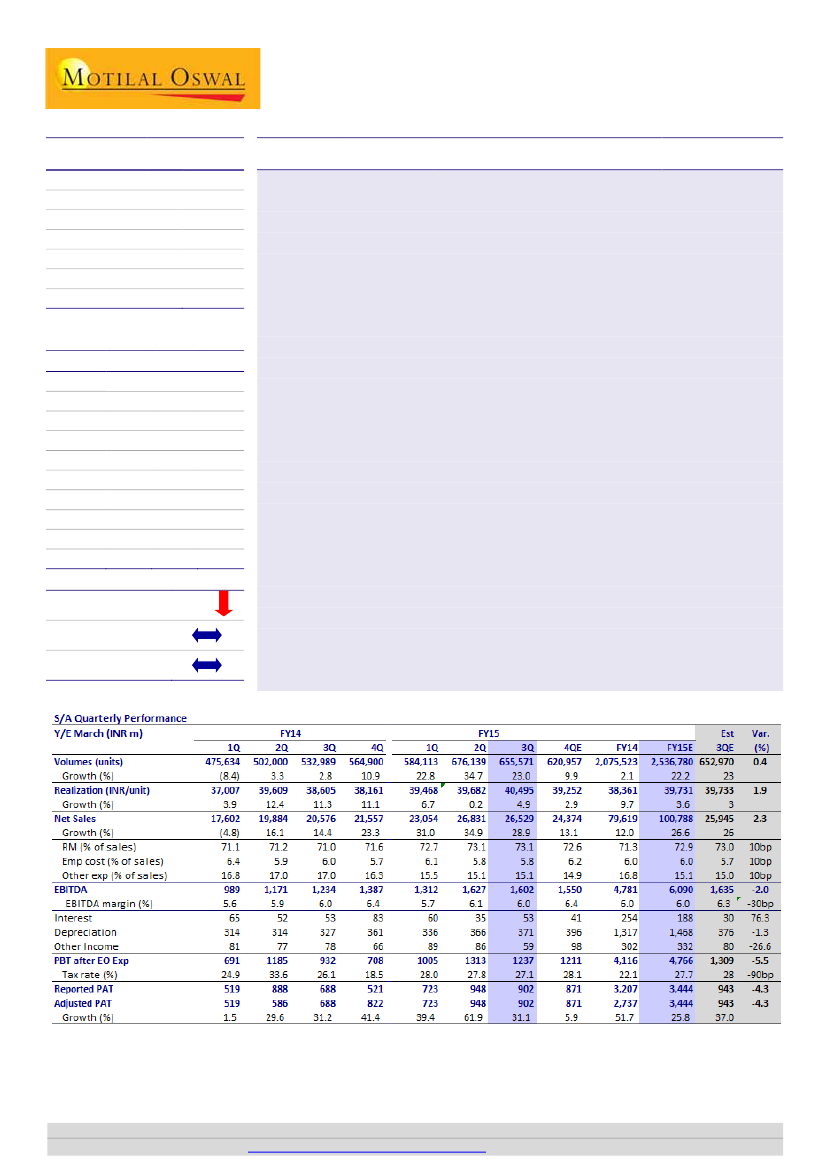
EBITDA margin flat, adj. PAT grows ~31% YoY:
TVSL 3QFY15 performance was
in line with estimates, with EBITDA at ~INR1.6b. Net sales grew 38.9% YoY (-
1.1% QoQ) to INR26.5b (est. INR25.9b) driven by volume growth of 23% YoY (-
3% QoQ) to 655,571 units (est. 653,000 units). Realizations rose by 4.9% YoY
(2% QoQ) to ~INR40,495 (v/s est. ~INR39,733), driven by higher contribution of
Motorcycles and 3Ws. EBITDA margin was flat YoY, down 10bp QoQ to 6% (v/s
est. 6.3%). PAT grew ~31% YoY (-4.9% QoQ) to ~INR902m (v/s est. ~INR943m).
Earnings call highlights:
a) Overall market share in 2Ws at 13.5%, target of
14.5% by 4QFY15, b) blended 0.2% price increase in January 2015 apart from
the excise duty hike, c) 3Q/ 9MFY15 EBITDA margin impacted by 55bp due to
provision for VAT on stock transfers, d) inventory at 28-30 days, e) rural sales to
catch up post harvesting season, f) two new motorcycle launches postponed by
3/6 month to 1Q/2QFY16 to ensure adequate supplies for recent launches, g)
capacity expansion by 5,000 units in 3Ws to 15,000 units in next six months, h)
target of 18% market share in scooters (current 14%) and 20% market share in
domestic 3Ws (in addressed segment) from current 11%, i) Excise duty increase
to boost EBITDA margins by ~0.3%, due to excise exempt plant, and j) maintains
target of EBITDA breakeven in FY16 for Indonesia business.
Valuation and view:
We lower FY15E/16E EPS by 10.9%/8.3% to
~INR7.2/INR13.3 for a) volume cut in exports and b) delay in new product
launches to 1Q/2QFY16. TVSL trades at 21.5x/15.3x FY16E/17E EPS. We value
TVSL at ~17.5x FY17E EPS (~10% premium to peers BJAUT/HMCL for very strong
EPS CAGR of 60%). Maintain
Buy
with a target price of INR326 (17.5x S/A FY17E
EPS).
Financials & Valuation (INR Billion)
Y/E Mar
Net Sales
EBITDA
Adj PAT
EPS (INR)
Gr.(%)
BV/Sh.(INR)
RoE (%)
RoCE (%)
P/E (x)
P/BV (x)
2015E
100.8
6.1
3.4
7.2
32.1
34.9
22.4
25.3
39.4
8.2
2016E
132.9
10.2
6.3
13.3
83.2
45.6
33.0
39.2
21.5
6.3
2017E
158.7
13.9
8.8
18.6
40.3
61.3
34.9
43.5
15.3
4.7
n
n
Estimate change
TP change
Rating change
11/8%
Jinesh Gandhi
(Jinesh@MotilalOswal.com); +91 22 3982 5416
Investors are advised to refer through disclosures made at the end of the Research Report.
Motilal Oswal research is available on
www.motilaloswal.com/Institutional-Equities,
Bloomberg, Thomson Reuters, Factset and S&P Capital.

TVS Motor Company
Robust growth across portfolio drives 30% revenue growth
n
n
n
Net sales grew 30% YoY (-1.1% QoQ) to INR26.5b (est INR25.9b) driven by
volume growth of 23% YoY (-3.0% QoQ) to 655k units (est 653k units).
Scooters grew by 52.1% YoY, while 3Ws registered 38.1% YoY growth. Mopeds
and motorcycle also grew by 10.1% and 23.1% respectively.
Realizations went up by 4.8% YoY (2% QoQ) to ~INR40,495 (v/s est ~INR39,733),
higher contribution by Motorcycles and 3Ws.
Exhibit 2: ….contributed by entire portfolio
Growth (%)
676 656
Growth YoY (3QFY15)
52.1
38.1
23.1
10.1
Exhibit 1: Strong 23% volume growth….
Volumes ('000 units)
584
519 486 518 509 476 502 533 565
Motorcycles
Source: Company, MOSL
Scooters
Mopeds
3Ws
Source: Company, MOSL
Exhibit 3: Sequential change in mix in favor of scooters, 3Ws
3Ws
1.7
2.5
2.6
Mopeds
2.8
Scooters
Motorcycles
4.3 4.1 4.3
30.7 29.3 29.5
26.0 28.8 28.4
39.0 37.7 37.9
Exhibit 4: Robust ~29% YoY growth in net sales
Net sales (INR b)
Growth (%)
23.3
14.4
31.0 34.9 28.9
3.3 4.6 3.9 3.7
28.2 32.5 34.2
39.3 37.8 37.5 41.2
45.3
25.2 23.7 23.1
21.7 24.5 21.6 19.2
19.8
37.2 35.2 38.3 36.8 43.3 39.2 38.9 31.2
5.9
1.3
(14.0)
6.8
(4.8)
16.1
Source: Company, MOSL
Margins remain stable at ~6%
n
n
n
n
n
n
EBITDA grew 30% YoY (-1.5% QoQ) to ~INR1.6b (in-line with est.).
EBITDA margins flat YoY, down 10bbp QoQ to 6% (v/s est 6.3%).
RM cost went up by 210bp YoY (+10bp QoQ), impacted by adverse mix. Also,
other expenses increased ~14.4% QoQ.
3Q/9MFY15 EBITDA margin were impacted by 55bp due to provision for VAT on
stock transfers, for which it is seeking clarification.
Interest cost went down by 0.6% YoY (+53.3% QoQ) to INR53mn (v/s est
INR30mn). Tax rate stood at 27.1% (v/s est 28%).
PAT grew 31.1% YoY (-4.9% QoQ) to ~INR902m (v/s est ~INR943m).
3 February 2015
2

TVS Motor Company
Exhibit 5: EBITDA margin up to 6% (down 10bp QoQ)
EBITDA (INR m)
5.8
5.9
5.9
5.4
5.6
5.9
EBITDA margin (%)
6.0
6.4
5.7
6.1
6.0
Exhibit 6: PAT growth restricted on lower other income
PAT
Growth (%)
31.2
(13.1)
(7.2)
1.6
1.5
29.6
41.4 39.4
61.9
31.1
(40.9)
Source: Company, MOSL
Other key highlight from the conference call
n
n
n
n
n
n
n
n
n
n
Overall market share in 2Ws at 13.5%, target of 14.5% by 4QFY15
Blended 0.2% price increase in January 2015 apart from the excise duty hike
3Q/ 9MFY15 EBITDA margin impacted by 55bp due to provision for VAT on stock
transfers
Inventory at comfortable level of 28-30 days
Rural sales to catch up post harvesting season
Two new motorcycle launches postponed by 3/6 month to 1Q/2QFY16 to
ensure adequate supplies for recent launches
Capacity expansion by 5,000 units in 3Ws to 15,000 units in next six months
Target of 18% market share in scooters (current 14%) and 20% market share in
domestic 3Ws (in addressed segment) from current 11%
Excise duty increase to boost EBITDA margins by ~0.3%, due to excise exempt
plant
Maintains target of EBITDA breakeven in FY16 for Indonesia business.
Valuation and view
n
n
n
Recent launches driving resurgence; becomes 2nd and 3rd largest in scooters
and dom. 2Ws respectively:
Successful launch of Jupiter and Star City Plus are
driving customers back to TVS brand, after long time. Market share in both the
scooters and motorcycles are on rising trend, with TVS now the 2nd largest in
scooters and 4th largest in domestic 2W. Expect market share gains to continue
as recent launches (Star City+ and Scooty Zest) in Southern market (key market
for TVSL) gains traction.
Still 40% of the market unaddressed; Victor 110cc motorcycle re-launch could
give disproportionate benefit:
Recent launches have seen encouraging
customer response and have driven significant market share gains. Successful
launch of new launches could give disproportionate benefit led by improving
brand acceptance and wide distribution network (2nd best to HMCL). Recovery
in industry growth, ramp-up in production of recent launches and upcoming re-
launch of Victor motorcycle (in Executive segment which is ~40% of total 2W
industry) to drive 19% volume CAGR over FY15-17E.
EBITDA margins to improve 270bp over FY15-17E with improving market
position and scale, expect:
TVSL has been generally aggressive in pricing the
3
3 February 2015

TVS Motor Company
n
n
products due to its weak brand equity. Improving competitive positioning
together with operating leverage (particularly on marketing and employee cost)
to drive 270bp margin expansion to 8.7% over FY15-17E.
BMW Motorrad tie-up to give additional revenue stream, technological edge:
Not factored in our estimates:
We believe this tie-up would give TVSL an
additional revenue stream in the form of contract manufacturing for BMW
Motorrad. Moreover, it would give an aspiration value to TVSL products,
particularly premium ones. TVSL would invest EUR20m over CY13-15, with the
first product expected to be launched by 1QCY16. Due to inadequate details, we
have not factored the P&L implications; though have covered the investment
requirements on a conservative basis.
Valuation and view (new launches to watch out for):
Considering well
positioned scooter portfolio, robust product pipeline coupled with possibility of
disproportionate gains on new launch success, we continue to remain positive
on the stock. We downgrade our FY15E/FY16E EPS by 10.9%/8.3% to
~INR7.2/INR13.3 for a) volume cut in exports and b) delay in new product
launches to 1Q/2QFY16. TVSL trades at 21.5x/15.3x FY16E/17E EPS. We value
TVSL at ~17.5x FY17E EPS (~10% premium to peers BJAUT/HMCL for very strong
EPS CAGR of 60%). Maintain
Buy
with TP of INR326 (17.5x S/A FY17E EPS)
Exhibit 7: Revised forecast (Standalone)
(INR M)
Rev
Volumes
(units)
Net Sales
EBITDA
EBITDA (%)
Net Profit
EPS (INR)
FY15E
Old
Chg
(%)
Rev
FY16E
Old
Chg
(%)
Rev
FY17E
Old
Chg
(%)
2,548,877 2,691,417 (5.3) 3,173,867 3,314,075 (4.2) 3,602,895 3,694,329 (2.5)
100,788 106,153 -5.1 132,884 135,372 -1.8 158,697 156,188
1.6
6,090
6,651 -8.4 10,207
11,007 -7.3
13,856
13,559
2.2
6.0
6.3 -20bp
7.7
8.1 -50bp
8.7
8.7 0bp
3,444
3,867 -10.9
6,308
6,878 -8.3
8,849
8,586
3.1
7.2
8.1 -10.9
13.3
14.5 -8.3
18.6
18.1
3.1
Source: Company, MOSL
Exhibit 8: Valuations
trading
above historical average, reflecting improving fundamentals
32
24
16
8
0
12.6
11.5
10.4
P/E (x)
5 Yrs Avg(x)
13 Yrs Avg(x)
10 Yrs Avg(x)
8.0
23.0
6.0
4.0
P/B (x)
5 Yrs Avg(x)
13 Yrs Avg(x)
10 Yrs Avg(x)
6.7
2.4
2.0
0.0
1.7
1.5
Source: MOSL
Source: MOSL
3 February 2015
4

TVS Motor Company
Exhibit 9: Comparative Valuation
Auto OEM's
Bajaj Auto
Hero MotoCorp
TVS Motor
M&M
Maruti Suzuki
Tata Motors
Ashok Leyland
Eicher Motors#
Auto Ancillaries
Bharat Forge
Exide Industries
Amara Raja Batteries
# Nos. are on CY basis
CMP * Rating
(INR)
2,260 Buy
2,812 Buy
286 Buy
1,200 Neutral
3,608 Buy
602 Buy
65 Buy
16,320 Buy
1,089
198
910
Buy
Buy
Buy
TP
P/E (x)
(INR) FY16E
FY17E
2,832
14.9
12.8
3,222
16.4
14.0
326
21.5
15.3
1,319
15.3
12.2
4,616
20.9
15.7
744
8.0
6.8
87
18.3
10.9
16,473
41.8
26.1
1,233
241
1,093
25.8
21.3
28.4
19.9
17.8
20.8
EV/EBITDA (x)
FY16E
FY17E
9.4
7.6
11.3
9.3
13.4
9.5
13.1
10.7
11.1
8.7
3.4
2.7
9.1
5.8
25.1
16.4
13.6
13.2
16.1
10.5
10.8
12.0
RoE (%)
FY16E
FY17E
36.4
35.4
47.0
44.9
33.0
34.9
16.5
16.9
18.5
20.6
25.2
23.3
18.0
26.0
36.8
41.4
26.9
16.8
28.8
27.7
17.5
31.0
RoCE (%)
FY16E
FY17E
50.4
48.8
67.5
64.6
39.2
43.5
17.9
18.8
23.2
26.1
27.3
26.9
17.9
26.9
39.8
48.3
27.7
31.1
23.6
24.5
40.7
44.1
Source: Company, MOSL
3 February 2015
5

TVS Motor Company
Story in charts: Robust ~60% EPS CAGR over FY15-17E
Exhibit 10: Expect volume CAGR of 19% over FY15-17E
Volumes (units)
Growth (%)
24.6
23.0
8.2
2.4
13.6
13.5
12.7
Exhibit 11: Strong 26% CAGR in revenues over FY15-17E
Net sales (INR m)
Growth (%)
31.8
26.6
19.4
-7.5
FY12
FY13
FY14
FY15E
FY16E
FY17E
FY12
-1.1
FY13
FY14
FY15E
FY16E
FY17E
Source: Company, MOSL
Exhibit 12: Strong franchise, operating leverage to drive
margins
EBITDA (INR m)
EBITDA margin (%)
8.7
7.7
6.6
5.8
6.0
6.0
Exhibit 13: Higher PAT growth with better margins, lower
interest cost
PAT (INR m)
Growth (%)
83.2
40.3
32.1
(27.3)
44.0
26.3
FY12
FY13
FY14
FY15E
FY16E
FY17E
FY12
FY13
FY14
FY15E
FY16E
FY17E
Source: Company, MOSL
Exhibit 14: FCF to remain strong despite high capex plans
CFO (INR m)
Capex (INR m)
FCF (INR m)
10,979
8,856
7,529
3,906
Exhibit 15: Sharp improvement in return ratios
RoCE (%)
RoE (%)
33.0
23.0
15.1
19.7
20.3
22.4
39.2
25.3
43.5
34.9
4,440
2,672 3,303
2,536
-767
-1,768
FY12
FY13
5,184
5,703
2,803
2,604
19.8
-2,580
FY14
-2,900
FY15E
-4,950
FY16E
-3,450
FY17E
FY12
15.7
FY13
FY14
FY15E
FY16E
FY17E
Source: Company, MOSL
3 February 2015
6

TVS Motor Company
Key operating metrics
Exhibit 16: Snapshot of Revenue model
units
Motorcycle
Growth (%)
% of total vols
Scooter
Growth (%)
% of total vols
Moped
Growth (%)
% of total vols
Total 2Ws
Growth (%)
% of total vols
3Ws
Growth (%)
% of total vols
Domestic
Growth (%)
% of total vols
Exports
Growth (%)
% of total vols
Total volumes
Growth (%)
ASP (INR/unit)
Growth (%)
Net Sales (INR m)
Growth (%)
36,709
14.0
FY09
635,889
3.0
48.0
247,756
-4.7
18.7
436,767
6.2
33.0
2.4
99.7
4,613
5,814.1
0.3
-1.8
85.4
193,337
41.1
14.6
2.8
27,705
FY10
640,801
0.8
41.7
309,462
24.9
20.1
571,489
30.8
37.2
15.2
99.0
15,116
227.7
1.0
21.0
89.1
167,130
-13.6
10.9
16.0
28,390
2.5
43,631
18.9
FY11
836,831
30.6
41.2
452,006
46.1
22.2
703,167
23.0
34.6
30.9
98.0
39,860
163.7
2.0
30.5
88.0
244,551
46.3
12.0
32.2
30,947
9.0
62,880
44.1
FY12
843,114
0.8
38.4
529,091
17.1
24.1
785,942
11.8
35.8
8.3
98.2
39,792
-0.2
1.8
6.9
86.9
287,713
17.6
13.1
8.2
32,492
5.0
71,415
13.6
FY13
749,429
-11.1
36.9
441,552
-16.5
21.7
792,069
0.8
39.0
-8.1
97.6
49,190
23.6
2.4
-6.5
87.9
245,233
-14.8
12.1
-7.5
34,765
7.0
70,650
-1.1
FY14
793,479
5.9
38.1
475,668
7.7
22.9
730,172
-7.8
35.1
1,999,319
0.8
96.1
80,842
64.3
3.9
1,765,142
-1.2
84.9
315,019
28.5
15.1
2,080,161
2.4
38,275
10.1
79,619
12.7
FY15E
952,622
20.1
37.2
723,000
52.0
28.3
776,700
6.4
30.4
2,452,322
22.7
95.9
106,167
31.3
4.1
2,170,589
23.0
84.8
387,900
23.1
15.2
2,558,489
23.0
39,393
2.9
100,788
26.6
FY16E
1,330,322
39.6
41.7
865,200
19.7
27.1
869,730
12.0
27.3
3,065,252
25.0
96.2
122,091
15.0
3.8
2,742,893
26.4
86.1
444,450
14.6
13.9
3,187,343
24.6
41,691
5.8
132,884
31.8
FY17E
1,544,981
16.1
42.7
994,980
15.0
27.5
939,500
8.0
26.0
3,479,461
13.5
96.2
139,297
14.1
3.8
3,093,008
12.8
85.5
525,750
18.3
14.5
3,618,758
13.5
43,854
5.2
158,697
19.4
1,320,412 1,521,752 1,992,004 2,158,147 1,983,050
1,131,688 1,369,738 1,787,313 1,910,226 1,787,007
1,325,025 1,536,868 2,031,864 2,197,939 2,032,240
Source: Company, MOSL
3 February 2015
7

TVS Motor Company
Corporate profile: TVS Motor Company
Company description
TVS Motor Company is 4
th
largest two-wheeler
company in India. TVS Motor Company is the
flagship company of the 100 year old six billion USD
TVS Group, which has some 40 companies and
holdings in the automotive sector. TVS Motor
Company offers the widest range of product in the
Indian two and three wheeler industry. TVS Motor
Company has international presence in more than
50 countries in Asia, Africa and Latin America.
Exhibit 17: Sensex rebased
Exhibit 18: Shareholding pattern (%)
Dec-14
Promoter
DII
FII
Others
57.4
12.1
13.1
17.4
Sep-14
57.4
11.8
11.6
19.1
Dec-13
57.4
17.7
3.4
21.6
Exhibit 19: Top holders
Holder Name
Reliance Capital Trustee Company Ltd
HSBC Bank (Mauritius Ltd)
TVS Motor Harita Employees Welfare Foundation Pvt
Life Insurance Corporation of India Ltd
Tree Line Asia Master Fund (Singapore)
% Holding
5.9
3.0
2.0
1.3
1.3
Note: FII Includes depository receipts
Exhibit 20: Top management
Name
Venu Srinivasan
Sudarshan Venu
K.N. Radhakrishnan
S.G. Murali
Designation
Chairman & Managing Director
Joint Managing Director
President & CEO
Executive Vice President - Finance
Exhibit 21: Directors
Name
Venu Srinivasan
Sudarshan Venu
C R Dua*
T Kannan*
K S Bajpai*
Name
H Lakshmanan
R Ramakrishnan
Prince Asirvatham*
Hemant Krishan Singh*
Lakshmi Venu
*Independent
Exhibit 22: Auditors
Name
V Sankar Aiyar & Co
A N Raman
Type
Statutory
Cost Auditor
Exhibit 23: MOSL forecast v/s consensus
EPS
(INR)
FY15
FY16
FY17
MOSL
forecast
7.2
13.3
18.6
Consensus
forecast
7.9
12.2
16.8
Variation
(%)
-8.7
9.2
10.7
3 February 2015
8

TVS Motor Company
Financials and valuations
Standalone - Income Statement
Y/E March
Volumes (units)
Growth (%)
Gross Revenues
Less: Excise Duty
Net Sales
Change (%)
Total Expenditure
EBITDA
Margin (%)
Depreciation
EBIT
Int. and Finance Charges
Other Income - Rec.
PBT bef. EO Exp.
EO Expense/(Income)
PBT after EO Exp.
Tax Rate (%)
PAT Adj for EO items
Change (%)
FY10
1533375
46,796
3,165
43,631
18.9
41,537
2,094
4.8
1,025
1,069
754
1,338
1,653
868
785
-15.1
1,902
512.0
FY11
2042587
33.2
68,211
5,331
62,880
44.1
58,926
3,954
6.3
1,073
2,882
723
356
2,515
34
2,481
21.6
1,972
3.7
FY12
2,185,616
7.0
77,277
5,861
71,415
13.6
66,722
4,694
6.6
1,175
3,518
571
217
3,165
0
3,165
21.3
2,491
26.3
FY13
2,044,000
(6.5)
77,329
6,679
70,650
-1.1
66,560
4,090
5.8
1,304
2,786
480
246
2,552
916
1,636
29.1
1,810
-27.3
FY14
2,073,000
1.4
86,521
6,902
79,619
12.7
74,838
4,781
6.0
1,317
3,465
254
302
3,513
-13
3,525
25.8
2,607
44.0
FY15E
2,548,877
23.0
108,530
7,742
100,788
26.6
94,697
6,090
6.0
1,468
4,622
188
332
4,766
0
4,766
27.8
3,444
32.1
FY16E
3,173,867
24.5
142,959
10,074
132,884
31.8
122,678
10,207
7.7
1,662
8,545
165
382
8,761
0
8,761
28.0
6,308
83.2
(INR Million)
FY17E
3,602,895
13.5
170,570
11,873
158,697
19.4
144,842
13,856
8.7
1,862
11,994
143
439
12,291
0
12,291
28.0
8,849
40.3
Standalone - Balance Sheet
Y/E March
Equity Share Capital
Total Reserves
Net Worth
Deferred Liabilities
Total Loans
Capital Employed
Gross Block
Less: Accum. Deprn.
Net Fixed Assets
Capital WIP
Total Investments
Curr. Assets, Loans&Adv.
Inventory
Account Receivables
Cash and Bank Balance
Loans and Advances
Curr. Liability & Prov.
Account Payables
Provisions
Net Current Assets
Appl. of Funds
FY10
238
8,416
8,653
1,146
10,033
19,832
19,091
9,534
9,557
271
7,393
9,652
2,897
2,208
1,010
3,537
7,342
6,673
669
2,310
19,832
FY11
475
9,519
9,994
957
7,678
18,629
19,723
10,347
9,376
574
6,611
12,014
5,279
2,706
60
3,969
9,946
9,453
494
2,068
18,629
FY12
475
11,221
11,696
976
8,311
20,982
21,545
11,289
10,256
525
9,309
11,055
5,846
2,080
130
2,998
10,163
9,585
577
892
20,982
FY13
475
11,772
12,247
931
6,345
19,523
22,479
12,365
10,115
361
8,688
12,029
5,097
3,005
175
3,752
11,670
11,136
534
359
19,523
FY14
475
13,678
14,153
1,247
4,424
19,824
24,723
13,466
11,257
481
8,959
14,950
5,482
3,341
826
5,302
15,823
14,612
1,211
-873
19,824
FY15E
475
16,121
16,596
1,247
3,924
21,768
27,723
14,935
12,789
381
9,959
18,341
6,939
4,230
940
6,233
19,703
18,492
1,211
-1,362
21,767
FY16E
475
21,178
21,653
1,247
3,424
26,325
32,723
16,597
16,126
331
10,959
24,494
9,149
5,577
1,930
7,838
25,585
24,374
1,211
-1,092
26,324
(INR Million)
FY17E
475
28,638
29,113
1,247
2,924
33,284
36,223
18,458
17,765
281
11,959
33,596
10,926
6,660
6,427
9,583
30,316
29,105
1,211
3,280
33,284
3 February 2015
9

TVS Motor Company
Financials and valuations
Ratios
Y/E March
Basic (INR) *
EPS
Growth (%)
Cash EPS
BV/Share
DPS
Payout (%)
Valuation (x) *
P/E
Cash P/E
P/BV
EV/Sales
EV/EBITDA
Dividend Yield (%)
Return Ratios (%)
RoE
RoCE
Working Capital Ratios
Asset Turnover (x)
Inventory (Days)
Debtor (Days)
Creditor (Days)
Working Capital (Days)
Leverage Ratio (x)
Current Ratio
Debt/Equity
* Adjusted for treasury stocks
FY10
8.0
12.3
36.4
0.6
36.4
35.7
23.2
7.8
3.3
69.1
0.2
22.7
13.4
2.2
24.2
17
56
11
1.3
1.2
FY11
4.2
6.4
21.0
1.1
31.1
68.8
44.6
13.6
2.3
36.2
0.4
21.2
17.8
3.4
30.6
14
55
12
1.2
0.8
FY12
5.2
26.3
7.7
24.6
1.3
28.8
54.5
37.0
11.6
2.0
30.7
0.5
23.0
19.8
3.4
29.9
10
49
4
1.1
0.7
FY13
3.8
-27.3
6.6
25.8
1.2
56.5
75.0
43.6
11.1
2.0
34.7
0.4
15.1
15.7
3.6
26.3
14
58
1
1.0
0.5
FY14
5.5
44.0
8.3
29.8
1.4
29.6
52.1
34.6
9.6
1.7
29.1
0.5
19.7
20.3
4.0
25.1
14
67
-8
0.9
0.3
FY15E
7.2
32.1
10.3
34.9
1.8
29.1
39.4
27.6
8.2
1.4
22.8
0.6
22.4
25.3
4.6
25.1
14
67
-8
0.9
0.2
FY16E
13.3
83.2
16.8
45.6
2.3
19.8
21.5
17.0
6.3
1.0
13.4
0.8
33.0
39.2
5.0
25.1
14
67
-8
1.0
0.2
FY17E
18.6
40.3
22.5
61.3
2.5
15.7
15.3
12.7
4.7
0.8
9.5
0.9
34.9
43.5
4.8
25.1
14
67
-7
1.1
0.1
Standalone - Cash Flow Statement
Y/E March
NP/ (Loss) bef Tax and EO
Depreciation
Interest & Finance Charges
Direct Taxes Paid
(Inc)/Dec in WC
CF from Operations
Others
CF from Operating incl EO
(inc)/dec in FA
(Pur)/Sale of Investments
Others
CF from Investments
(Inc)/Dec in Debt
Interest Paid
Dividend Paid
CF from Fin. Activity
Inc/Dec of Cash
Add: Beginning Balance
Closing Balance
FY10
762
840
632
277
1,087
3,044
345
3,389
75
-3,484
556
-2,853
2,023
-754
-389
880
1,417
-407
1,010
FY11
2,481
813
470
811
-674
2,279
63
2,341
-1,074
830
223
-21
-3,968
-703
-411
-3,271
-950
1,010
60
FY12
3,165
942
408
700
626
4,440
-31
4,409
-1,768
-2,699
658
-3,809
-778
-571
-659
-530
70
60
130
FY13
1,628
1,076
327
527
800
3,303
878
4,181
-767
-295
77
-985
-276
-517
-715
-3,152
45
130
175
FY14
3,485
1,317
4
1,234
1,613
5,184
54
5,238
-2,580
-276
257
-2,598
-1,069
-230
-690
-1,988
651
175
826
FY15E
4,766
1,468
188
1,323
603
5,703
-332
5,370
-2,900
-1,000
332
-3,568
-500
-188
-1,001
-1,688
114
826
941
FY16E
8,761
1,662
165
2,453
720
8,856
-382
8,474
-4,950
-1,000
382
-5,568
-500
-165
-1,251
-1,916
990
941
1,931
(INR Million)
FY17E
12,291
1,862
143
3,441
125
10,979
-439
10,540
-3,450
-1,000
439
-4,011
-500
-143
-1,390
-2,033
4,497
1,931
6,427
3 February 2015
10

TVS Motor Company
NOTES
3 February 2015
11

This document has been prepared by Motilal Oswal Securities Limited (hereinafter referred to as Most) to provide information about the company(ies) and/sector(s), if any, covered in the report and may be
distributed by it and/or its affiliated company(ies). This report is for personal information of the selected recipient/s and does not construe to be any investment, legal or taxation advice to you. This research report does
not constitute an offer, invitation or inducement to invest in securities or other investments and Motilal Oswal Securities Limited (hereinafter referred as MOSt) is not soliciting any action based upon it. This report is not
for public distribution and has been furnished to you solely for your general information and should not be reproduced or redistributed to any other person in any form. This report does not constitute a personal
recommendation or take into account the particular investment objectives, financial situations, or needs of individual clients. Before acting on any advice or recommendation in this material, investors should consider
whether it is suitable for their particular circumstances and, if necessary, seek professional advice. The price and value of the investments referred to in this material and the income from them may go down as well as
up, and investors may realize losses on any investments. Past performance is not a guide for future performance, future returns are not guaranteed and a loss of original capital may occur.
MOSt and its affiliates are a full-service, integrated investment banking, investment management, brokerage and financing group. We and our affiliates have investment banking and other business relationships with a
some companies covered by our Research Department. Our research professionals may provide input into our investment banking and other business selection processes. Investors should assume that MOSt and/or
its affiliates are seeking or will seek investment banking or other business from the company or companies that are the subject of this material and that the research professionals who were involved in preparing this
material may educate investors on investments in such business. The research professionals responsible for the preparation of this document may interact with trading desk personnel, sales personnel and other
parties for the purpose of gathering, applying and interpreting information. Our research professionals are paid on the profitability of MOSt which may include earnings from investment banking and other business.
MOSt generally prohibits its analysts, persons reporting to analysts, and members of their households from maintaining a financial interest in the securities or derivatives of any companies that the analysts cover.
Additionally, MOSt generally prohibits its analysts and persons reporting to analysts from serving as an officer, director, or advisory board member of any companies that the analysts cover. Our salespeople, traders,
and other professionals or affiliates may provide oral or written market commentary or trading strategies to our clients that reflect opinions that are contrary to the opinions expressed herein, and our proprietary
trading and investing businesses may make investment decisions that are inconsistent with the recommendations expressed herein. In reviewing these materials, you should be aware that any or all of the foregoing
among other things, may give rise to real or potential conflicts of interest. MOSt and its affiliated company(ies), their directors and employees and their relatives may; (a) from time to time, have a long or short position
in, act as principal in, and buy or sell the securities or derivatives thereof of companies mentioned herein. (b) be engaged in any other transaction involving such securities and earn brokerage or other compensation
or act as a market maker in the financial instruments of the company(ies) discussed herein or act as an advisor or lender/borrower to such company(ies) or may have any other potential conflict of interests with
respect to any recommendation and other related information and opinions.; however the same shall have no bearing whatsoever on the specific recommendations made by the analyst(s), as the recommendations
made by the analyst(s) are completely independent of the views of the affiliates of MOSt even though there might exist an inherent conflict of interest in some of the stocks mentioned in the research report
Reports based on technical and derivative analysis center on studying charts company's price movement, outstanding positions and trading volume, as opposed to focusing on a company's fundamentals and, as
such, may not match with a report on a company's fundamental analysis. In addition MOST has different business segments / Divisions with independent research separated by Chinese walls catering to different set
of customers having various objectives, risk profiles, investment horizon, etc, and therefore may at times have different contrary views on stocks sectors and markets.
Unauthorized disclosure, use, dissemination or copying (either whole or partial) of this information, is prohibited. The person accessing this information specifically agrees to exempt MOSt or any of its affiliates or
employees from, any and all responsibility/liability arising from such misuse and agrees not to hold MOSt or any of its affiliates or employees responsible for any such misuse and further agrees to hold MOSt or any of
its affiliates or employees free and harmless from all losses, costs, damages, expenses that may be suffered by the person accessing this information due to any errors and delays. The information contained herein is
based on publicly available data or other sources believed to be reliable. Any statements contained in this report attributed to a third party represent MOSt’s interpretation of the data, information and/or opinions
provided by that third party either publicly or through a subscription service, and such use and interpretation have not been reviewed by the third party. This Report is not intended to be a complete statement or
summary of the securities, markets or developments referred to in the document. While we would endeavor to update the information herein on reasonable basis, MOSt and/or its affiliates are under no obligation to
update the information. Also there may be regulatory, compliance, or other reasons that may prevent MOSt and/or its affiliates from doing so. MOSt or any of its affiliates or employees shall not be in any way
responsible and liable for any loss or damage that may arise to any person from any inadvertent error in the information contained in this report. MOSt or any of its affiliates or employees do not provide, at any time,
any express or implied warranty of any kind, regarding any matter pertaining to this report, including without limitation the implied warranties of merchantability, fitness for a particular purpose, and non-infringement.
The recipients of this report should rely on their own investigations.
This report is intended for distribution to institutional investors. Recipients who are not institutional investors should seek advice of their independent financial advisor prior to taking any investment decision based on
this report or for any necessary explanation of its contents.
Most and it’s associates may have managed or co-managed public offering of securities, may have received compensation for investment banking or merchant banking or brokerage services, may have received any
compensation for products or services other than investment banking or merchant banking or brokerage services from the subject company in the past 12 months.
Most and it’s associates have not received any compensation or other benefits from the subject company or third party in connection with the research report.
Subject Company may have been a client of Most or its associates during twelve months preceding the date of distribution of the research report
MOSt and/or its affiliates and/or employees may have interests/positions, financial or otherwise of over 1 % at the end of the month immediately preceding the date of publication of the research in the securities
mentioned in this report. To enhance transparency, MOSt has incorporated a Disclosure of Interest Statement in this document. This should, however, not be treated as endorsement of the views expressed in the
report.
Motilal Oswal Securities Limited is under the process of seeking registration under SEBI (Research Analyst) Regulations, 2014.
There are no material disciplinary action that been taken by any regulatory authority impacting equity research analysis activities
Analyst Certification
The views expressed in this research report accurately reflect the personal views of the analyst(s) about the subject securities or issues, and no part of the compensation of the research analyst(s) was, is, or will be
directly or indirectly related to the specific recommendations and views expressed by research analyst(s) in this report. The research analysts, strategists, or research associates principally responsible for preparation
of MOSt research receive compensation based upon various factors, including quality of research, investor client feedback, stock picking, competitive factors and firm revenues
Disclosure of Interest Statement
§
Analyst ownership of the stock
§
Served as an officer, director or employee
TVS MOTOR CO LTD
No
No
Disclosures
TVS Motor Company
Regional Disclosures (outside India)
For U.S.
This report is not directed or intended for distribution to or use by any person or entity resident in a state, country or any jurisdiction, where such distribution, publication, availability or use would be contrary to law,
regulation or which would subject MOSt & its group companies to registration or licensing requirements within such jurisdictions.
Motilal Oswal Securities Limited (MOSL) is not a registered broker - dealer under the U.S. Securities Exchange Act of 1934, as amended (the"1934 act") and under applicable state laws in the United States. In
addition MOSL is not a registered investment adviser under the U.S. Investment Advisers Act of 1940, as amended (the "Advisers Act" and together with the 1934 Act, the "Acts), and under applicable state laws in the
United States. Accordingly, in the absence of specific exemption under the Acts, any brokerage and investment services provided by MOSL, including the products and services described herein are not available to or
intended for U.S. persons.
This report is intended for distribution only to "Major Institutional Investors" as defined by Rule 15a-6(b)(4) of the Exchange Act and interpretations thereof by SEC (henceforth referred to as "major institutional
investors"). This document must not be acted on or relied on by persons who are not major institutional investors. Any investment or investment activity to which this document relates is only available to major
institutional investors and will be engaged in only with major institutional investors. In reliance on the exemption from registration provided by Rule 15a-6 of the U.S. Securities Exchange Act of 1934, as amended (the
"Exchange Act") and interpretations thereof by the U.S. Securities and Exchange Commission ("SEC") in order to conduct business with Institutional Investors based in the U.S., MOSL has entered into a chaperoning
agreement with a U.S. registered broker-dealer, Motilal Oswal Securities International Private Limited. ("MOSIPL"). Any business interaction pursuant to this report will have to be executed within the provisions of this
chaperoning agreement.
The Research Analysts contributing to the report may not be registered /qualified as research analyst with FINRA. Such research analyst may not be associated persons of the U.S. registered broker-dealer, MOSIPL,
and therefore, may not be subject to NASD rule 2711 and NYSE Rule 472 restrictions on communication with a subject company, public appearances and trading securities held by a research analyst account.
Motilal Oswal Capital Markets Singapore Pte Limited is acting as an exempt financial advisor under section 23(1)(f) of the Financial Advisers Act(FAA) read with regulation 17(1)(d) of the Financial Advisors
Regulations and is a subsidiary of Motilal Oswal Securities Limited in India. This research is distributed in Singapore by Motilal Oswal Capital Markets Singapore Pte Limited and it is only directed in Singapore to
accredited investors, as defined in the Financial Advisers Regulations and the Securities and Futures Act (Chapter 289), as amended from time to time.
In respect of any matter arising from or in connection with the research you could contact the following representatives of Motilal Oswal Capital Markets Singapore Pte Limited:
Anosh Koppikar
Kadambari Balachandran
Email : anosh.Koppikar@motilaloswal.com
Email : kadambari.balachandran@motilaloswal.com
Contact : (+65)68189232
Contact : (+65) 68189233 / 65249115
Office Address : 21 (Suite 31),16 Collyer Quay,Singapore 04931
For Singapore
3 February 2015
Motilal Oswal Securities Ltd
Motilal Oswal Tower, Level 9, Sayani Road, Prabhadevi, Mumbai 400 025
Phone: +91 22 3982 5500 E-mail: reports@motilaloswal.com
12