Sector Update | 4 February 2015
Technology
CTSH 4QCY14: Outlook of 14.5% CY15 CC organic growth
Could mean low-teens growth outlook by NASSCOM for FY16
4QCY14 organic revenue ahead of guidance:
CTSH’s 4QCY14 revenue grew 6.2%
QoQ to USD2.74b. This included ~USD81m from integration of TriZetto acquisition.
Excluding the same, organic revenue grew 4.2% QoQ in constant currency and 3.1%
after 110bp impact from cross currency, bettering the guidance of 1.1-2.3% QoQ.
Full year revenues grew 16.1% to USD10.26b. Excluding TriZetto, organic revenue
growth was 15.1%.
CY15 guidance of 14.5% CC organic revenue growth:
CTSH guided for CY15 revenue
growth of ‘at least’ 19%. However, adjusting for mid-single digit growth of the
acquired entity TriZetto, organic growth guidance translates to ~12.5%. This embeds
~2pp adverse impact from depreciation of global currencies. That implies organic
constant currency revenue growth guidance for CY15 of at least ~14.5%.
Flat-to-modestly-up IT budgets:
CTSH not seeing budgets declining on an overall
basis. Client budgets are flat-to-marginally up overall – in line with Gartner’s
prediction of ~2.5% increase. However, there is a clear shift within budgets.
Pressure on organizations is to get more done despite the modest increases by
driving efficiencies and effectiveness. The savings are increasingly getting invested
towards running different.
Europe macro concern is an opportunity:
The concern around macro situation in
Europe is catalyzing the environment for traditional outsourcing. Window for
outsourcing is very active right now, and the structural shift towards traditional and
multi-service large deals continues.
Low-teens growth outlook for FY16 by NASSCOM?
For FY15, NASSCOM had guided
for 13-15% growth at the beginning of the year, which was 2pp below CTSH’s
organic growth guidance of at least 16%. The gap has come down over the years.
Sticking to the trend of last couple of years would hint at low-teens FY16 CC growth
outlook for Indian IT by NASSCOM. While that does not make a case for significant
upsides, differences in execution / valuation continue to drive our bottom-up
approach to stock preferences. We prefer HCLT, INFO and TECHM in tier-I IT.
Exhibit 1: Comparative Valuation
Company
TCS
Infosys
Wipro
HCL Tech
TechM
Cognizant
Tier-I Agg
Mkt cap Rating TP (INR) Upside
EPS (INR)
P/E (x)
RoE (%)
(USD b)
(%)
FY15E FY16E FY17E FY15E FY16E FY17E FY15E FY16E
79.6 Neutral 2650
5.4
108.4 125.8 147.2 23.2
20.0
17.1
35.2
34.0
39.6
Buy
2500
16.7
108.7 120.1 137.8 19.7
17.8
15.5
26.2
24.8
24.6 Neutral
640
3.6
35.0
37.8
42.6
17.7
16.3
14.5
24.8
24.3
21.7
Buy
2150
13.1
105.5 117.0 132.5 18.0
16.2
14.3
33.3
30.7
10.8
Buy
3200
12.1
132.3 168.2 199.9 21.6
17.0
14.3
27.4
27.2
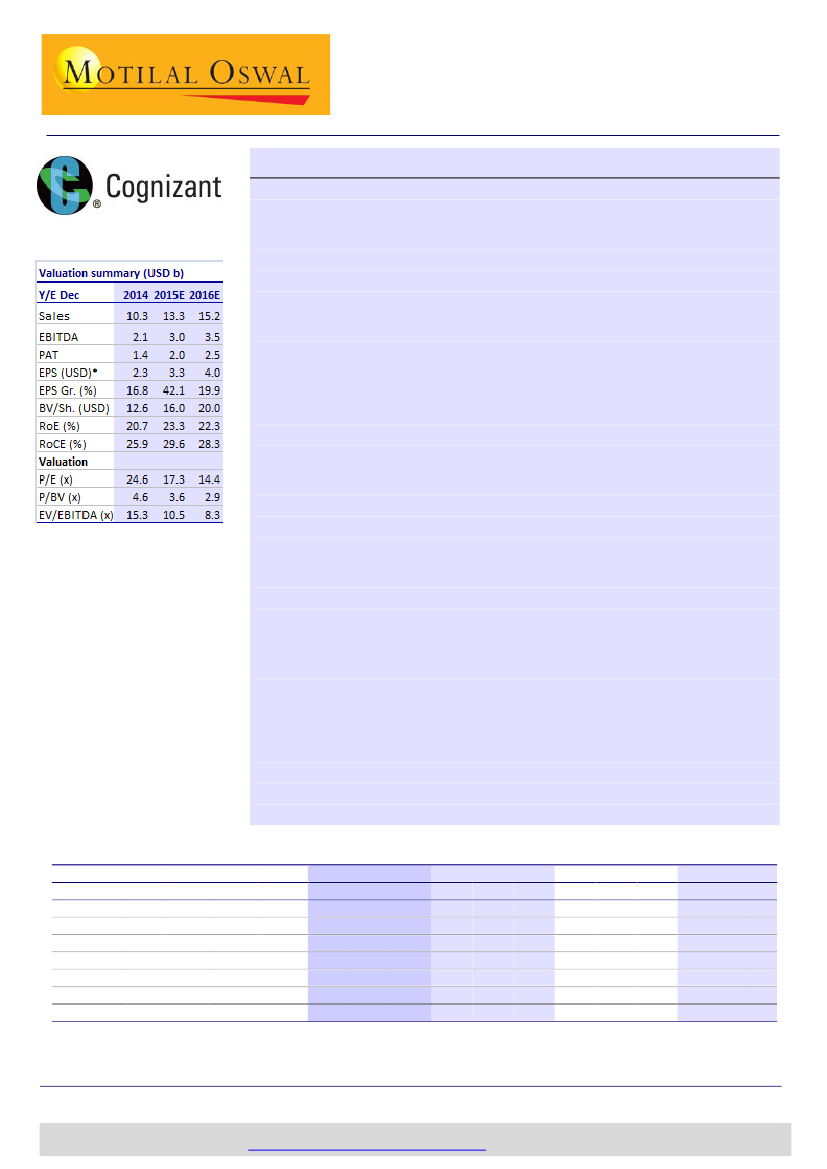
33.7 Not Rated
2.3
3.3
4.0
23.5
16.5
13.8
20.7
23.3
209.9
20.6
17.3 14.9
27.9
27.4
FY17E
32.7
24.6
23.1
29.2
26.3
22.3
26.4
Source: Company, MOSL
FY15-17E CAGR (%)
USD rev. EPS
13.7
16.5
12.3
12.6
11.4
10.3
14.4
12.0
21.2
22.9
21.8
30.5
Ashish Chopra
(Ashish.Chopra@MotilalOswal.com); +91 22 3982 5424
Siddharth Vora
(Siddharth.Vora@MotilalOswal.com); +91 22 3982 5585
4 February 2015
Investors are advised to refer through disclosures made at the end of the Research Report.
1
Motilal Oswal research is available on
www.motilaloswal.com/Institutional-Equities,
Bloomberg, Thomson Reuters, Factset and S&P Capital.