10 February 2015
3QFY15 Results Update | Sector:
Metals
Nalco
BSE SENSEX
28,356
Bloomberg
Equity Shares (m)
52-Week Range (INR)
1, 6, 12 Rel. Per (%)
Free float (%)
S&P CNX
8,566
NACL IN
2,577.2
69/32
-5/-24/11
19.1
CMP: INR50
TP: INR87 (+74%)
Buy
Strong operating performance; valuations compelling
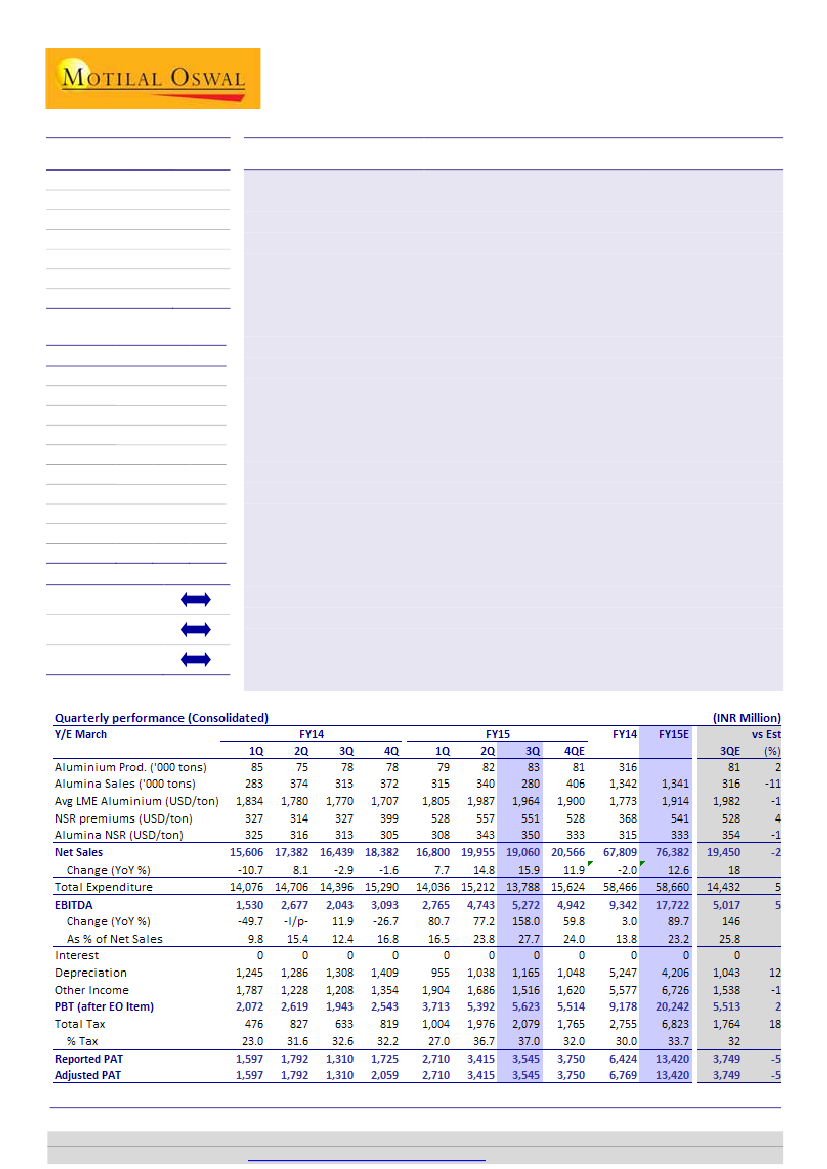
EBITDA grew 11% QoQ to INR5.25b, 5% ahead of our estimate on lower raw material
and seasonally lower coal cost, despite lower than expected alumina exports (at 280kt,
11% miss).
n
Sales down 4% on lower alumina volumes:
Net sales declined 4% QoQ to
INR19.1b, driven by lower alumina volumes. Alumina production was down 6%
QoQ to 460kt, but sales volumes declined 18% QoQ to 280kt, as the Hudhud
cyclone disrupted dispatches in mid-October. Aluminum sales grew 1% QoQ (5%
YoY) to 82kt. Alumina realization grew 2% QoQ to USD350/ton, while aluminum
realization was down 1% QoQ to USD2,515/ton.
n
Strong EBITDA performance on lower CoP:
Despite weak sales, EBITDA grew 11%
QoQ (1.5x YoY) to INR5.2b. Raw material cost as a percentage of sales declined
250bp QoQ, while power and fuel cost was down 50bp QoQ. Caustic soda and
carbon cost are declining. We believe seasonally lower coal cost drove EBITDA
beat.
n
Higher tax rate, depreciation dragged PAT growth:
PAT growth was slower at 4%
QoQ to INR3.5b (5% miss), driven by higher than expected tax rate (37% v/s our
estimate of 32%) and increase in depreciation cost (+12% QoQ).
n
Valuations compelling:
The stock is currently trading at an EV of 2.1x FY16E
EBITDA (LME at USD2,000/ton), which we believe is significantly cheap compared
to Metals peers. Even at spot LME aluminum of USD1,850/ton, the stock would
trade at 3.1x. We value NACL at INR87 (LME: USD2,000/ton, 75% upside). We
believe alumina prices will inch up, as China depletes bauxite inventories and start
boosting imports gradually over 2015 and 2016. LME prices too will be supported
by higher cost of production. Reiterate
Buy.
M.Cap. (INR b) / (USD b) 128.9/2.1
Avg Val (INRm)/Vol ‘000 163/2,983
Financials & Valuation (INR Billion)
Y/E MAR
Sales
EBITDA
NP
Adj. EPS (INR)
EPS Gr(%)
BV/Sh. (INR)
RoE (%)
RoCE (%)
P/E (x)
EV/EBITDA (x)
2015E 2016E 2017E
77.3
18.7
14.1
5.5
107.7
50.7
11.2
15.7
9.2
3.3
86.3
22.8
17.3
6.7
22.8
55.7
12.6
17.4
7.5
2.1
88.3
23.0
17.4
6.7
0.5
60.7
11.6
16.1
7.4
1.5
Estimate change
TP change
Rating change
Sanjay Jain
(SanjayJain@MotilalOswal.com); +91 22 3982 5412
Dhruv Muchhal
(Dhruv.Muchhal@MotilalOswal.com); +91 22 3027 8033
Investors are advised to refer through disclosures made at the end of the Research Report.
Motilal Oswal research is available on
www.motilaloswal.com/Institutional-Equities,
Bloomberg, Thomson Reuters, Factset and S&P Capital.

Nalco
3Q results review
Operationally better on lower raw material/coal costs
n
n
n
n
n
Net sales were down 4% QoQ (+16% YoY) to INR19.1b, a miss of 2% to our
estimate. QoQ decline in sales was driven by lower alumina sales (down 18%
QoQ) due to impact of Hudhud cyclone in mid-Oct.
Alumina production was down 6% QoQ (-1% YoY) to 460kt but sales declined
18% QoQ to 280 kt (our estimate 316 kt) due to increase in inventories courtesy
supply chain disruption because of Hudhud cyclone in mid-Oct. Aluminum sales
volumes were up 1% QoQ (5% YoY) to 82kt (our estimate 81kt).
All-in-aluminum realization at USD2,515 (-1% QoQ) was broadly in line with our
estimate. Alumina realization was up 2% QoQ to USD350/t, but lower than our
estimate of USD354/t.
Despite lower sales, EBITDA grew 11% QoQ (1.5x YoY) to INR5.3b (and 5% ahead
of our estimate) driven by lower raw material and coal cost. Raw material cost
as percent of sales declined 250bps QoQ, while power and fuel cost was down
50bps QoQ. Caustic soda and carbon cost are on decline. Expected benefit of
seasonally lower coal cost drove EBITDA beat.
PAT growth was however slow at just 4% QoQ (1.7x YoY) to INR3.5b on account
of (a) higher depreciation charge (b) lower other income, down 10% QoQ (+26%
YoY) to INR1.5b and (c) increase in tax rate to 37% (our estimate 32%).
Aluminum production grew
1% QoQ (+6% YoY) to 83kt.
Exhibit 1: Quarterly aluminum and alumina production (kt)
Alumina
102
532
100
98
482
85
398
397
75
78
78
79
479
499
465
477
487
460
82
83
Aluminium
2QFY13 3QFY13 4QFY13 1QFY14 2QFY14 3QFY14 4QFY14 1QFY15 2QFY15 3QFY15
Source: MOSL, Company
Aluminum realization was
down 1% QoQ while
Alumina was up 2% QoQ.
Premium on aluminum was
down by ~1% QoQ to
USD551/t.
Exhibit 2: Quarterly aluminum/alumina realization trend – USD/t
Alumina
2,313
2,332
Aluminium
2,333
2,544
2,515
2,161
2,094
2,097
2,106
328
3QFY13
341
4QFY13
325
1QFY14
316
2QFY14
313
3QFY14
305
4QFY14
308
1QFY15
343
2QFY15
350
3QFY15
Source: MOSL, Company
10 February 2015
2

Nalco
Exhibit 3: Alumina division EBIT – INR/t
11,055
8,517
5,508
4,088
5,487
4,266
5,761
5,563
4,587
3QFY13
4QFY13
1QFY14
2QFY14
3QFY14
4QFY14
1QFY15
2QFY15
3QFY15
Source: MOSL, MOSL, Company
Exhibit 4: Aluminum division EBIT – INR/t
21,425
17,720
7,263
1,794
(2,113)
3QFY14
(5,590)
4QFY14
1QFY15
2QFY15
3QFY15
14,976
(2,672)
3QFY13
4QFY13
1QFY14
(2,980)
2QFY14
Source: MOSL, Company
Valuations are compelling
TP: INR87, upside: 74%; Maintain Buy
Nalco is currently trading at 2.1x FY16E EV/EBIDTA (LME at USD2,000) which we
believe is significantly cheap considering long term average multiple of 6.0x. With (a)
Under-utilized smelting capacity – currently operating at <70% utilization (b) healthy
balance sheet – cash balance of INR21/share at the end of FY14 (c) our positive
outlook for aluminum and alumina and (c) Potential to secure coal block at
affordable price through direct coal block allocation by the government, we believe
the discount to the long term average multiples is unjustified. Even at spot LME
aluminum of USD1,850 our derived value per share of INR71 implies an upside
potential of 43% and FY16 EV/EBITDA of 3.1x. Every USD100/t decline in LME
aluminum impacts our FY16E EBITDA by 16% and our implied value by 12%. We
value Nalco at 6x FY16E EV/EBITDA with a 12m TP of INR87. Re-iterate
Buy.
Key catalyst over the next 12 months
n
Higher LME as supply deficit (ex-China) widens.
n
Improving domestic coal availability.
n
Alumina prices
10 February 2015
3

Nalco
Key risks
n
Slowing demand in China.
n
Removal of export tax on primary aluminum exports from China.
n
Further decline in global coal prices, with no pass-on effect on Indian coal prices.
Exhibit 5: Target price derivation
EBITDA
EV/EBITDA (x)
Target EV
add: CWIP
add: cash surplus
Equity Value
Target Price (INR/share)
Key Assumption
USD/INR rate
LME (USD/t)
FY13
9,069
FY14
9,342
FY15
18,665
6.5
121,322
6,687
67,597
195,606
76
61.0
1,939
FY16
22,850
6.0
137,097
6,687
79,749
223,534
87
FY17
23,004
6.0
138,025
6,687
95,309
240,021
93
10,019
49,944
7,687
52,933
54.5
1,975
60.5
1,773
62.0
62.0
2,000
2,000
Source: MOSL, Company
Exhibit 6: Metals sector valuation
Rating
Steel
Tata Steel
SAIL
JSW Steel
JSPL
NMDC
Non-Ferrous
Hindalco
SSLT
Hindustan Zinc
Nalco
Buy
Neutral
Buy
Neutral
Buy
Buy
Buy
Buy
Buy
Price MCAP
EPS
(INR) (USD M) FY14E FY15E FY16E
358
70
938
143
140
149
206
178
50
5,602
4,642
3,657
2,104
8,941
4,968
9,865
12,124
2,057
35.5
4.6
38.6
20.9
16.1
12.5
17.2
16.3
2.6
19.7
6.3
95.5
9.5
17.2
13.7
20.6
20.4
5.5
44.4
5.6
81.6
3.8
14.9
15.1
18.9
18.8
6.7
P/E (x)
FY15E FY16E
18.2
11.0
9.8
15.0
8.1
10.9
10.0
8.7
9.1
8.1
12.5
11.5
37.2
9.4
9.9
10.9
9.5
7.4
EV/EBITDA (x)
FY15E FY16E
7.5
8.7
6.4
8.8
4.3
8.0
6.3
5.5
3.2
6.6
7.8
6.6
9.1
5.2
P/B(x)
FY14E FY15E
1.4
0.7
1.0
0.6
1.8
1.1
0.6
1.0
0.6
1.7
6.7
1.3
1.2
5.8
0.8
0.8
4.6
1.6
1.4
2.1
1.0
0.9
Source: MOSL, Company
10 February 2015
4

Nalco
Story in charts
Exhibit 7: Operating Ali at sub 70% utilization
Aluminum
108%
96%
84%
72%
60%
FY11
FY12
FY13
FY14
FY15E
FY16E
FY17E
1,556
1,687
1,802
1,925
1,984
Alumina
444
413
Exhibit 8: We model only marginal production growth (kt)
Alumina
403
316
325
341
2,160
358
2,160
Aluminum
Source: MOSL, Company
Exhibit 9: LME inventories have been declining..
2,200
2,000
1,800
1,600
Inventories (RHS)
Spot
5.3
4.9
4.5
4.1
3.7
Exhibit 10: ..while spot premiums are higher (USd/t)
565
490
415
340
265
190
115
40
Aluminium
Zinc
Copper
Source: MOSL, Company
Exhibit 11: Alumina well supported – USD/t
440
400
360
320
280
240
Exhibit 12: High ROIC generation
35
30
25
20
15
10
5
0
FY11
FY12
FY13
FY14
FY15E
FY16E
FY17E
RoE (%)
RoIC (%)
Source: MOSL, Company
10 February 2015
5

Nalco
Financials and valuations
Income Statement
Y/E March
Net Sales
Change (%)
Total Expenses
EBITDA
% of Net Sales
Depn. & Amortization
EBIT
Net Interest
Other income
PBT before EO
EO income
PBT after EO
Current tax
Deffered tax
Tax
Rate (%)
Reported PAT
Adjusted PAT
Change (%)
2010
50,557
-0.8
40,635
9,922
19.6
3,194
6,728
23
4,688
11,392
156
11,549
3,014
393
3,406
29.5
8,142
8,032
-36.3
2011
59,590
17.9
44,558
15,032
25.2
4,301
10,732
1
4,530
15,261
-14
15,247
4,225
329
4,554
29.9
10,693
10,703
33.2
2012
66,116
11.0
54,667
11,449
17.3
4,666
6,784
9
5,422
12,197
-219
11,978
1,926
1,557
3,483
29.1
8,495
8,650
-19.2
2013
69,165
4.6
60,096
9,069
13.1
5,054
4,014
75
5,111
9,050
0
9,050
2,582
540
3,122
34.5
5,928
5,928
-31.5
2014
67,809
-2.0
58,466
9,342
13.8
5,247
4,095
0
5,577
9,672
-494
9,178
2,755
0
2,755
30.0
6,424
6,769
14.2
2015E
77,325
14.0
58,660
18,665
24.1
4,206
14,459
0
6,726
21,185
0
21,185
7,125
0
7,125
33.6
14,061
14,061
107.7
2016E
86,294
11.6
63,444
22,850
26.5
4,245
18,605
0
6,793
25,398
0
25,398
8,127
0
8,127
32.0
17,271
17,271
22.8
(INR Million)
2017E
88,265
2.3
65,261
23,004
26.1
4,330
18,674
0
6,861
25,535
0
25,535
8,171
0
8,171
32.0
17,364
17,364
0.5
Balance Sheet
Y/E March
Share Capital
Reserves
Net Worth
Minority Interest
Total Loans
Deferred Tax Liability
Capital Employed
Gross Block
Less: Accum. Deprn.
Net Fixed Assets
Capital WIP
Investments
Curr. Assets
Inventories
Account Receivables
Cash and Bank Balance
Others
Curr. Liability & Prov.
Account Payables
Provisions & Others
Net Curr. Assets
Appl. of Funds
E: MOSL Estimates
2010
6,443
97,513
103,956
0
6,606
110,562
110,180
61,817
48,363
22,434
9,868
52,096
9,449
1,818
31,524
9,306
22,199
18,500
3,700
29,897
110,562
2011
12,886
98,760
111,646
149
6,935
118,730
120,762
65,826
54,935
17,435
13,317
60,452
10,585
1,124
37,952
10,791
27,410
23,545
3,865
33,042
118,730
2012
12,886
104,265
117,151
0
8,491
125,642
136,586
70,463
66,124
6,844
7,543
74,697
12,127
1,381
41,684
19,506
29,566
26,733
2,833
45,131
125,642
2013
12,886
106,438
119,325
0
9,031
128,356
141,750
75,461
66,289
10,019
14,901
72,061
13,806
1,430
35,044
21,781
34,914
31,201
3,713
37,147
128,356
2014
12,886
108,338
121,225
0
9,101
130,326
148,581
80,662
67,919
7,687
12,450
77,428
11,737
2,436
40,483
22,773
35,159
31,505
3,655
42,269
130,326
2015E
12,886
117,876
130,762
0
9,101
139,863
154,581
84,868
69,714
6,687
12,450
92,986
13,294
1,772
55,147
22,773
41,974
38,319
3,655
51,012
139,863
2016E
12,886
130,624
143,510
0
9,101
152,611
159,581
89,112
70,469
6,687
12,450
105,991
13,872
2,047
67,299
22,773
42,986
39,331
3,655
63,004
152,611
(INR Million)
2017E
12,886
143,465
156,351
0
9,101
165,452
164,581
93,442
71,139
6,687
12,450
124,746
16,460
2,655
82,858
22,773
49,570
45,916
3,655
75,176
165,452
10 February 2015
6

Nalco
Financials and valuations
Ratios
Y/E March
Basic (INR)
EPS
Cash EPS
BV/Share
DPS
Payout (%)
Valuation (x)
P/E
Cash P/E
P/BV
EV/Sales
EV/EBITDA
Dividend Yield (%)
Return Ratios (%)
EBITDA Margins (%)
Net Profit Margins (%)
RoE
RoCE (pre-tax)
RoIC (pre-tax)
Working Capital Ratios
Fixed Asset Turnover (x)
Asset Turnover (x)
Debtor (Days)
Inventory (Days)
Working Capital Turnover (Days)
Leverage Ratio (x)
Current Ratio
2010
3.1
4.4
40.3
0.6
23.1
16.0
11.4
1.2
1.9
9.8
1.3
19.6
15.9
8.0
10.6
16.0
0.5
0.5
13
68
(3)
2.3
25.2
18.0
9.9
13.3
22.2
0.5
0.5
7
65
(8)
2.2
2011
4.2
5.8
43.3
1.0
28.1
2012
3.4
5.1
45.5
1.4
48.9
14.9
9.8
1.1
1.2
7.0
2.8
17.3
13.1
7.6
10.0
11.3
0.5
0.5
8
67
5
2.5
2013
2.3
4.3
46.3
1.3
63.6
21.7
11.7
1.1
1.1
8.7
2.5
13.1
8.6
5.0
7.2
5.8
0.5
0.5
8
73
3
2.1
2014
2.6
4.5
47.0
1.5
70.4
19.0
11.0
1.1
1.1
8.1
3.0
13.8
10.0
5.6
7.5
5.9
0.5
0.5
13
63
3
2.2
2015E
5.5
7.1
50.7
1.5
32.2
9.2
7.1
1.0
0.8
3.3
3.0
24.1
18.2
11.2
15.7
21.4
0.5
0.6
8
63
(5)
2.2
2016E
6.7
8.3
55.7
1.5
26.2
7.5
6.0
0.9
0.6
2.1
3.0
26.5
20.0
12.6
17.4
28.2
0.5
0.6
9
59
(5)
2.5
2017E
6.7
8.4
60.7
1.5
26.0
7.4
5.9
0.8
0.4
1.5
3.0
26.1
19.7
11.6
16.1
28.8
0.5
0.5
11
68
(9)
2.5
Cashflow Statement
Y/E March
Pre-tax profit
Depreciation
(Inc)/Dec in Wkg. Cap.
Tax paid
Other operating activities
CF from Op. Activity
(Inc)/Dec in FA + CWIP
FCF
(Pur)/Sale of Investments
CF from Inv. Activity
Debt raised/(repaid)
Dividend (incl. tax)
CF from Fin. Activity
(Inc)/Dec in Cash
Add: opening Balance
Closing Balance
E: MOSL Estimates
2010
11,549
3,194
-1,108
-3,014
-50
10,570
-4,944
5,626
-908
-5,852
0
-1,885
-1,885
2,833
28,690
31,523
2011
15,247
4,301
3,284
-4,225
-6,734
11,872
-5,583
6,289
-3,449
-9,032
149
-3,003
3,589
6,429
31,524
37,952
2012
11,978
4,666
-8,358
-1,926
3,969
10,328
-5,234
5,094
5,774
-2,293
-149
-4,156
-4,304
3,731
37,952
41,683
2013
9,050
5,054
2,740
-2,582
-1,436
12,826
-8,338
4,488
-7,358
-15,696
0
-3,769
-3,769
-6,640
41,684
35,044
2014
9,178
5,247
1,368
-2,755
-1,027
12,012
-4,500
7,512
2,450
-2,050
0
-4,523
-4,523
5,439
35,044
40,483
2015E
21,185
4,206
5,921
-7,125
0
24,187
-5,000
19,187
0
-5,000
0
-4,523
-4,523
14,664
40,483
55,147
2016E
25,398
4,245
159
-8,127
0
21,675
-5,000
16,675
0
-5,000
0
-4,523
-4,523
12,152
55,147
67,299
(INR Million)
2017E
25,535
4,330
3,388
-8,171
0
25,083
-5,000
20,083
0
-5,000
0
-4,523
-4,523
15,560
67,299
82,858
10 February 2015
7

Nalco
Corporate profile: Nalco
Company description
National Aluminium Company (Bloomberg: NACL) is
a fully integrated producer of aluminum and
alumina. Aluminum contributes ~70% and alumina
~30% of revenues. Its aluminum smelter (460ktpa)
sources alumina and power from its captive
refinery in Damanjodi and captive power plant
(CPP) located in Angul respectively. Coal for power
generation is sourced from the state-owned Coal
India; hence, the cost of power generated is low.
The alumina refinery, which has a capacity of
2.1mtpa, is located in Damanjodi (Orissa), close to
captive bauxite mines at Panchpatmalli. Bauxite
from these mines is of superior quality and
consumes low energy in the crushing and digestion
process during conversion to alumina.
Exhibit 13: Sensex rebased
Exhibit 14: Shareholding pattern (%)
Dec-14
Promoter
DII
FII
Others
80.9
9.5
3.8
5.8
Sep-14
80.9
9.4
3.9
5.8
Dec-13
81.1
10.2
4.1
4.7
Exhibit 15: Top holders
Holder Name
LIC of India
Bajaj Allianz Life Insurance Company Ltd
Hindalco Industries Ltd
% Holding
6.0
1.3
1.1
Note: FII Includes depository receipts
Exhibit 16: Top management
Name
Ansuman Das
Designation
Chairman & Managing Director
Exhibit 17: Directors
Name
Ansuman Das
K C Samal
Soma Mondal
S C Padhy
S S Mahapatra
V Balasubramanyam
N R Mohanty
Name
Sanjiv Batra*
Qaiser Shamim*
Madhukar Gupta*
Ghanshyam Hiralal Amin*
D S Mishra
R Sridharan
Niranjan Kumar Singh
*Independent
Exhibit 18: Auditors
Name
ABP & Associates
Agasti & Associates
D S Mishra & Associates
S Dhal & Co
Type
Statutory
Statutory
Secretarial Audit
Cost Auditor
Exhibit 19: MOSL forecast v/s consensus
EPS
(INR)
FY15
FY16
FY17
MOSL
forecast
5.5
6.7
6.7
Consensus
forecast
4.2
4.6
4.7
Variation
(%)
31.1
46.6
43.6
10 February 2015
8

Nalco
NOTES
10 February 2015
9

This document has been prepared by Motilal Oswal Securities Limited (hereinafter referred to as Most) to provide information about the company(ies) and/sector(s), if any, covered in the report and may be
distributed by it and/or its affiliated company(ies). This report is for personal information of the selected recipient/s and does not construe to be any investment, legal or taxation advice to you. This research report does
not constitute an offer, invitation or inducement to invest in securities or other investments and Motilal Oswal Securities Limited (hereinafter referred as MOSt) is not soliciting any action based upon it. This report is not
for public distribution and has been furnished to you solely for your general information and should not be reproduced or redistributed to any other person in any form. This report does not constitute a personal
recommendation or take into account the particular investment objectives, financial situations, or needs of individual clients. Before acting on any advice or recommendation in this material, investors should consider
whether it is suitable for their particular circumstances and, if necessary, seek professional advice. The price and value of the investments referred to in this material and the income from them may go down as well as
up, and investors may realize losses on any investments. Past performance is not a guide for future performance, future returns are not guaranteed and a loss of original capital may occur.
MOSt and its affiliates are a full-service, integrated investment banking, investment management, brokerage and financing group. We and our affiliates have investment banking and other business relationships with a
some companies covered by our Research Department. Our research professionals may provide input into our investment banking and other business selection processes. Investors should assume that MOSt and/or
its affiliates are seeking or will seek investment banking or other business from the company or companies that are the subject of this material and that the research professionals who were involved in preparing this
material may educate investors on investments in such business. The research professionals responsible for the preparation of this document may interact with trading desk personnel, sales personnel and other
parties for the purpose of gathering, applying and interpreting information. Our research professionals are paid on the profitability of MOSt which may include earnings from investment banking and other business.
MOSt generally prohibits its analysts, persons reporting to analysts, and members of their households from maintaining a financial interest in the securities or derivatives of any companies that the analysts cover.
Additionally, MOSt generally prohibits its analysts and persons reporting to analysts from serving as an officer, director, or advisory board member of any companies that the analysts cover. Our salespeople, traders,
and other professionals or affiliates may provide oral or written market commentary or trading strategies to our clients that reflect opinions that are contrary to the opinions expressed herein, and our proprietary
trading and investing businesses may make investment decisions that are inconsistent with the recommendations expressed herein. In reviewing these materials, you should be aware that any or all of the foregoing
among other things, may give rise to real or potential conflicts of interest. MOSt and its affiliated company(ies), their directors and employees and their relatives may; (a) from time to time, have a long or short position
in, act as principal in, and buy or sell the securities or derivatives thereof of companies mentioned herein. (b) be engaged in any other transaction involving such securities and earn brokerage or other compensation
or act as a market maker in the financial instruments of the company(ies) discussed herein or act as an advisor or lender/borrower to such company(ies) or may have any other potential conflict of interests with
respect to any recommendation and other related information and opinions.; however the same shall have no bearing whatsoever on the specific recommendations made by the analyst(s), as the recommendations
made by the analyst(s) are completely independent of the views of the affiliates of MOSt even though there might exist an inherent conflict of interest in some of the stocks mentioned in the research report
Reports based on technical and derivative analysis center on studying charts company's price movement, outstanding positions and trading volume, as opposed to focusing on a company's fundamentals and, as
such, may not match with a report on a company's fundamental analysis. In addition MOST has different business segments / Divisions with independent research separated by Chinese walls catering to different set
of customers having various objectives, risk profiles, investment horizon, etc, and therefore may at times have different contrary views on stocks sectors and markets.
Unauthorized disclosure, use, dissemination or copying (either whole or partial) of this information, is prohibited. The person accessing this information specifically agrees to exempt MOSt or any of its affiliates or
employees from, any and all responsibility/liability arising from such misuse and agrees not to hold MOSt or any of its affiliates or employees responsible for any such misuse and further agrees to hold MOSt or any of
its affiliates or employees free and harmless from all losses, costs, damages, expenses that may be suffered by the person accessing this information due to any errors and delays. The information contained herein is
based on publicly available data or other sources believed to be reliable. Any statements contained in this report attributed to a third party represent MOSt’s interpretation of the data, information and/or opinions
provided by that third party either publicly or through a subscription service, and such use and interpretation have not been reviewed by the third party. This Report is not intended to be a complete statement or
summary of the securities, markets or developments referred to in the document. While we would endeavor to update the information herein on reasonable basis, MOSt and/or its affiliates are under no obligation to
update the information. Also there may be regulatory, compliance, or other reasons that may prevent MOSt and/or its affiliates from doing so. MOSt or any of its affiliates or employees shall not be in any way
responsible and liable for any loss or damage that may arise to any person from any inadvertent error in the information contained in this report. MOSt or any of its affiliates or employees do not provide, at any time,
any express or implied warranty of any kind, regarding any matter pertaining to this report, including without limitation the implied warranties of merchantability, fitness for a particular purpose, and non-infringement.
The recipients of this report should rely on their own investigations.
This report is intended for distribution to institutional investors. Recipients who are not institutional investors should seek advice of their independent financial advisor prior to taking any investment decision based on
this report or for any necessary explanation of its contents.
Most and it’s associates may have managed or co-managed public offering of securities, may have received compensation for investment banking or merchant banking or brokerage services, may have received any
compensation for products or services other than investment banking or merchant banking or brokerage services from the subject company in the past 12 months.
Most and it’s associates have not received any compensation or other benefits from the subject company or third party in connection with the research report.
Subject Company may have been a client of Most or its associates during twelve months preceding the date of distribution of the research report
MOSt and/or its affiliates and/or employees may have interests/positions, financial or otherwise of over 1 % at the end of the month immediately preceding the date of publication of the research in the securities
mentioned in this report. To enhance transparency, MOSt has incorporated a Disclosure of Interest Statement in this document. This should, however, not be treated as endorsement of the views expressed in the
report.
Motilal Oswal Securities Limited is under the process of seeking registration under SEBI (Research Analyst) Regulations, 2014.
There are no material disciplinary action that been taken by any regulatory authority impacting equity research analysis activities
Analyst Certification
The views expressed in this research report accurately reflect the personal views of the analyst(s) about the subject securities or issues, and no part of the compensation of the research analyst(s) was, is, or will be
directly or indirectly related to the specific recommendations and views expressed by research analyst(s) in this report. The research analysts, strategists, or research associates principally responsible for preparation
of MOSt research receive compensation based upon various factors, including quality of research, investor client feedback, stock picking, competitive factors and firm revenues
Disclosure of Interest Statement
§
Analyst ownership of the stock
§
Served as an officer, director or employee
NATIONAL ALUMINIUM CO
No
No
Disclosures
Nalco
Regional Disclosures (outside India)
For U.S.
This report is not directed or intended for distribution to or use by any person or entity resident in a state, country or any jurisdiction, where such distribution, publication, availability or use would be contrary to law,
regulation or which would subject MOSt & its group companies to registration or licensing requirements within such jurisdictions.
Motilal Oswal Securities Limited (MOSL) is not a registered broker - dealer under the U.S. Securities Exchange Act of 1934, as amended (the"1934 act") and under applicable state laws in the United States. In
addition MOSL is not a registered investment adviser under the U.S. Investment Advisers Act of 1940, as amended (the "Advisers Act" and together with the 1934 Act, the "Acts), and under applicable state laws in the
United States. Accordingly, in the absence of specific exemption under the Acts, any brokerage and investment services provided by MOSL, including the products and services described herein are not available to or
intended for U.S. persons.
This report is intended for distribution only to "Major Institutional Investors" as defined by Rule 15a-6(b)(4) of the Exchange Act and interpretations thereof by SEC (henceforth referred to as "major institutional
investors"). This document must not be acted on or relied on by persons who are not major institutional investors. Any investment or investment activity to which this document relates is only available to major
institutional investors and will be engaged in only with major institutional investors. In reliance on the exemption from registration provided by Rule 15a-6 of the U.S. Securities Exchange Act of 1934, as amended (the
"Exchange Act") and interpretations thereof by the U.S. Securities and Exchange Commission ("SEC") in order to conduct business with Institutional Investors based in the U.S., MOSL has entered into a chaperoning
agreement with a U.S. registered broker-dealer, Motilal Oswal Securities International Private Limited. ("MOSIPL"). Any business interaction pursuant to this report will have to be executed within the provisions of this
chaperoning agreement.
The Research Analysts contributing to the report may not be registered /qualified as research analyst with FINRA. Such research analyst may not be associated persons of the U.S. registered broker-dealer, MOSIPL,
and therefore, may not be subject to NASD rule 2711 and NYSE Rule 472 restrictions on communication with a subject company, public appearances and trading securities held by a research analyst account.
Motilal Oswal Capital Markets Singapore Pte Limited is acting as an exempt financial advisor under section 23(1)(f) of the Financial Advisers Act(FAA) read with regulation 17(1)(d) of the Financial Advisors
Regulations and is a subsidiary of Motilal Oswal Securities Limited in India. This research is distributed in Singapore by Motilal Oswal Capital Markets Singapore Pte Limited and it is only directed in Singapore to
accredited investors, as defined in the Financial Advisers Regulations and the Securities and Futures Act (Chapter 289), as amended from time to time.
In respect of any matter arising from or in connection with the research you could contact the following representatives of Motilal Oswal Capital Markets Singapore Pte Limited:
Anosh Koppikar
Kadambari Balachandran
Email : anosh.Koppikar@motilaloswal.com
Email : kadambari.balachandran@motilaloswal.com
Contact : (+65)68189232
Contact : (+65) 68189233 / 65249115
Office Address : 21 (Suite 31),16 Collyer Quay,Singapore 04931
For Singapore
10 February 2015
Motilal Oswal Securities Ltd
Motilal Oswal Tower, Level 9, Sayani Road, Prabhadevi, Mumbai 400 025
Phone: +91 22 3982 5500 E-mail: reports@motilaloswal.com
10