12 February 2015
3QFY15 Results Update | Sector:
Consumer
Bajaj Electricals
BSE SENSEX
28,805
Bloomberg
Equity Shares (m)
M.Cap.(INR b)/(USD b)
52-Week Range (INR)
1, 6, 12 Rel. Per (%)
AvgVal(INRm)/Vol ‘000
Free float (%)
S&P CNX
8,712
BJE IN
100.0
22.2/0.4
385/191
-12/-30/-45
98/362
34.4
CMP: INR222
TP: INR300 (+35%
Buy
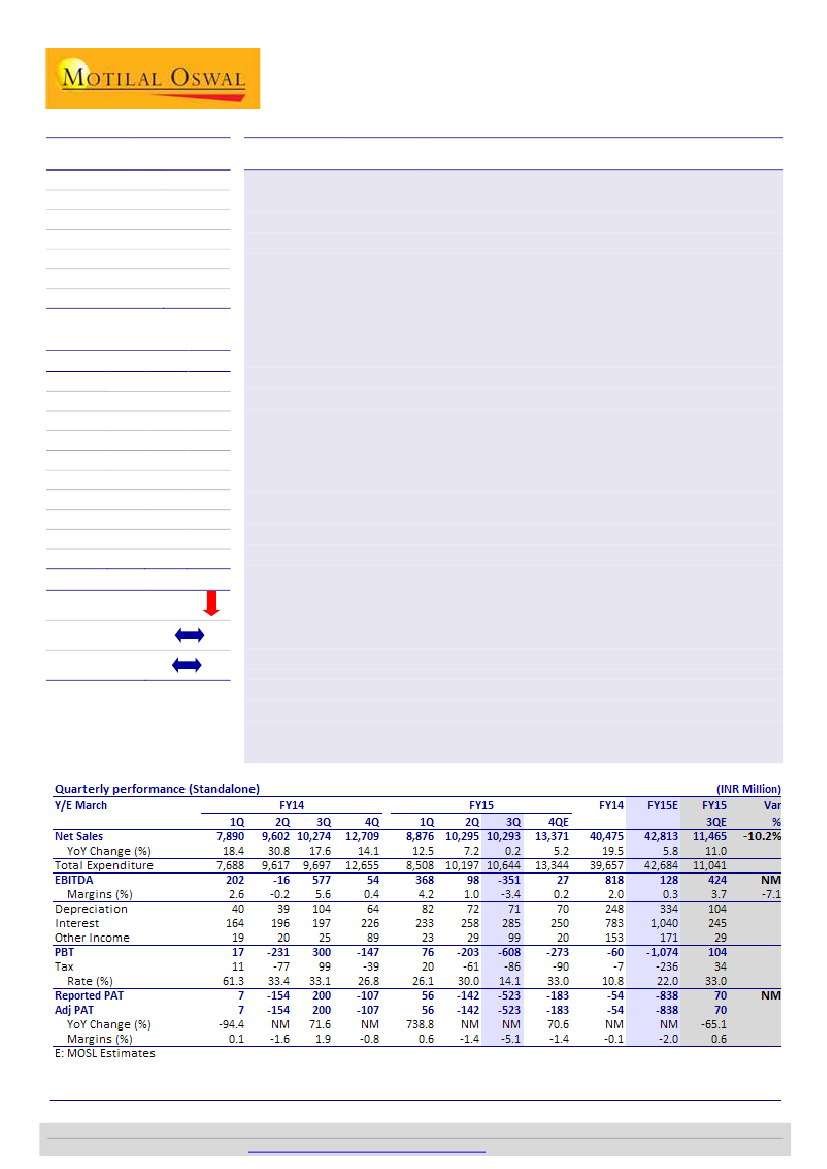
Results below expectations; E&P turnaround likely in FY16
Revenue declined 0.4% YoY to INR10.3b (our estimate: INR11.5b). EBITDA was
negative INR351m (our estimate: INR424m). EBITDA margin was -3.4% (our estimate:
3.7%) against 5.6% in 3QFY14. Lighting division margins were 4.6% against 5.2%,
Durables margins were 6.7% against 9.6%, while E&P margins were -26.2% against -
4.7%. PAT was -INR523m (our estimate: INR70m) against INR200m in 3QFY14.
Consumer and Lighting divisions report degrowth:
Lighting business degrew 6.2% YoY
to INR2.3b, while Consumer Durables degrew 2% to INR5.1b. While CFL lamps
continued to exert pressure on Lighting growth, the management is incrementally
focusing on introducing and promoting new LED products, which should offset CFL
business decline to some extent. We expect Lighting business to remain flat over FY15-
17. With the implementation of replenishment-based distribution structure, primary
sales for the Consumer division was impacted during the quarter, driving 2% YoY
degrowth. With 80% of the distribution transition likely in FY16, we expect meaningful
growth recovery in FY17 (15% growth in FY17 against 8% in FY16 and 4% in FY15).
Financials & Valuation (INR Billion)
Y/E MAR
Sales
EBITDA
NP
EPS (INR)
EPS Gr. (%)
BV/Sh.(INR)
RoE (%)
RoCE (%)
2015E 2016E 2017E
42.8
0.1
-0.8
-8.4
60.3
-12.8
-0.3
47.4
3.1
1.2
12.3
69.7
18.9
27.8
54.3
3.8
1.7
16.5
34.8
83.0
21.7
31.5
1,478 -246.4
E&P performance still under pressure, turnaround on track:
E&P revenue grew 8.9%
P/E (x)
-26.5
18.1
13.4
YoY to INR2.9b. During the quarter, BJE provided INR830m towards doubtful
P/BV (x)
3.7
3.2
2.7
receivables, which drove down margins to -26%. In 9MFY15, BJE has made provisions
of INR1.6b. With most legacy projects completed and most provisions for receivables
already made, the management expects a turnaround in FY16. We believe, with a
Estimate change
27%/14%
strong book of INR34.9b for E&P and concerted efforts by the management towards
TP change
timely execution, E&P turnaround is on track for FY16. We expect margins in the E&P
division to improve from -10% in FY15 to +5% in FY16.
Rating change
Valuation and view:
With expected delay in E&P turnaround along with worsening
growth and profitability in the core Lighting and Consumer business, we cut our EPS
estimates for FY16 and FY17 by 27% and 14%, respectively. Maintain
Buy.
Our target
price is INR300 (18x FY17E EPS of INR16.5).
Atul Mehra
(Atul.Mehra@MotilalOswal.com); +91 22 3982 5417
Niket Shah
(Niket.Shah@MotilalOswal.com); +91 22 3982 5426
Investors are advised to refer through disclosures made at the end of the Research Report.
Motilal Oswal research is available on
www.motilaloswal.com/Institutional-Equities,
Bloomberg, Thomson Reuters, Factset and S&P Capital.

Bajaj Electricals
Results below estimates
n
n
n
n
BJE reported revenues of INR10.3b (est of INR11.5b) as compared to INR10.3b in
3QFY14, marking a -0.4% growth YoY. Lighting business de-grew by 6.2% YoY to
INR2.3b, while consumer durables de-grew by 2% to INR5.1b. E&P business
grew by 8.9% YoY to INR2.9b.
EBITDA stood at INR-351m (est INR424m) as against INR577m in 3QFY14.
EBITDA margins for 3QFY15 stood at -3.4% (est 3.7%) against 5.6% in 3QFY15.
Lighting division margins stood at 4.6% vs 5.2%, Durables margin stood at 6.7%
vs 9.6% while E&P margins stood at -26.2% vs -4.7%.
PAT stood at INR-523m (est INR70m) as compared to INR200m in 3QFY14.
Exhibit 1: Revenue trend
Revenues (INR m)
11,137
22.5
7,341
6,666
4.7
8,734
10.0
5.1
7,890
18.4
30.8
Growth (YoY) %
12,709
10,274
17.6
14.1
8,876
12.5
7.2
0.2
1QFY13 2QFY13 3QFY13 4QFY13 1QFY14 2QFY14 3QFY14 4QFY14 1QFY15 2QFY15 3QFY15
Source: Company, MOSL
10,295 10,293
9,602
Exhibit 2: EBITDA and EBITDA margin trend
EBITDA (INR m)
5.2
3.4
EBITDA Margin (%)
5.6
4.2
2.6
Exhibit 3: PAT trend
PAT (INR m)
3.7
1.3
1.8
120 270 117
6
7
PAT Margin (%)
1.9
4.4
-0.2
1.2
1.0
-3.4
-16 577 0.4 368
350 246 382 132 202
54
98 -351
(1.4)
0.6 -142 (5.1)
-154 200 -107 56
-523
0.1 0.1 (1.6)
Source: Company, MOSL
(0.8)
Source: Company, MOSL
Lighting and Luminaries business de-growth continues
n
n
n
n
n
Lighting and Luminaries business revenues de-grew by 6.2% YoY to INR2.3b.
EBIT for Lighting and Luminaries division stood at INR107m, decline of 17% YoY
with margins at 4.6% as against 5.2% in 3QFY14.
Management is focusing on introducing and promoting newer LED products, a
segment which was erstwhile not given much attention.
Management doesn’t expect LED to cannibalize its CFL business and expects all
three lighting sub-segments to co-exist.
Market size currently for lighting products: CFL is a 300m piece market; GLS is a
750m piece market, while LED is a 100m piece market.
12 February 2015
2

Bajaj Electricals
Exhibit 4: Lighting division de-grew by 6% YoY
Revenues (INR m)
19.7
6.6
10.7
24.4
14.9
3.2
2,975
1,525
2,018
2,216
2,847
1,574
2,509
2,472
1,686
11.6
4.5
7.2
(10.0)
2,260
(6.2)
2,318
Growth (YoY) %
1QFY13 2QFY13 3QFY13 4QFY13 1QFY14 2QFY14 3QFY14 4QFY14 1QFY15 2QFY15 3QFY15
Source: Company, MOSL
Exhibit 5: Lighting division EBIT margin trend
EBIT (INR m)
7.0
7.9
4.9
7.6
5.2
3.0
1.5
74
130
156
224
77
191
129
89
25
64
107
2.8
EBIT Margin (%)
6.5
4.8
4.6
1QFY13 2QFY13 3QFY13 4QFY13 1QFY14 2QFY14 3QFY14 4QFY14 1QFY15 2QFY15 3QFY15
Source: Company, MOSL
Exhibit 6: RoCE continue to remain high
Capital Employed (INR m)
159.0
96.7
47.0
627
538
604
732
103.5
122.5
114.6
88.4
33.7
911
668
323
402
46.1
796
557
351
121.8
RoCE (%)
12.5
1QFY13 2QFY13 3QFY13 4QFY13 1QFY14 2QFY14 3QFY14 4QFY14 1QFY15 2QFY15 3QFY15
Source: Company, MOSL
Consumer Durables business growth below expectations
n
n
n
n
n
n
Consumer Durable (CD) revenue de-grew by 2.3% YoY to INR5.1b.
Margins for the division stood at 6.7% as against 9.6% in 3QFY14.
In the process of implementing replenishment based distribution structure,
primary sales during the quarter got impacted.
The new model covers B2B and B2C. While B2B is already completed, 20% of
B2C market is completed (another 12-15 months for full completion).
Range, reach and replenishment – is the distribution theme for next year for
consumer durables.
Management expects 10% growth in primary sales, 15% secondary sales in FY16.
3
12 February 2015

Bajaj Electricals
Exhibit 7: Consumer durables de-grew by 2% YoY
Revenues (INR m)
28.9
17.5
22.0
22.4
10.6
13.8
2.9
3,908
3,988
5,046
5,436
4,321
4,539
5,192
16.8
2.6
4,657
Growth (YoY) %
5,330
(2.0)5,046
(2.3)
5,072
1QFY13 2QFY13 3QFY13 4QFY13 1QFY14 2QFY14 3QFY14 4QFY14 1QFY15 2QFY15 3QFY15
Source: Company, MOSL
Exhibit 8: Consumer durable EBIT trend
EBIT (INR m)
12.1
8.4
9.3
8.0
9.3
8.5
EBIT Margin (%)
9.6
6.9
3.6
328
369
609
438
403
386
500
191
346
278
342
6.0
6.7
1QFY13 2QFY13 3QFY13 4QFY13 1QFY14 2QFY14 3QFY14 4QFY14 1QFY15 2QFY15 3QFY15
Source: Company, MOSL
Exhibit 9: Consumer durable capital employed trend
Capital Employed (INR m)
RoCE (%)
106.2
80.3
56.6
40.9
23.4
804
1,577
759
32.2
1,359
22.8
1,770
29.2
1,321
884
717
700
49.5
39.4
706
46.2
742
1QFY13 2QFY13 3QFY13 4QFY13 1QFY14 2QFY14 3QFY14 4QFY14 1QFY15 2QFY15 3QFY15
Source: Company, MOSL
12 February 2015
4

Bajaj Electricals
Exhibit 10: Bajaj Electricals has a huge mass market product portfolio
Segment
Sub-
Segment
Lighting
Lighting
Luminaries
25,000
Mkt Size
(INR m)
50,000
Organized Mkt Share
Description
Competition
(%)
(%)
GLS lamps, fluorescent tube lights, compact
Philips, Crompton,
65%
8%
fluorescent lamps, domestic luminaries, ballasts &
Surya, Havells, etc
starters, LED torches
Industrial, commercial, decorative, street light,
floodlight, LED, lighting electronics, lighting control, Phillips, Crompton,
65%
5%
Wipro, Thorn
HID Lamps: Mercury & sodium vapor lamps,
halogen lamps, metal halide & fluorescent lamps
Ceiling, table, pedestal & wall mounted fans,
Crompton, Usha,
personal fans, Bajaj-Disney children’s fans,
65%
17%
Orient, Khaitan,
Industrial exhaust fans, commercial air industrial
Polar, Havells
fans, circulators, cooler kits and pumps
Mixers grinders, juicers, food processors, water
Philips, Kenstar,
heaters, air coolers, iron, (OTG), room heaters,
Usha, Maharaja,
70%
20%
toasters & S/W makers, hand blenders, water filters
Preeti, Prestige,
microwave ovens gas stove purifiers & filters,
Kenwood
ovens, stoves, electric kettles, coffee/tea makers
Source: Company, MOSL
Fans
Consumer Durables
Appliances
35,000
68,000
Exhibit 11: Bajaj has a strong retail network
Retail Network
400,000
45,000
86,000
Appliances
Fans
Lighting
Source: Company, MOSL
Exhibit 12: Bajaj leads the distribution game…
Channel
Retail Network
EBOs
Bajaj Electricals
4,00,000
Havells
> 1,00,000
TTK Prestige
25,000
Source: Company, MOSL
103 'Bajaj World' Stores 210 'Havells Galaxy' Stores 500 'Prestige Smart Kitchen' Stores
Bajaj World Stores to be expanded aggressively
n
BJE has aggressively grown Bajaj World Stores from 40 in FY13 to 103 in FY14.
Management is confident of doubling store count to 200 by FY15.
Bajaj World Stores
250
200
Exhibit 13: Bajaj World Stores to be significantly expanded
103
40
FY13
FY14
FY15E
FY16E
Source: Company, MOSL
12 February 2015
5

Bajaj Electricals
E&P division revenue growth subdued; margins decline due to write-offs
n
n
n
n
n
E&P division posted a revenue growth of 8.9% to INR2.9b.
During the quarter, company made a provision of INR830m towards doubtful
receivables. Provisions + write offs for 9MFY15 stood at INR1.6b.
With most legacy projects completed and most of the provisions for receivables
have already been made, management expects business to turn-around in FY16.
Order book for E&P stood at INR34.9b, TLT order book – INR6.8, RE order book -
INR24.8b, High Masts order book - INR1.2b.
Management cut its revenue guidance for E&P from INR15b to INR14b for FY15.
Exhibit 14: E&P division grows by 8.9% YoY
Revenues (INR m)
91.8
61.8
8.4
1,232
(22.5)
1,327
(18.1)
1,469
(22.4)
2,852
1,994
2,545
2,667
4,403
7.4
2,142
3,373
32.5
8.9
2,905
Growth (YoY) %
81.6
54.4
1QFY13 2QFY13 3QFY13 4QFY13 1QFY14 2QFY14 3QFY14 4QFY14 1QFY15 2QFY15 3QFY15
Source: Company, MOSL
Exhibit 15: E&P profitability worsened QoQ
EBIT (INR m)
EBIT Margin (%)
1QFY13 2QFY13 3QFY13 4QFY13 1QFY14 2QFY14 3QFY14 4QFY14 1QFY15 2QFY15 3QFY15
-71
-5.7
-13.0
-20.2
-27.1
-17.8
-17.0
-26.2
Source: Company, MOSL
-268
-398
-507
-259
-433
-135
-5.1
-205
-4.7
-2.8
-59-281
-8.3
-761
Exhibit 16: Legacy contracts resulting in losses and sub-optimal return profile
Capital Employed (INR m)
-1.3
-4.5
-6.9
-10.7
5,625
5,918
5,731
4,752
4,892
5,137
5,950
-5.3
-8.4
6,309
-13.0
6,858
7,639
-10.6
7,147
-2.3
RoCE (%)
-0.9
-3.7
1QFY13 2QFY13 3QFY13 4QFY13 1QFY14 2QFY14 3QFY14 4QFY14 1QFY15 2QFY15 3QFY15
Source: Company, MOSL
12 February 2015
6

Bajaj Electricals
Valuation and view
We value BJE at a multiple of 18x FY17E EPS, (20% discount to Havell’s FY17 PE
multiple of 22x), which we believe is justified considering:
n
Leader in small appliances with 15% market share
Bajaj
is the only brand apart from
Havells
that has a pan-India recall. BJE has a huge
product portfolio in the Appliances and Lighting segments, spanning over 2,000
SKUs. The combined market size for BJE’s consumer-facing segments is pegged at
over INR178b, with BJE’s revenues and market share standing at INR26b and 15.2%,
respectively. We believe BJE’s strategy of having a presence across products gives it
a great degree of clout amongst consumers as well as the distribution channel,
which has helped it to grow and sustain its market leadership. It has a wide
distribution reach, with over 4,100 dealers and a 400k strong retail network for
Lighting, 86k dealers for Fans and 45k dealers for Appliances across India.
Manufacturing is entirely outsourced to 80 different vendors across India, leaving
the management free to focus on innovation, brand building and distribution.
n
E&P business set for strong turnaround in FY16
BJE has taken a number of steps in FY15 to revive the performance of the E&P
division. Unlike earlier, the division now reports to the central finance team,
resulting in more prudent supervision. The top management has been revamped,
with industry veteran, Mr. Rakesh Markhedkar replacing internally-groomed Mr.
Lalit Mehta as Business Head. The new management has implemented a strict
project monitoring process, which has ensured better timeliness in execution.
Albeit, taken longer than as expected earlier, we expect the E&P business to post a
strong turnaround in FY16, with revenues growing at a CAGR of 20% over FY15-17
and EBIT margin expanding to +5%.
n
Asset-light business model – manufacturing outsourced to 80 vendors
BJE has an asset-light business model. 95% of the Consumer and Lighting products it
markets are outsourced. BJE has strong long-term relationships with ~80 vendors,
who have been supplying to the company over the last 15-20 years. With this asset
light business model, BJE’s Consumer facing Appliances and Lighting businesses
enjoy RoCE of ~128% and 80% respectively.
Exhibit 17: Peer comparison
Company
Bajaj Electricals
Havells India
TTK Prestige*
V-Guard Industries
Average
CMP
(INR)
216
262
3335
959
MCAP
(USD b)
0.3
2.6
0.6
0.5
FY15E
-8.3
-0.3
100.5
27.5
EPS (INR)
FY16E
12.3
16.9
127.6
38.4
FY17E
16.5
24.7
157.1
55.5
FY15E
57.4
31.1
33.2
38.1
34.1
PE (x)
FY16E
18.1
26.6
26.1
27.3
26.7
FY17E
13.4
21.4
21.2
18.9
20.5
FY15E
-12.8
27.9
18.1
23.4
23.1
RoE (%)
FY16E
18.9
27.8
20.3
26.7
24.9
FY17E
21.7
29.2
22.3
30.8
27.4
Source: Company, MOSL
We value the stock at 18x FY17E EPS and arrive at a target price of INR300 – 35%
upside. Maintain
Buy
rating.
12 February 2015
7

Bajaj Electricals
Story in charts
Exhibit 18: Revenue Contribution (%)
Exhibit 19: Segment Profitability (%)
128%
Engineering
&
Projects, 20
Lighting, 25
Segment RoCE (%)
80%
Consumer
Durables, 50
-26%
Consumer Durables
Lighting
E&P
Source: MOSL, Company
Exhibit 20: E&P segment a drag on overall profitability
E&P Margins (%)
Exhibit 21: Management changes to ensure turnaround
E&P EBIT (INR m)
3.2%
Margin
5.0%
5.0%
961
3.2
5.0
5.0
265
(1,032)
-10.0%
(1,243)
-18.1%
FY12
FY13
FY14
FY15E
FY16E
-9.0%
(1,335)
801
FY12
FY13
FY14
(9.0)
FY15E
(10.0)
FY16E
FY17E
(18.1)
Source: MOSL, Company
FY17E
Source: MOSL, Company
Exhibit 22: Earnings to expand
PAT (INR m)
1,179
512
(53)
FY12
FY13
FY14
FY15E
(838)
Source: MOSL, Company
FY16E
FY17E
1,226
1,653
Exhibit 23: Bajaj Electricals reports strong capital efficiency
RoCE (%)
29
28
13
7
32
FY12
FY13
FY14
0
FY15E
FY16E
FY17E
Source: MOSL, Company
12 February 2015
8

Bajaj Electricals
Key assumptions
Exhibit 24: Key assumptions
Particulars
Segment revenue growth
Lighting
Consumer Durables
Engineering & Projects
Total
Segment EBIT Margins (%)
Lighting
Consumer Durables
Engineering & Projects
Total
Segment Revenue Mix (%)
Lighting
Consumer Durables
Engineering & Projects
Total
Segment EBIT Mix (%)
Lighting
Consumer Durables
Engineering & Projects
Total
14.1
52.2
33.4
100
14.3
56.9
28.7
100
25.0
63.6
11.1
100
53.6
160.2
-114.2
100
51.7
157.6
-109.9
100
165.4
787.7
-853.1
100
14.1
56.4
29.6
100
15.0
56.3
28.7
100
24.0
42.8
33.1
100
23.0
46.6
30.3
100
24.7
48.4
26.8
100
25.4
54.2
20.3
100
23.6
48.2
28.6
100
21.6
47.2
31.2
100
20.1
46.1
33.8
100
18.4
46.2
35.4
100
6.2
13.0
10.7
10.6
5.9
11.5
8.9
9.4
7.8
10.1
3.2
7.7
6.8
9.5
-18.1
3.2
5.1
7.6
-9.0
2.3
2.8
6.1
-10.0
0.4
4.0
7.0
5.0
5.7
5.0
7.5
5.0
6.2
9.7
26.7
41.1
26.2
17.8
33.8
12.9
23.0
21.2
17.5
0.0
13.0
12.5
22.5
-17.3
9.3
10.8
5.7
67.3
19.0
-3.0
4.0
16.0
6.2
3.0
8.0
20.0
10.7
5.0
15.0
20.0
14.7
FY10
FY11
FY12
FY13
FY14
FY15E
FY16E
FY17E
Source: Company, MOSL
12 February 2015
9

Bajaj Electricals
Financials and valuations
Standalone - Income Statement
Y/E March
Gross Revenues
Less: Excise Duty
Net Sales
Change (%)
EBITDA
Margin (%)
Depreciation
EBIT
Int. and Finance Charges
Other Income - Rec.
PBT bef. EO Exp.
EO Expense/(Income)
PBT after EO Exp.
Current Tax
Deferred Tax
Tax Rate (%)
Reported PAT
PAT Adj for EO items
Change (%)
Margin (%)
FY10
22,494
208
22,286
26.2
2,427
10.9
92
2,335
371
92
2,056
50
2,006
872
-37
41.6
1,171
1,200
34.5
5.4
FY11
27,654
241
27,414
23.0
2,549
9.3
108
2,441
367
161
2,235
50
2,185
763
-15
34.2
1,438
1,471
22.5
5.4
FY12
31,299
309
30,990
13.0
2,372
7.7
125
2,246
630
144
1,760
0
1,760
580
1
33.0
1,179
1,179
-19.8
3.8
FY13
34,128
252
33,876
9.3
1,108
3.3
145
963
690
169
443
-247
690
238
-60
25.8
512
329
-72.1
1.0
FY14
40,647
349
40,298
19.0
818
2.0
247
571
783
153
-60
0
-60
168
-174
11.0
-53
-53
-116.2
-0.1
FY15E
43,204
391
42,813
6.2
128
0.3
334
-205
1,040
171
-1,074
0
-1,074
-236
0
22.0
-838
-838
1,477.7
-2.0
(INR Million)
FY16E
47,809
433
47,376
10.7
3,079
6.5
390
2,690
1,045
213
1,858
0
1,858
632
0
34.0
1,226
1,226
-246.4
2.6
FY17E
54,825
496
54,329
14.7
3,803
7.0
430
3,373
1,113
244
2,504
0
2,504
851
0
34.0
1,653
1,653
34.8
3.0
Standalone - Balance Sheet
Y/E March (Rs mn)
Equity Share Capital
Total Reserves
Net Worth
Deferred Liabilities
Total Loans
Capital Employed
Gross Block
Less: Accum. Deprn.
Net Fixed Assets
Capital WIP
Total Investments
Curr. Assets, Loans&Adv.
Inventory
Account Receivables
Cash and Bank Balance
Loans and Advances
Curr. Liability & Prov.
Account Payables
Other Current Liabilities
Provisions
Net Current Assets
Appl. of Funds
E: MOSL Estimates
FY10
195
4,749
4,944
-5
1,518
6,457
1,700
683
1,016
1
366
12,004
2,094
7,507
612
1,791
6,930
3,035
3,252
643
5,074
6,457
FY11
198
5,913
6,111
-20
1,170
7,261
2,302
769
1,533
0
366
15,739
2,946
9,112
486
3,195
10,377
4,220
5,426
731
5,362
7,261
FY12
199
6,799
6,999
-19
2,091
9,070
2,721
881
1,840
30
441
17,191
3,552
9,220
536
3,882
10,432
3,717
5,918
797
6,759
9,070
FY13
200
7,087
7,286
-79
1,659
8,866
3,260
996
2,264
59
298
18,874
4,212
9,379
501
4,781
12,628
4,505
7,341
782
6,246
8,866
FY14
200
6,896
7,096
-253
3,484
10,327
3,723
1,231
2,492
26
673
23,482
4,467
12,427
544
6,045
16,346
5,466
9,956
925
7,136
10,327
FY15E
200
5,825
6,024
-253
3,984
9,755
4,623
1,564
3,058
0
673
22,353
4,899
10,557
476
6,422
16,329
5,920
9,278
1,131
6,024
9,755
(INR Million)
FY16E
200
6,770
6,970
-253
3,884
10,601
5,123
1,954
3,168
0
673
24,440
5,004
11,682
648
7,106
17,681
6,047
10,267
1,366
6,759
10,601
FY17E
200
8,095
8,295
-253
3,784
11,826
5,623
2,384
3,239
0
673
28,208
5,701
13,396
962
8,149
20,294
6,889
11,774
1,631
7,915
11,826
12 February 2015
10

Bajaj Electricals
Financials and valuations
Ratios
Y/E March
Basic (INR)
EPS
Cash EPS
BV/Share
DPS
Payout (%)
Valuation (x)
P/E
Cash P/E
P/BV
EV/Sales
EV/EBITDA
Dividend Yield (%)
Return Ratios (%)
RoE
RoCE
Working Capital Ratios
Asset Turnover (x)
Inventory (Days)
Debtor (Days)
Leverage Ratio (x)
Current Ratio
Debt/Equity
FY10
12.3
13.2
50.7
2.4
23.3
FY11
14.9
16.0
61.8
2.8
22.4
FY12
11.8
13.1
70.2
2.8
27.5
FY13
3.3
4.7
73.0
2.0
45.6
FY14
-0.5
1.9
71.0
1.5
-330.5
-418.1
114.2
3.1
0.6
30.7
0.7
32.5
43.9
3.5
34.3
122
1.7
0.3
26.6
37.9
3.8
39.2
120
1.5
0.2
18.0
29.2
3.4
41.8
108
1.6
0.3
4.6
12.6
3.8
45.4
100
1.5
0.2
-0.7
7.4
3.9
40.5
112
1.4
0.5
FY15E
-8.4
-5.0
60.3
2.0
-27.9
-26.5
-44.1
3.7
0.6
200.1
0.9
-12.8
-0.3
4.4
41.8
89
1.4
0.7
FY16E
12.3
16.2
69.7
2.4
22.9
18.1
13.7
3.2
0.5
8.3
1.1
18.9
27.8
4.5
38.6
89
1.4
0.6
FY17E
16.5
20.8
83.0
2.8
19.8
13.4
10.7
2.7
0.5
6.6
1.3
21.7
31.5
4.6
38.3
89
1.4
0.5
Standalone - Cash Flow Statement
Y/E March (Rs mn)
NP / (Loss) Before Tax and EO Items
Depreciation
Interest & Finance Charges
Direct Taxes Paid
(Inc)/Dec in WC
CF from Operations
Others
CF from Operating incl EO
(inc)/dec in FA
(Pur)/Sale of Investments
Others
CF from Investments
(Inc)/Dec in Debt
Interest Paid
Dividend Paid
CF from Fin. Activity
Inc/Dec of Cash
Add: Beginning Balance
Closing Balance
E: MOSL Estimates
FY10
2,109
92
371
917
-1,564
91
-50
40
-144
-50
-190
-384
-675
1,265
-172
418
74
538
612
FY11
2,186
108
368
806
-773
1,082
42
1,124
-215
0
-74
-290
-411
-315
-235
-961
-127
612
486
FY12
1,760
125
607
600
-1,278
614
143
756
-660
-75
59
-676
840
-567
-278
-5
75
461
536
FY13
690
145
671
398
171
1,279
144
1,422
-392
-70
461
-2
-500
-660
-279
-1,439
-18
519
501
FY14
-60
247
728
302
-1,294
-679
614
-65
-500
-376
135
-741
1,789
-688
-234
867
62
483
544
FY15E
-1,074
334
868
-236
1,044
1,409
0
1,409
-874
0
171
-703
500
-1,040
-234
-774
-68
544
476
FY16E
1,858
390
832
632
-564
1,884
0
1,884
-500
0
213
-287
-100
-1,045
-281
-1,426
172
476
648
(INR Million)
FY17E
2,504
430
869
851
-841
2,111
0
2,111
-500
0
244
-256
-100
-1,113
-327
-1,541
315
648
963
12 February 2015
11

Bajaj Electricals
Corporate profile: Bajaj Electricals
Company description
BJE operates largely in three segments – Lighting &
Luminaires (LL), Consumer Durables (CD) and
Engineering & Projects (E&P). The CD segment
contributes ~55% to revenues, while the LL
segment contributes ~25% to revenues. Together,
Consumer-facing
Appliances
and
Lighting
businesses, for which BJE is known for, contribute
~80% to revenues. The E&P segment contributes
~20% to revenues.
BJE has a wide distribution reach, with over 4,100
dealers and a 400k strong retail network for
Lighting, 86k dealers for Fans and 45k dealers for
Appliances across India. Manufacturing is entirely
outsourced to 80 different vendors across India,
leaving the management free to focus on
innovation, brand building and distribution.
Exhibit 26: Shareholding pattern (%)
Dec-14
Promoter
DII
FII
Others
65.6
5.0
13.9
15.5
Sep-14
65.6
6.0
14.0
14.4
Dec-13
66.2
2.9
15.4
15.5
Exhibit 25: Sensex rebased
Exhibit 27: Top holders
Holder Name
MFS International New Discovery Fund
Mondrian Emerging Markets Small Cap Equity Fund
HDFC Trustee Company Ltd HDFC Prudence Fund
Swiss Finance Corporation (Mauritius) Ltd
L AND T Mid Cap Fund Trustee Ltd L & T Equity Fund
Ontario Pension Board Mondrian Investment Partners
% Holding
3.2
2.3
2.3
1.5
1.3
1.2
Note: FII Includes depository receipts
Exhibit 28: Top management
Name
Shekhar Bajaj
Anant Bajaj
Madhur Bajaj
Designation
Chairman & Managing Director
Joint Managing Director
Director
Exhibit 29: Directors
Name
Shekhar Bajaj
Anant Bajaj
Madhur Bajaj
R P Singh*
Ashok Jalan*
*Independent
Name
Indu Shahani*
V B Haribhakti*
Ajit Gulabchand*
Harsh Vardhan Goenka*
Exhibit 30: Auditors
Name
Dalal & Shah
R Nanabhoy & Co
Type
Statutory
Cost Auditor
Exhibit 31: MOSL forecast v/s consensus
EPS
(INR)
FY15
FY16
FY17
MOSL
forecast
-8.4
12.3
16.5
Consensus
forecast
5.7
14.7
19.2
Variation
(%)
-
-16.2
-13.9
12 February 2015
12

Bajaj Electricals
NOTES
12 February 2015
13

This document has been prepared by Motilal Oswal Securities Limited (hereinafter referred to as Most) to provide information about the company(ies) and/sector(s), if any, covered in the report and may be
distributed by it and/or its affiliated company(ies). This report is for personal information of the selected recipient/s and does not construe to be any investment, legal or taxation advice to you. This research report does
not constitute an offer, invitation or inducement to invest in securities or other investments and Motilal Oswal Securities Limited (hereinafter referred as MOSt) is not soliciting any action based upon it. This report is not
for public distribution and has been furnished to you solely for your general information and should not be reproduced or redistributed to any other person in any form. This report does not constitute a personal
recommendation or take into account the particular investment objectives, financial situations, or needs of individual clients. Before acting on any advice or recommendation in this material, investors should consider
whether it is suitable for their particular circumstances and, if necessary, seek professional advice. The price and value of the investments referred to in this material and the income from them may go down as well as
up, and investors may realize losses on any investments. Past performance is not a guide for future performance, future returns are not guaranteed and a loss of original capital may occur.
MOSt and its affiliates are a full-service, integrated investment banking, investment management, brokerage and financing group. We and our affiliates have investment banking and other business relationships with a
some companies covered by our Research Department. Our research professionals may provide input into our investment banking and other business selection processes. Investors should assume that MOSt and/or
its affiliates are seeking or will seek investment banking or other business from the company or companies that are the subject of this material and that the research professionals who were involved in preparing this
material may educate investors on investments in such business. The research professionals responsible for the preparation of this document may interact with trading desk personnel, sales personnel and other
parties for the purpose of gathering, applying and interpreting information. Our research professionals are paid on the profitability of MOSt which may include earnings from investment banking and other business.
MOSt generally prohibits its analysts, persons reporting to analysts, and members of their households from maintaining a financial interest in the securities or derivatives of any companies that the analysts cover.
Additionally, MOSt generally prohibits its analysts and persons reporting to analysts from serving as an officer, director, or advisory board member of any companies that the analysts cover. Our salespeople, traders,
and other professionals or affiliates may provide oral or written market commentary or trading strategies to our clients that reflect opinions that are contrary to the opinions expressed herein, and our proprietary
trading and investing businesses may make investment decisions that are inconsistent with the recommendations expressed herein. In reviewing these materials, you should be aware that any or all of the foregoing
among other things, may give rise to real or potential conflicts of interest. MOSt and its affiliated company(ies), their directors and employees and their relatives may; (a) from time to time, have a long or short position
in, act as principal in, and buy or sell the securities or derivatives thereof of companies mentioned herein. (b) be engaged in any other transaction involving such securities and earn brokerage or other compensation
or act as a market maker in the financial instruments of the company(ies) discussed herein or act as an advisor or lender/borrower to such company(ies) or may have any other potential conflict of interests with
respect to any recommendation and other related information and opinions.; however the same shall have no bearing whatsoever on the specific recommendations made by the analyst(s), as the recommendations
made by the analyst(s) are completely independent of the views of the affiliates of MOSt even though there might exist an inherent conflict of interest in some of the stocks mentioned in the research report
Reports based on technical and derivative analysis center on studying charts company's price movement, outstanding positions and trading volume, as opposed to focusing on a company's fundamentals and, as
such, may not match with a report on a company's fundamental analysis. In addition MOST has different business segments / Divisions with independent research separated by Chinese walls catering to different set
of customers having various objectives, risk profiles, investment horizon, etc, and therefore may at times have different contrary views on stocks sectors and markets.
Unauthorized disclosure, use, dissemination or copying (either whole or partial) of this information, is prohibited. The person accessing this information specifically agrees to exempt MOSt or any of its affiliates or
employees from, any and all responsibility/liability arising from such misuse and agrees not to hold MOSt or any of its affiliates or employees responsible for any such misuse and further agrees to hold MOSt or any of
its affiliates or employees free and harmless from all losses, costs, damages, expenses that may be suffered by the person accessing this information due to any errors and delays. The information contained herein is
based on publicly available data or other sources believed to be reliable. Any statements contained in this report attributed to a third party represent MOSt’s interpretation of the data, information and/or opinions
provided by that third party either publicly or through a subscription service, and such use and interpretation have not been reviewed by the third party. This Report is not intended to be a complete statement or
summary of the securities, markets or developments referred to in the document. While we would endeavor to update the information herein on reasonable basis, MOSt and/or its affiliates are under no obligation to
update the information. Also there may be regulatory, compliance, or other reasons that may prevent MOSt and/or its affiliates from doing so. MOSt or any of its affiliates or employees shall not be in any way
responsible and liable for any loss or damage that may arise to any person from any inadvertent error in the information contained in this report. MOSt or any of its affiliates or employees do not provide, at any time,
any express or implied warranty of any kind, regarding any matter pertaining to this report, including without limitation the implied warranties of merchantability, fitness for a particular purpose, and non-infringement.
The recipients of this report should rely on their own investigations.
This report is intended for distribution to institutional investors. Recipients who are not institutional investors should seek advice of their independent financial advisor prior to taking any investment decision based on
this report or for any necessary explanation of its contents.
Most and it’s associates may have managed or co-managed public offering of securities, may have received compensation for investment banking or merchant banking or brokerage services, may have received any
compensation for products or services other than investment banking or merchant banking or brokerage services from the subject company in the past 12 months.
Most and it’s associates have not received any compensation or other benefits from the subject company or third party in connection with the research report.
Subject Company may have been a client of Most or its associates during twelve months preceding the date of distribution of the research report
MOSt and/or its affiliates and/or employees may have interests/positions, financial or otherwise of over 1 % at the end of the month immediately preceding the date of publication of the research in the securities
mentioned in this report. To enhance transparency, MOSt has incorporated a Disclosure of Interest Statement in this document. This should, however, not be treated as endorsement of the views expressed in the
report.
Motilal Oswal Securities Limited is under the process of seeking registration under SEBI (Research Analyst) Regulations, 2014.
There are no material disciplinary action that been taken by any regulatory authority impacting equity research analysis activities
Analyst Certification
The views expressed in this research report accurately reflect the personal views of the analyst(s) about the subject securities or issues, and no part of the compensation of the research analyst(s) was, is, or will be
directly or indirectly related to the specific recommendations and views expressed by research analyst(s) in this report. The research analysts, strategists, or research associates principally responsible for preparation
of MOSt research receive compensation based upon various factors, including quality of research, investor client feedback, stock picking, competitive factors and firm revenues
Disclosure of Interest Statement
§
Analyst ownership of the stock
§
Served as an officer, director or employee
BAJAJ ELECTRICALS
No
No
Disclosures
Bajaj Electricals
Regional Disclosures (outside India)
For U.S.
This report is not directed or intended for distribution to or use by any person or entity resident in a state, country or any jurisdiction, where such distribution, publication, availability or use would be contrary to law,
regulation or which would subject MOSt & its group companies to registration or licensing requirements within such jurisdictions.
Motilal Oswal Securities Limited (MOSL) is not a registered broker - dealer under the U.S. Securities Exchange Act of 1934, as amended (the"1934 act") and under applicable state laws in the United States. In
addition MOSL is not a registered investment adviser under the U.S. Investment Advisers Act of 1940, as amended (the "Advisers Act" and together with the 1934 Act, the "Acts), and under applicable state laws in the
United States. Accordingly, in the absence of specific exemption under the Acts, any brokerage and investment services provided by MOSL, including the products and services described herein are not available to or
intended for U.S. persons.
This report is intended for distribution only to "Major Institutional Investors" as defined by Rule 15a-6(b)(4) of the Exchange Act and interpretations thereof by SEC (henceforth referred to as "major institutional
investors"). This document must not be acted on or relied on by persons who are not major institutional investors. Any investment or investment activity to which this document relates is only available to major
institutional investors and will be engaged in only with major institutional investors. In reliance on the exemption from registration provided by Rule 15a-6 of the U.S. Securities Exchange Act of 1934, as amended (the
"Exchange Act") and interpretations thereof by the U.S. Securities and Exchange Commission ("SEC") in order to conduct business with Institutional Investors based in the U.S., MOSL has entered into a chaperoning
agreement with a U.S. registered broker-dealer, Motilal Oswal Securities International Private Limited. ("MOSIPL"). Any business interaction pursuant to this report will have to be executed within the provisions of this
chaperoning agreement.
The Research Analysts contributing to the report may not be registered /qualified as research analyst with FINRA. Such research analyst may not be associated persons of the U.S. registered broker-dealer, MOSIPL,
and therefore, may not be subject to NASD rule 2711 and NYSE Rule 472 restrictions on communication with a subject company, public appearances and trading securities held by a research analyst account.
Motilal Oswal Capital Markets Singapore Pte Limited is acting as an exempt financial advisor under section 23(1)(f) of the Financial Advisers Act(FAA) read with regulation 17(1)(d) of the Financial Advisors
Regulations and is a subsidiary of Motilal Oswal Securities Limited in India. This research is distributed in Singapore by Motilal Oswal Capital Markets Singapore Pte Limited and it is only directed in Singapore to
accredited investors, as defined in the Financial Advisers Regulations and the Securities and Futures Act (Chapter 289), as amended from time to time.
In respect of any matter arising from or in connection with the research you could contact the following representatives of Motilal Oswal Capital Markets Singapore Pte Limited:
Anosh Koppikar
Kadambari Balachandran
Email : anosh.Koppikar@motilaloswal.com
Email : kadambari.balachandran@motilaloswal.com
Contact : (+65)68189232
Contact : (+65) 68189233 / 65249115
Office Address : 21 (Suite 31),16 Collyer Quay,Singapore 04931
For Singapore
12 February 2015
Motilal Oswal Securities Ltd
Motilal Oswal Tower, Level 9, Sayani Road, Prabhadevi, Mumbai 400 025
Phone: +91 22 3982 5500 E-mail: reports@motilaloswal.com
14